
Published: August 19th, 2025
Due to the steady and enduring quality of its TurboTax software, Intuit has experienced an average increase in sales of 16% over the past ten years, combined with a typical rise in GAAP earnings of about 15%.
Over the past five years, INTU has dramatically increased its reach. With a combined customer base of almost 100 million, it has evolved into an all-encompassing resource for consumers and businesses, including finance, email marketing, and more through Credit Karma, TurboTax, QuickBooks, and Mailchimp.
To ensure that it doesn't fall behind possible startup AI competitors in the tax preparation software market and beyond, Intuit is significantly increasing its artificial intelligence initiatives. The business offers an aided tax preparation service called TurboTax Live, which mixes AI technology with human professionals. Last quarter, its sales jumped 47% to $2 billion.
Growth throughout Intuit's whole portfolio was fueled by AI-powered breakthroughs and customised solutions. In planned remarks, CEO Sasan Goodarzi stated that they are reinventing what's feasible with artificial intelligence by establishing a one-stop shop of AI-agents, powered by artificial intelligence human resources.
To continue its run of double-digit revenue expansion, INTU is expected to increase its revenue by 15% in FY25 and 12% in FY2026 to achieve $20.94 billion from $16.29 billion the previous year.
Over the last 20 years, Intuit has increased by around 3,000%, surpassing Microsoft's 1,800% gain and more than tripling Tech's 834%. In the previous ten years, it has outperformed Tech by 700% compared to 410%.
Let's see the further aspect of this stock from the INTU technical analysis:
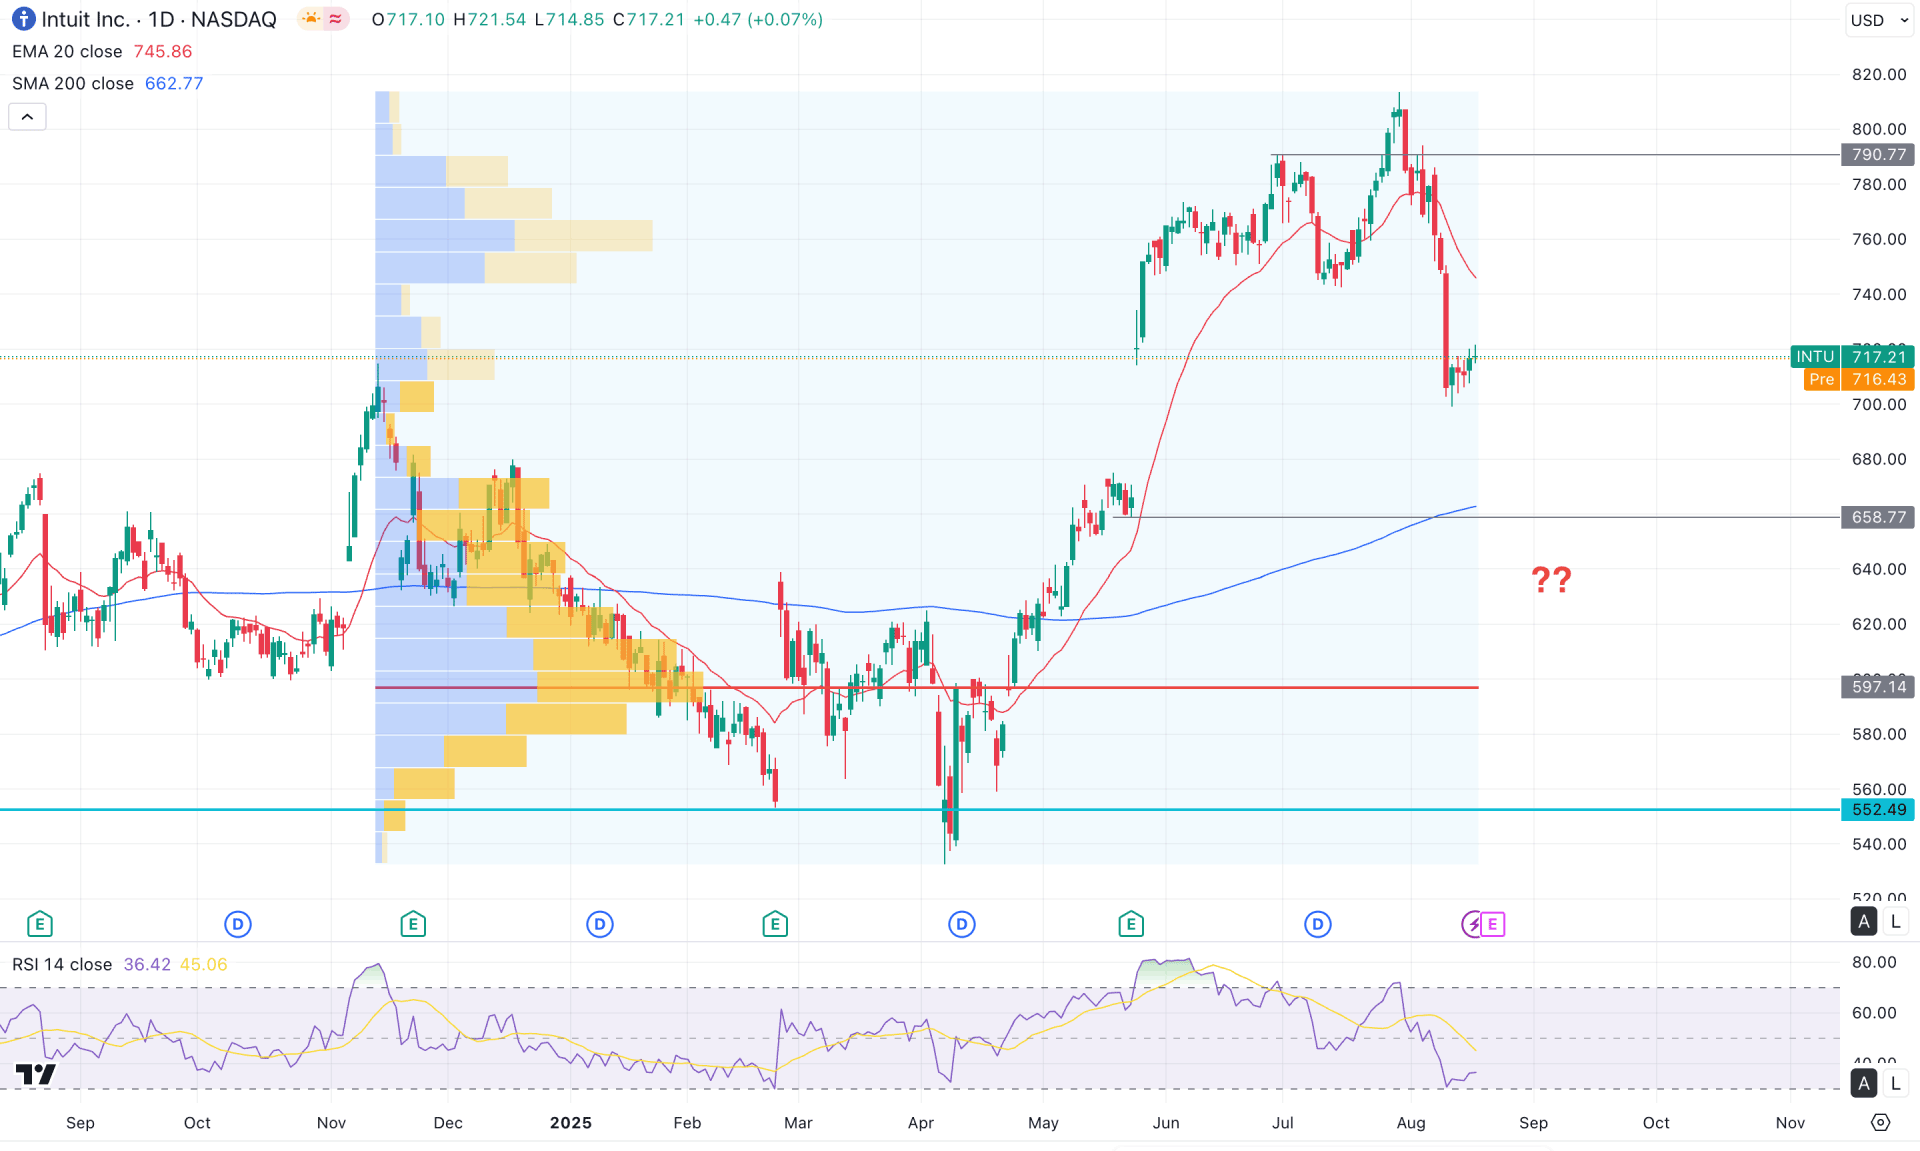
On the daily chart of the Intuit stock (INTU), the existing market momentum remains bullish, with the current price trading near the all-time high area. Although some minor selling pressure is visible from the 800.00 psychological level, the broader market sentiment still favours buyers.
In the higher timeframe, an extended bearish correction is possible, as the price recently formed a new monthly low after an indecision candle in July 2025. However, the strong bullish body of May 2025 is still in play, suggesting a potential recovery from a discounted zone. On the weekly chart, a range breakout (AB) is visible, but the price is currently trading within a strong liquidity area. In that case, a consolidation below the 744.05 weekly resistance could trigger further selling pressure.
From a volume structure perspective, the most significant activity level since November 2025 is well below the current price, signalling room for a potential correction. The high-volume level is marked at 597.14, which is about 16.57% lower than the current price.
Meanwhile, the 200-day SMA remains intact and is acting as a crucial support level below the current market price. Since the price is still hovering above the 200-day SMA line, investors might expect a rebound in time.
In the secondary indicator window, the Relative Strength Index (RSI) has dipped lower but found support at the 30.0 oversold level.
Based on this outlook, the primary expectation is for the stock to face increased selling pressure, with the key downside target at the 658.77 support level. However, investors should closely monitor price action around the 200-day SMA. If the price bounces from the 680.00 to 597.14 area, it could offer a bullish reversal setup from a crucial discounted zone.
On the other hand, before opening a long position, a strong bullish daily close above the 200-day SMA is needed for confirmation. An immediate long entry is also possible if the price closes above the 790.77 level, which could extend the ongoing bullish momentum.
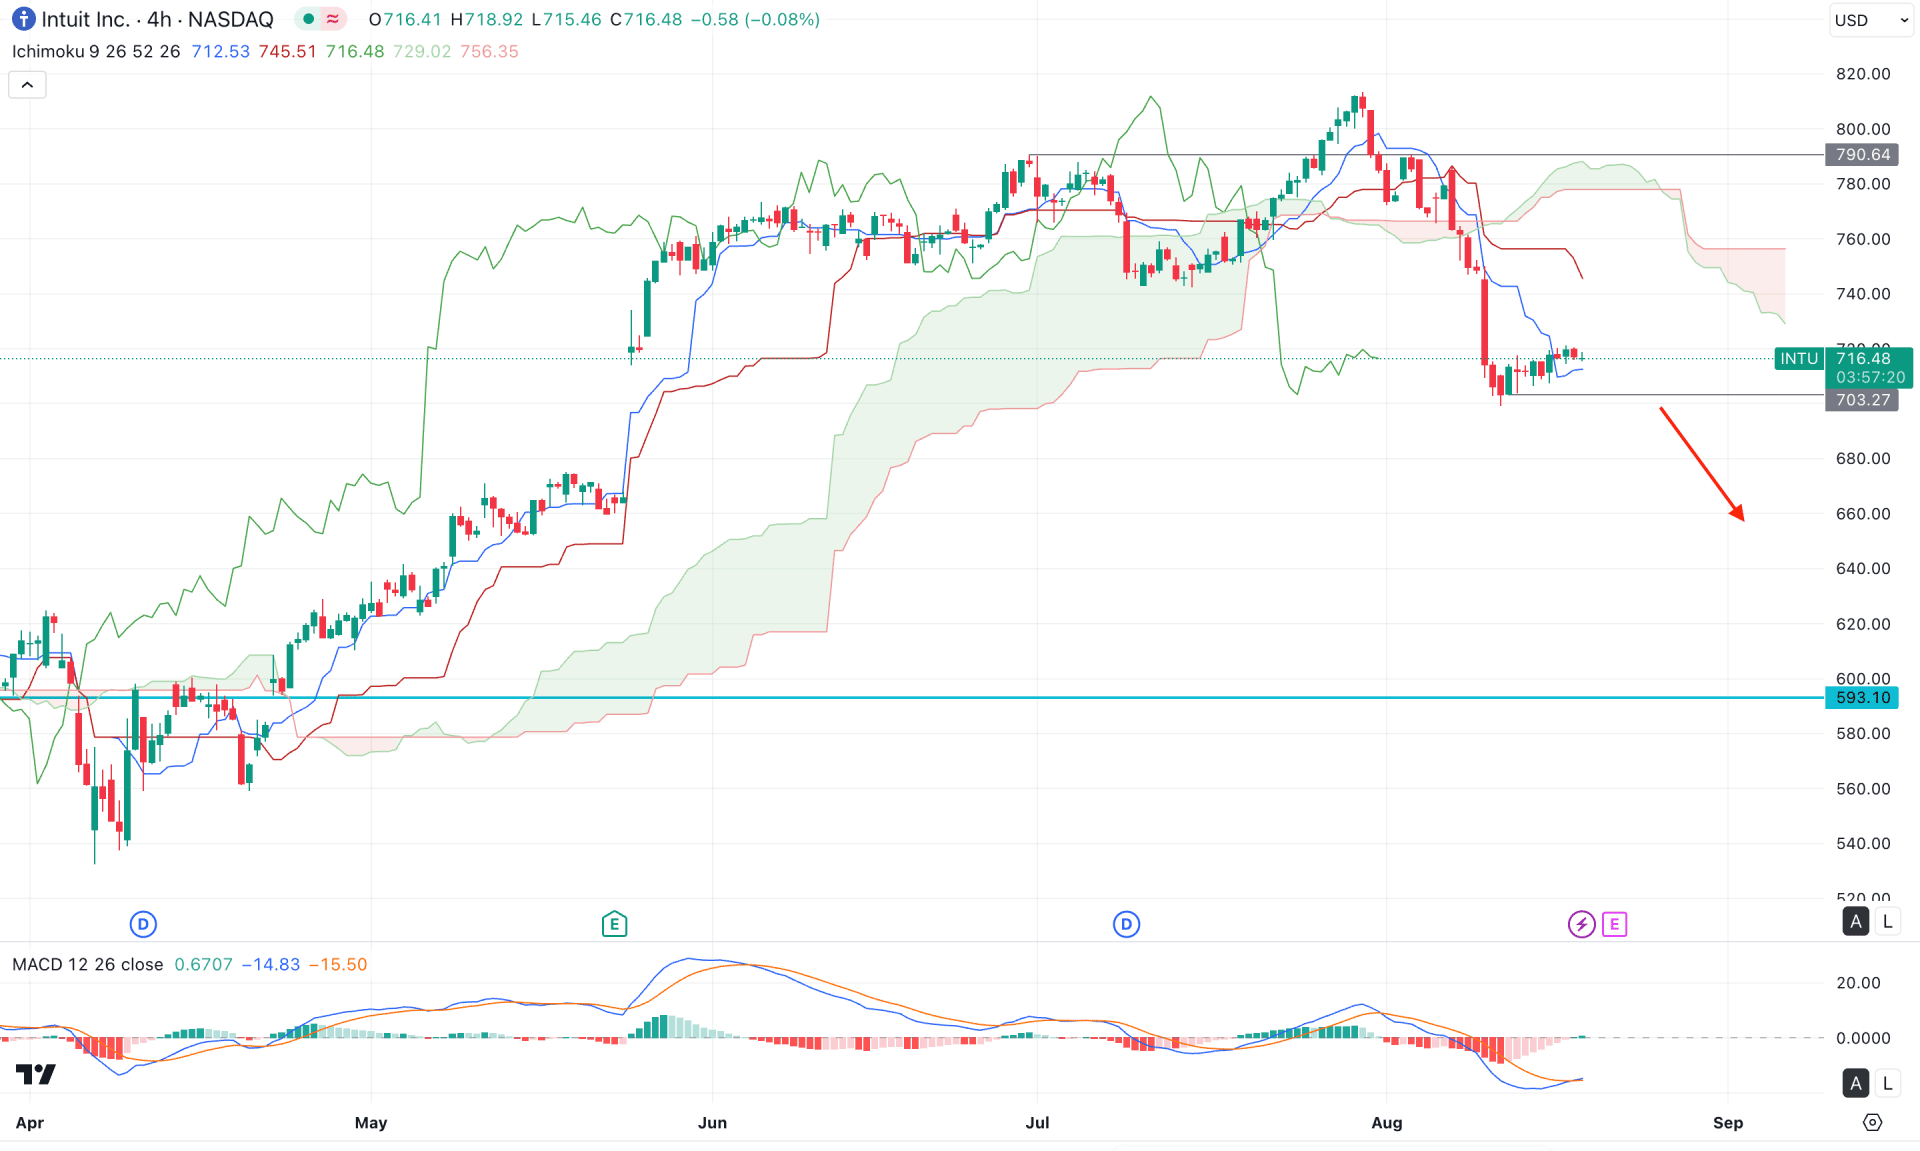
In the H4 timeframe, the recent price showed a strong bearish reversal that came after a solid buy-side liquidity sweep from the 790.64 event level. The price went higher above this line and formed an immediate bearish reversal below the dynamic Ichimoku Cloud zone. As the current price is stalling below this zone, investors might expect a downside continuation in the coming hours.
On the other hand, the Futures cloud is positive to sellers as the Senkou Span A flipped the position below the Senkou Span B. It is a sign that the short-term market trend has shifted the momentum from bullish to bearish, signalling an early short opportunity.
In the secondary indicator window, the Relative Strength Index is hovering between 30.00 and 50.00, signalling downside pressure. However, an early bottom is visible from the MACD Signal line, which formed a bullish crossover at the bottom.
Based on this outlook, investors should closely monitor how the price reacts to the near-term support of the 700.00 level. A valid selling pressure with a bearish H4 candle below this level could open a decent short opportunity, targeting the 593.10 support level.
On the other hand, an immediate bullish reversal with a valid price action above the cloud area could be a solid long opportunity. In that case, the price might extend the ongoing buying pressure above the 820.00 area.
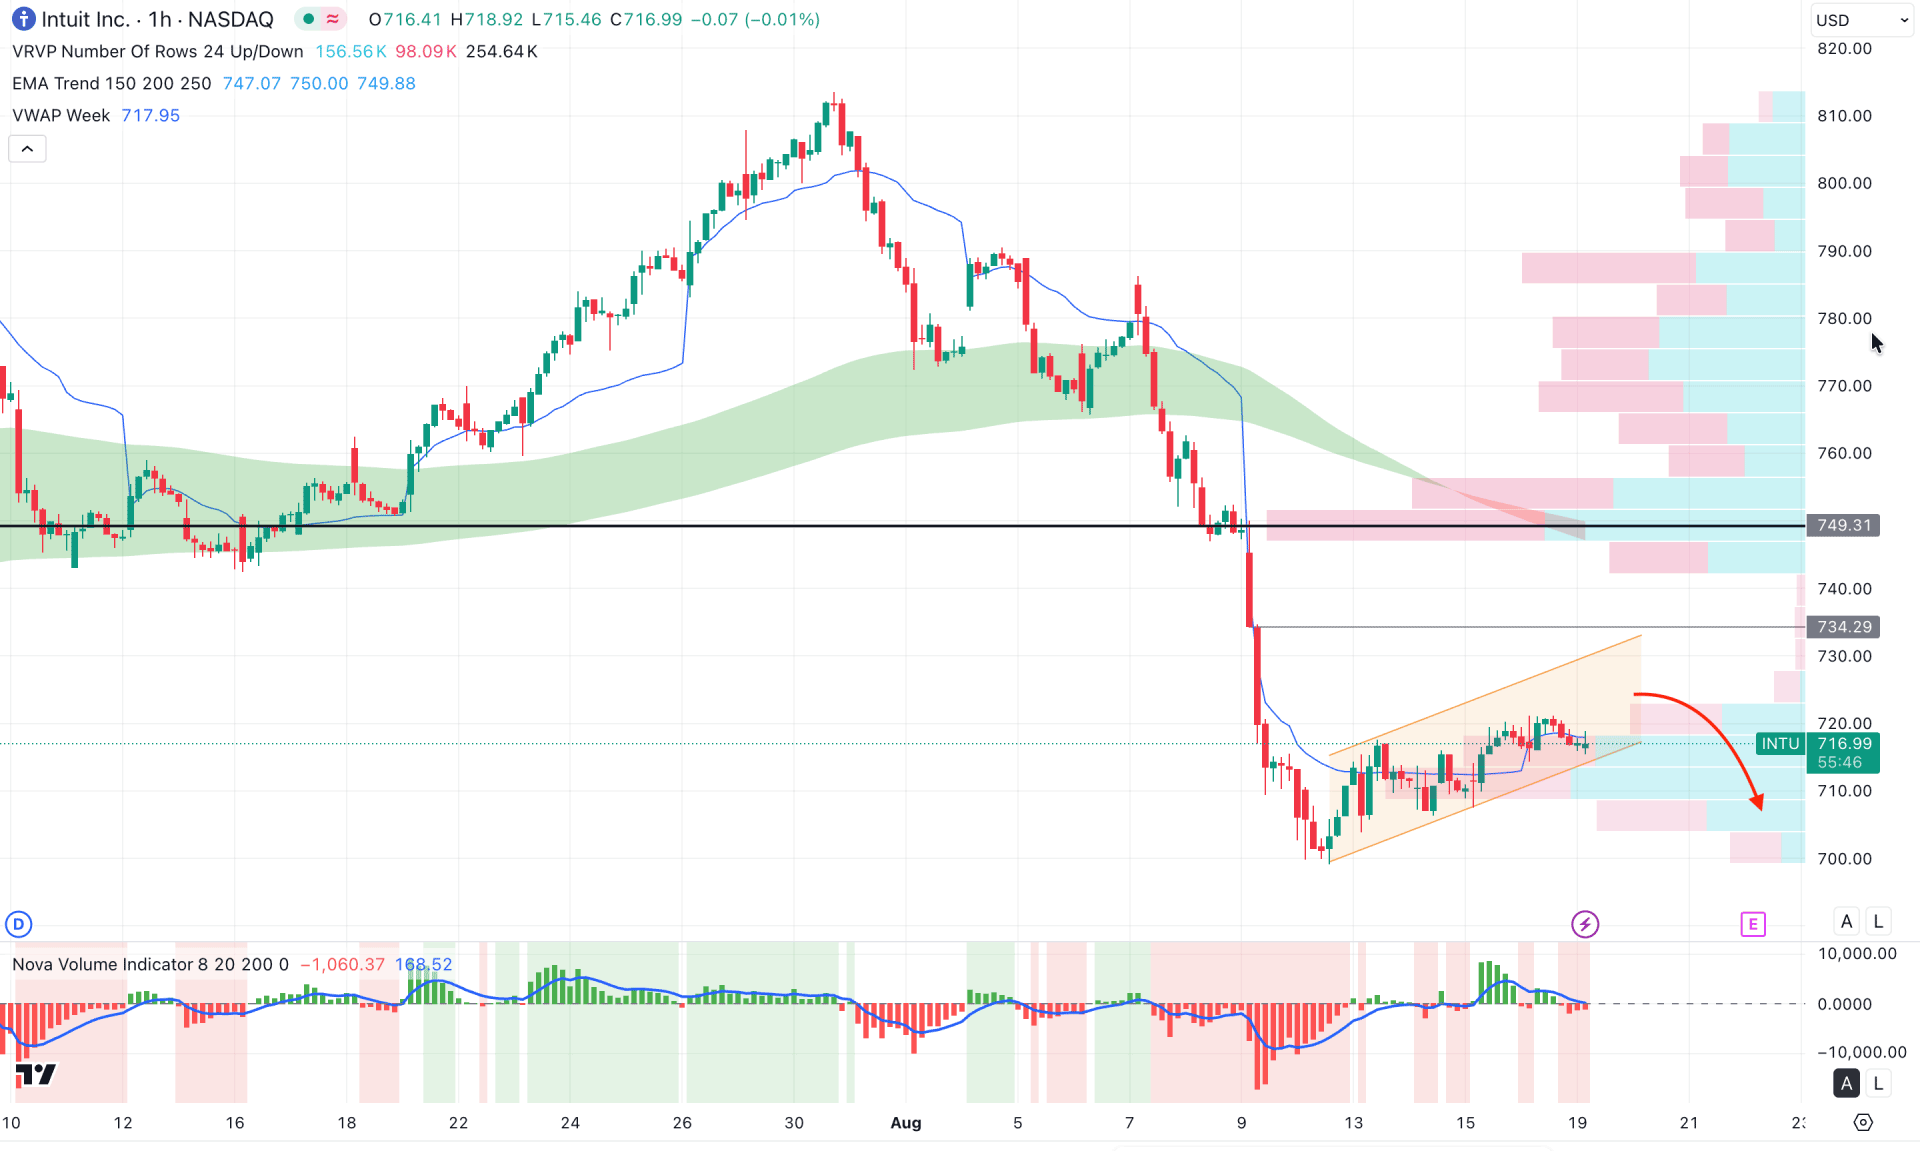
In the hourly timeframe, the recent price is trading within downside pressure as the EMA wave is acting as a crucial resistance. Moreover, the current price is trading within an ascending channel from where a valid break is pending.
In the secondary indicator window, the volume histogram indicates minor downside pressure, as the current vertical line is positioned below the neutral line.
Moreover, the weekly VWAP is hovering near the current price, acting as an indecisive momentum.
Based on this outlook, a valid channel breakout with an hourly close below the 700.00 psychological level could be a potential short opportunity in the coming session. However, an immediate bullish reversal with an hourly close above the intraday high volume line could signal a potential trend reversal.
Based on the broader market structure, INTU is trading in the premium zone, from where a decent downside recovery is pending. However, the major market trend remains bullish as shown in the daily chart. In that case, any bullish continuation from the intraday bottom could be an early long signal.


