
Published: June 5th, 2024
Multiple ECB committee members have expressed their preference for a 25 basis point rate cut from the ECB, so anything other than this would be a significant surprise. The European economy has needed a stimulus since Q4 2022, when growth stagnated. The ECB has the opportunity to contemplate lowering interest rates for the first time since 2019 due to the encouraging progress on inflation and the numerous quarters of zero or near-zero GDP growth.
In April, inflation in the Eurozone unexpectedly increased; however, it is improbable that this will impede the recent progress in returning prices to 2%. According to previous statements from ECB officials, a gradual reduction process is anticipated, with preliminary indications suggesting a pause in July.
According to government data published on Tuesday, Swiss inflation remained consistent in May, which suggests that the Swiss National Bank (SNB) might reduce interest rates once more later this month.
According to the Federal Statistics Department, prices in May increased by 1.4% from the previous year, which is consistent with April's rate. The figure was consistent with the Reuters poll forecast and was the final inflation data before the SNB's subsequent rate decision on June 20. Following the publication of the inflation data, the probability of a 25 basis point reduction from 1.5% in market expectations increased to 56%, up from 51% previously. The SNB declined to respond.
Let's see the future price direction of this instrument from the EURCHF technical analysis:
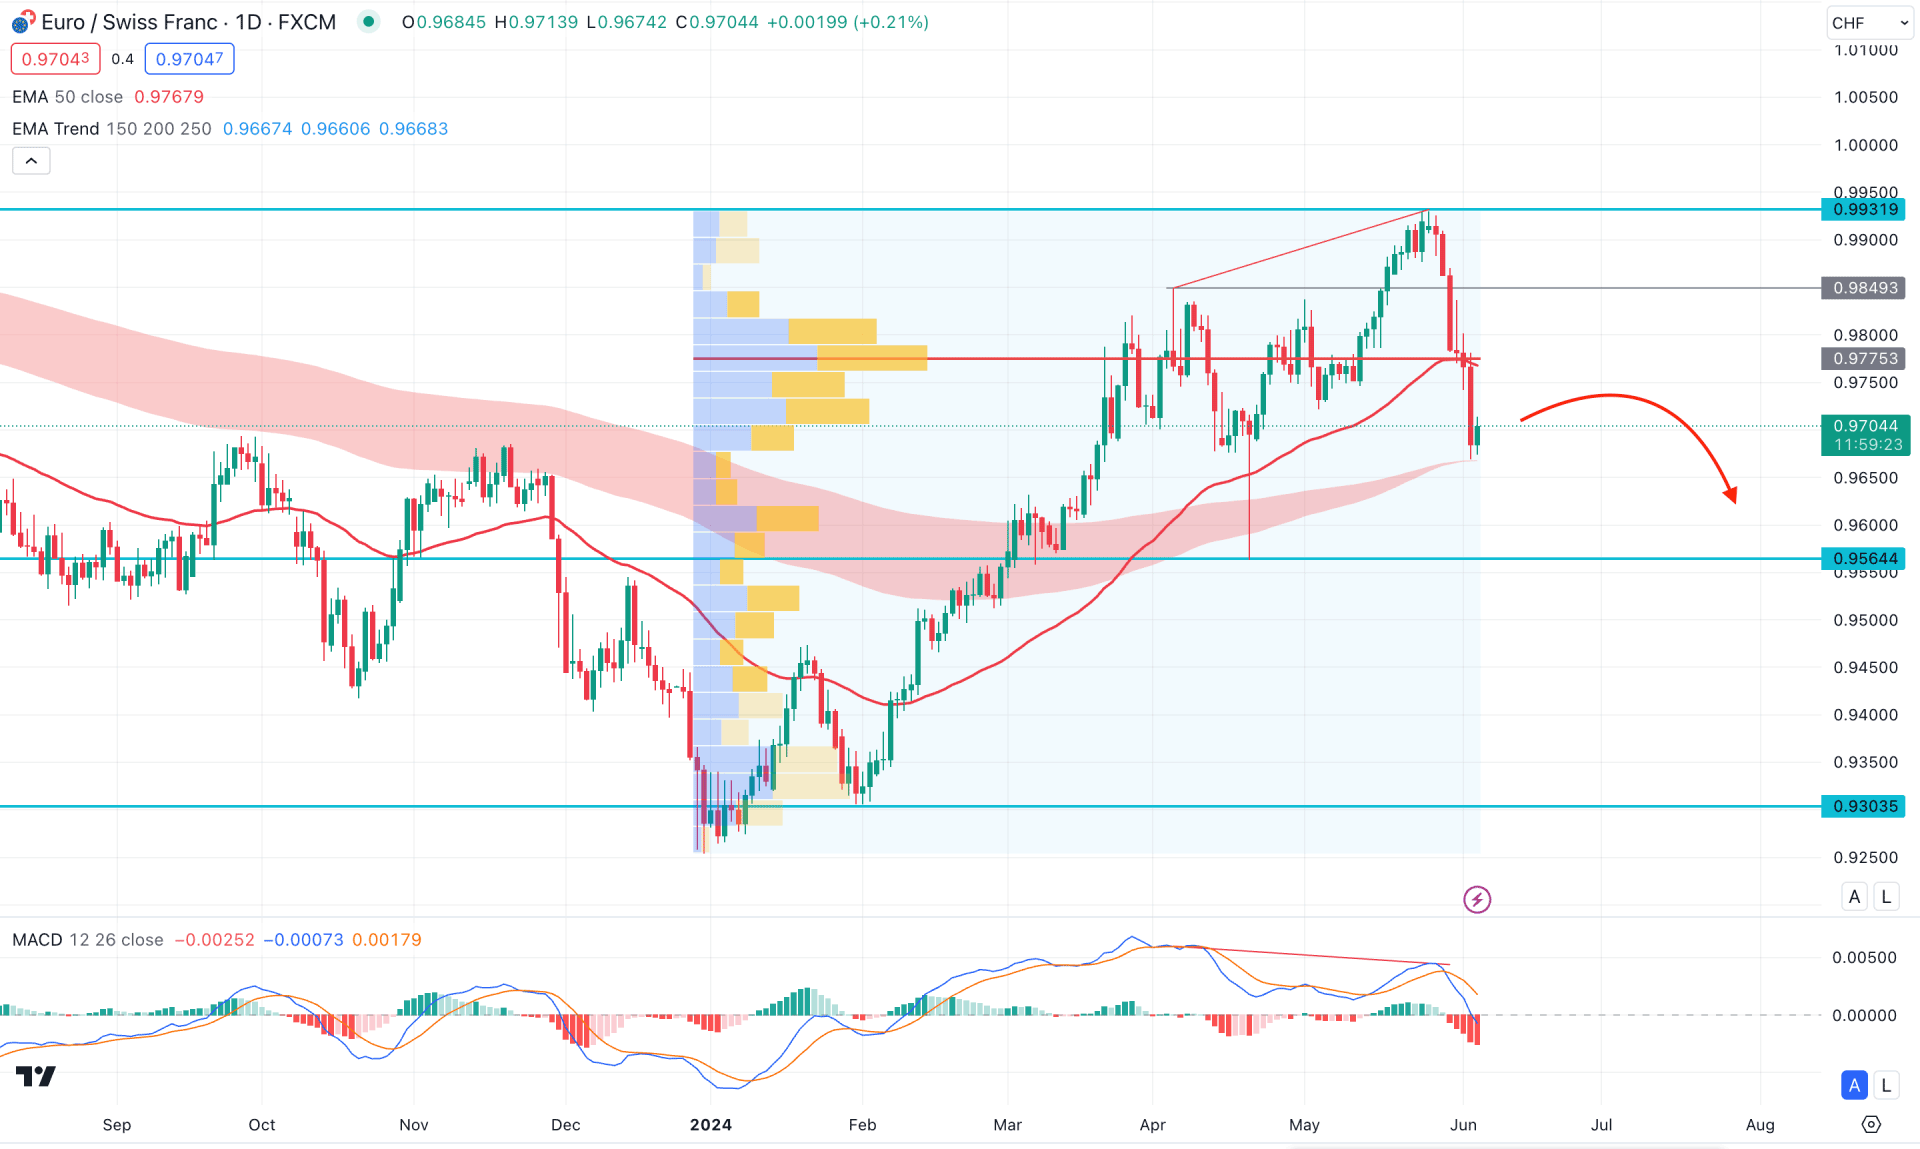
In the daily chart, the EURCHF trades bearish after forming a top at the 0.9931 level, which signals a primary sign of a possible trend reversal.
The May 2024 close suggests a bearish possibility in the higher timeframe, as the monthly candle closed with a doji formation at the top. Later on, a downside continuation came below the candle low, validating the downside possibility. Moreover, the weekly price suggests the same story where the current price trades lower after a bearish engulfing bar formation.
In the volume structure, the most active level since January 2024 is at 0.97753 level. Although the recent price moved above the high volume line, it failed to hold the momentum. As a result, an immediate counter-impulsive pressure with a bearish daily candle below the high volume line, opened a strong bearish opportunity.
In the daily chart, the moving average wave consisting of 150 to 250 MA became narrowed at the current price, suggesting weaker support. However, the current price still trades above the MA area, from where an immediate bullish reversal is possible. Moreover, the MACD divergence is visible, where the current price already provided a bearish reversal from the existing top.
Based on the daily market outlook of EURCHF, the recent bearish pressure has validated a bearish reversal, from which investors can take a short trade from a valid price action. As the most recent price formed a new swing low, any bearish reversal from a minor upward correction could lower the price toward the 0.95644 support level.
On the other hand, an immediate bullish reversal must take the price above the high volume line and form a daily candle. In that case, the buying pressure might extend towards the 1.01000 psychological line.
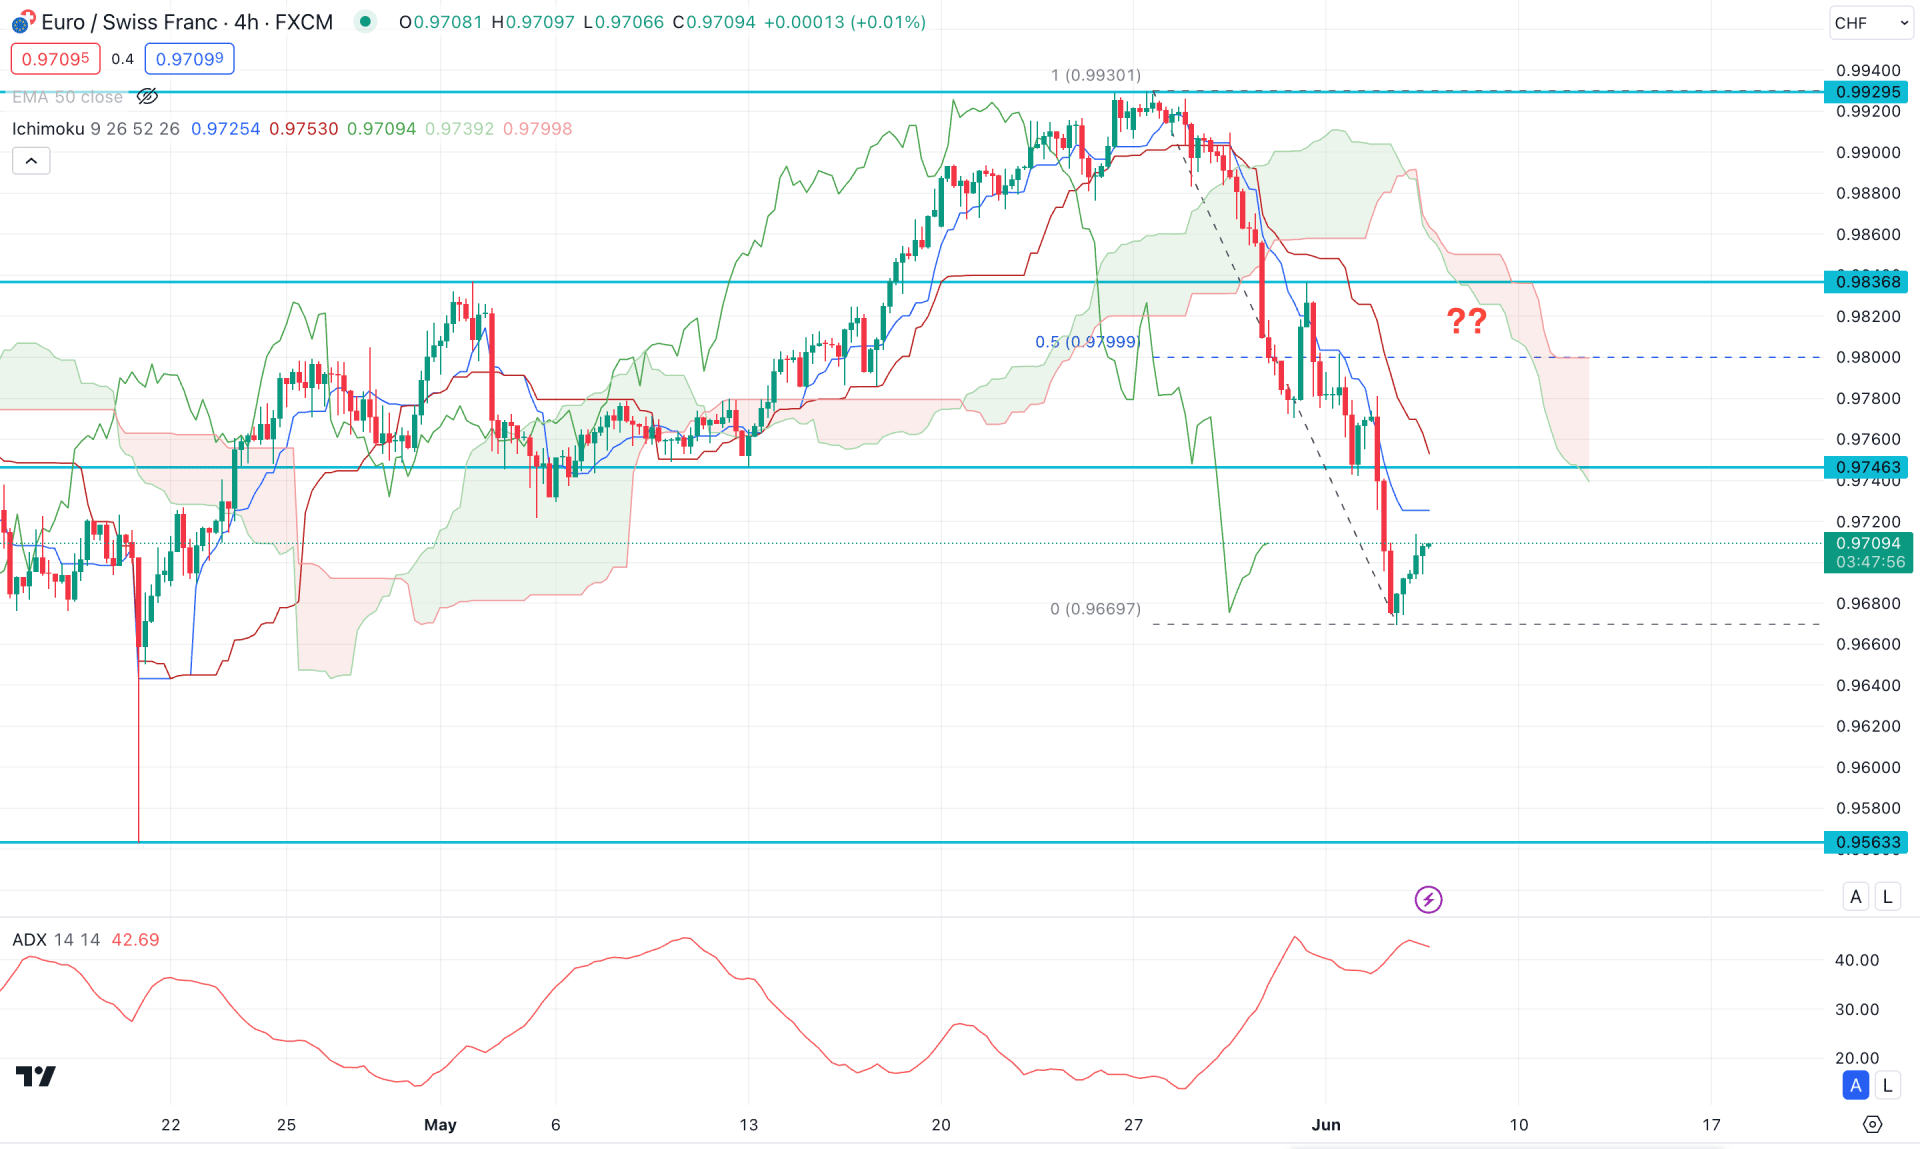
In the H4 timeframe, the recent price showed a bearish reversal below the Ichimoku Cloud zone, which suggests a potential downside continuation signal. In the future cloud, the Senkou Span A moved below the Senkou Span B, suggesting a confluence bearish factor. Therefore, the downside continuation might extend as long as the Senkou Span A holds the momentum below B.
In the indicator window, the Average Directional Index (ADX) suggests an ongoing bearish impulse, which already reached its peak. However, the downside momentum might extend as long as the ADX line hovers above the 20.00 point.
Based on the H4 structure, the recent price made a new swing low below the 0.97463 level, which is a bearish liquidity zone. In that case, investors should closely monitor how sellers' hold the momentum at this area to find a bearish continuation signal. Primarily, a corrective upward pressure with a valid bearish reversal from the 0.98368 to 0.97800 zone could be a potential bearish opportunity, targeting the 0.95633 support level.
The alternative trading approach is to find an immediate bullish reversal with an H4 close above the 0.98600 level before anticipating a long signal.
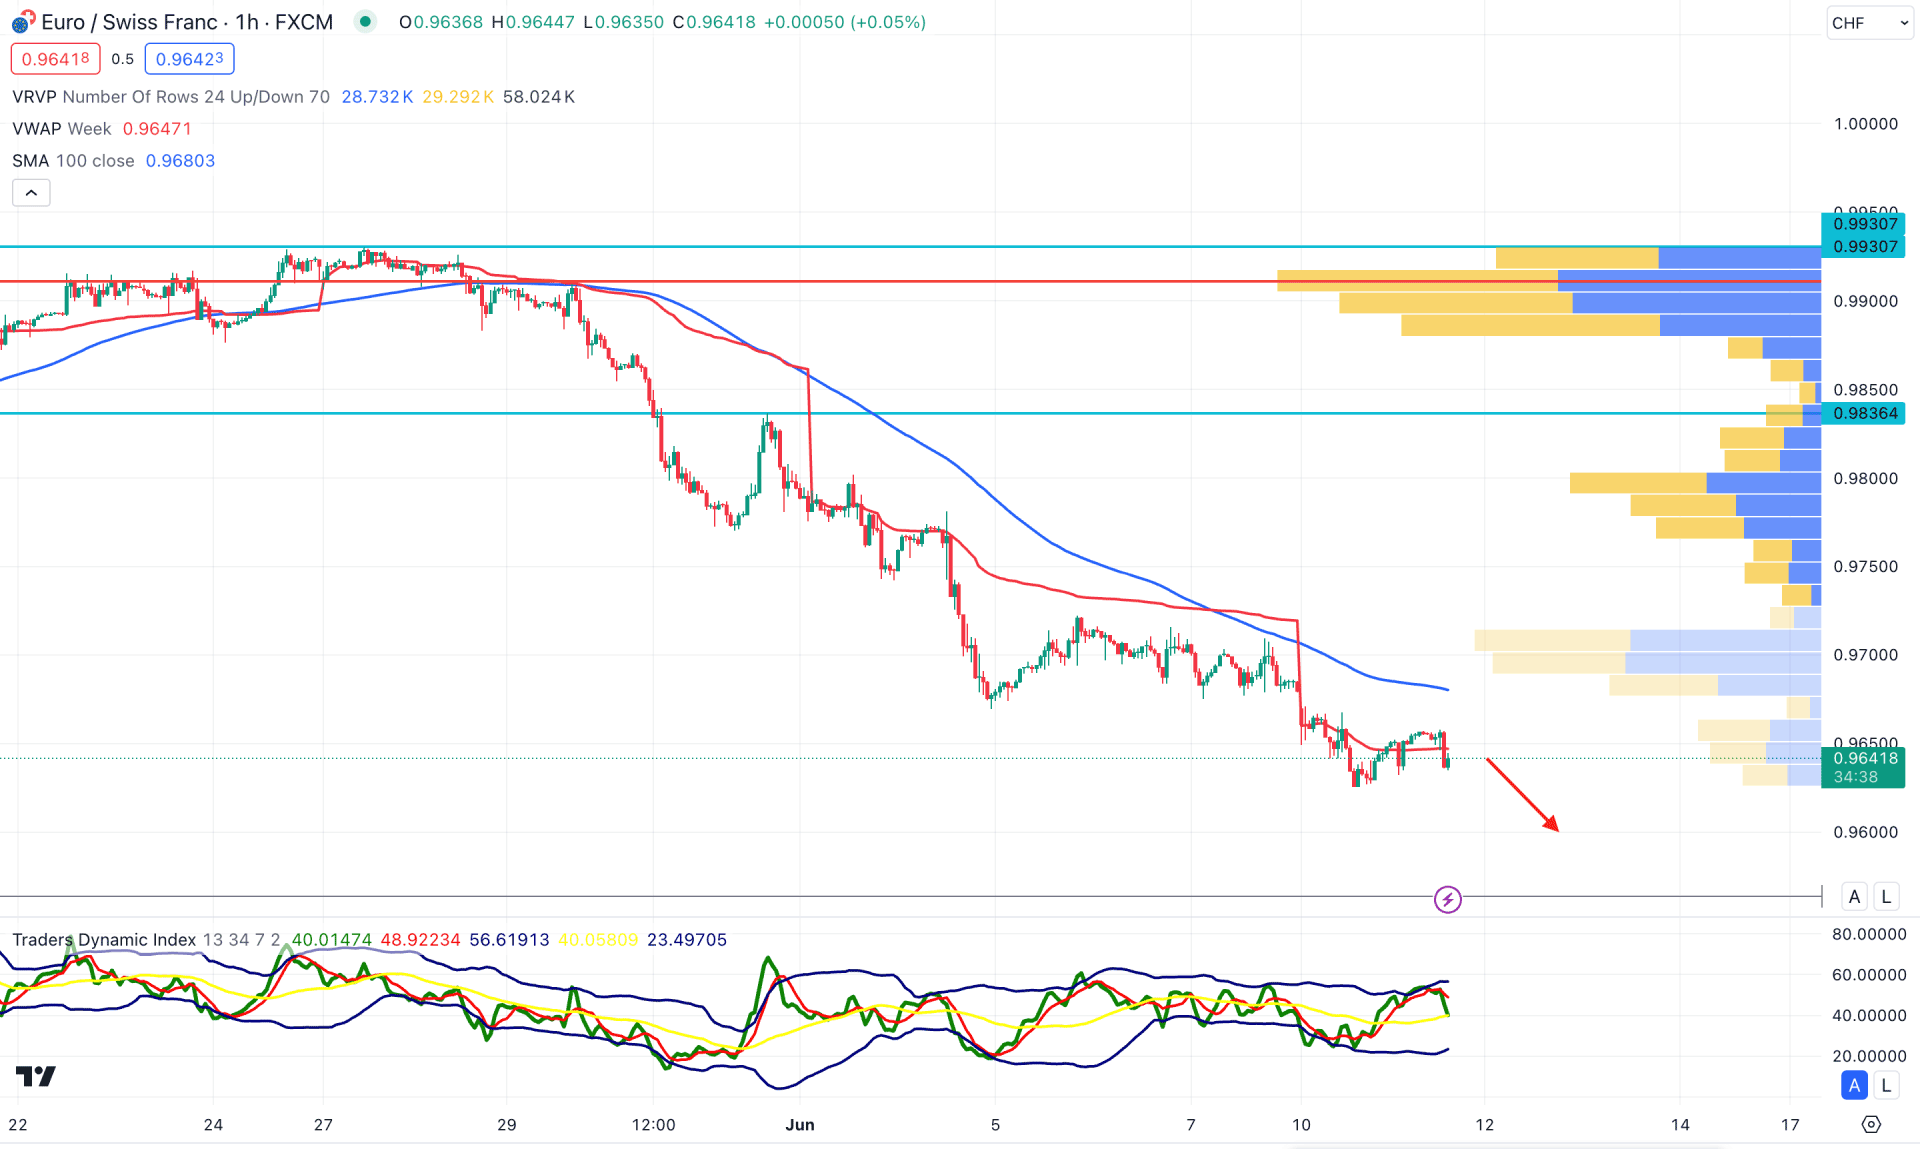
In the hourly chart, an extensive downside pressure is visible, where the recent price moved below the 0.97694 high volume level. Therefore, as long as the current price hovers below the high volume line, we may expect the downside momentum to extend.
In the Traders Dynamic Index (TDI), the recent reading showed an upward pressure as it moved above the 50.00 neutral points. It is a sign of an upward continuation until the TDI reaches the 80.00 overbought TDI level.
Based on the hourly chart, an immediate bullish correction is pending, which might take the price toward the 0.97694 high volume level. However, a valid downside pressure from the 0.97600 to 0.98000 area could be a potential bearish opportunity, targeting the 0.95800 level.
Based on the current market structure, the EURCHF has a higher possibility of extending the downside pressure after having a valid bearish reversal in the intraday chart. However, an immediate bullish reversal with a valid price action in the daily chart could eliminate the bearish opportunity.


