
Published: September 17th, 2025
The Dogecoin ETF was authorised under the 1940 Act. REX-Osprey utilised the regulatory process for crypto-based goods to reduce the time authorities take to provide approvals.
On the other hand, CleanCore Solutions (ZONE), a cleaning service technology company and the "official" Dogecoin finances, has acquired a further 100 million DOGE +0.25%, or roughly $26.6 million, increasing its total holdings to over 600 million.
The NYSE American-listed business announced on Tuesday that it is on course to get to 1 billion DOGE in 30 days, after launching a $175 million Dogecoin reserve earlier this month. CleanCore wants to purchase up to five per cent of Dogecoin in the long run.
Let's see the upcoming price direction from the DOGE/USDT technical analysis:
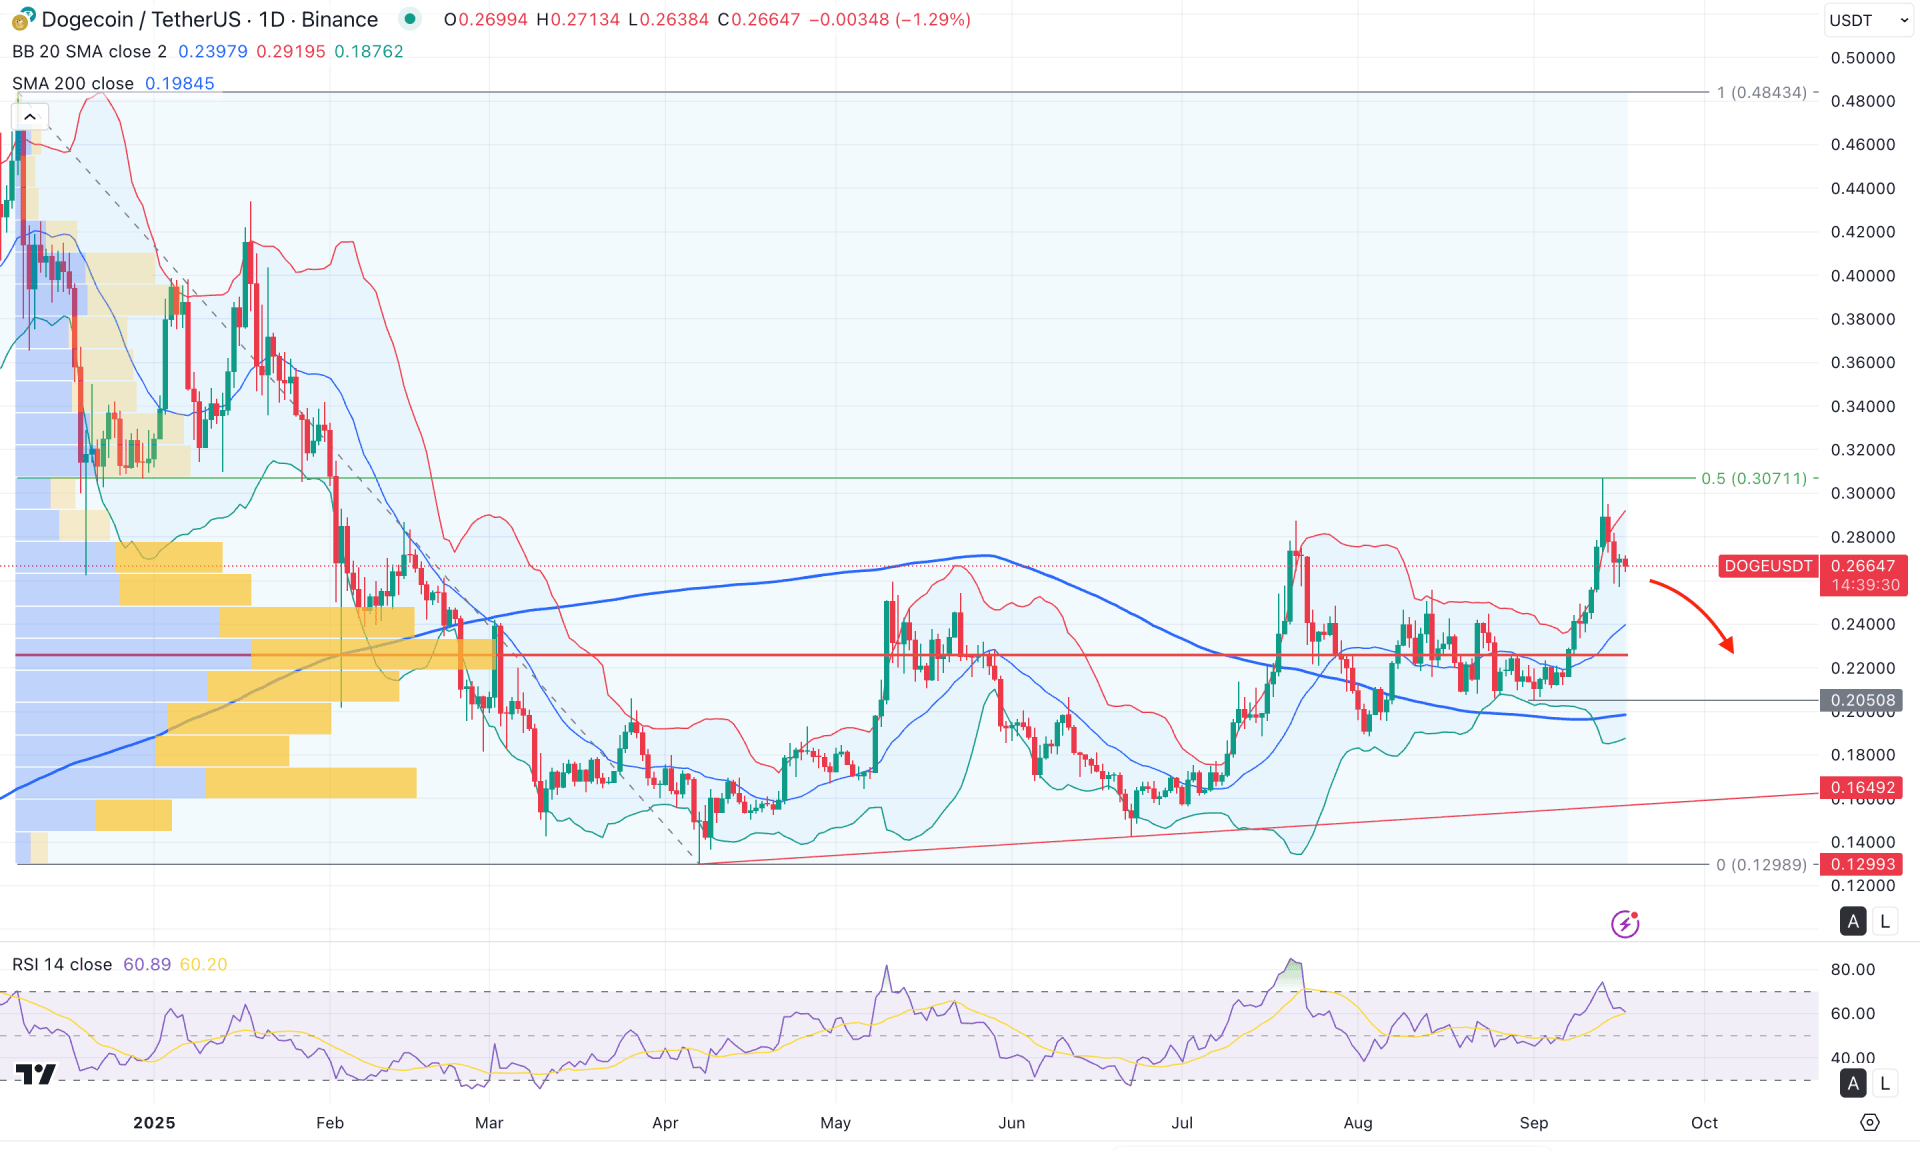
In the daily chart of DOGE/USDT, the overall market momentum is bearish, with the most recent price trading sideways at a discounted zone. Since no valid rebound has been seen after a massive rally, investors might expect a bearish correction before a potential continuation.
On the higher timeframe, the price is supported by a rising trendline from the monthly chart, while a bullish shift has emerged from the 0.1289 area. As the most recent price is trading above the August 2025 high, a valid monthly close could resume buying pressure toward the 2024 high.
According to the volume structure, the largest activity level since December 2024 is at 0.2230, which lies within the consolidation zone and below the current price. Primarily, the price is trading above the high-volume line, suggesting a breakout from a symmetrical triangle, which signals institutional buying activity in the market.
In the main price chart, the most recent price has overextended the buying pressure above the Bollinger Bands level and found resistance at the 50% Fibonacci retracement level of the December 2024 to April 2025 swing. This indicates possible profit-taking from the premium zone, although the broader market momentum remains bullish.
Meanwhile, the 200-day SMA shows a bullish slope, followed by a rally-base-rally formation that validates potential bullish momentum. However, the wide gap between the current price and the 200-day SMA signals a possible correction.
In the secondary indicator window, a divergence has formed as the RSI failed to surpass the July 2025 high despite the ongoing price uptrend. However, the current RSI line is still hovering above the 50.00 neutral level, signalling active buying pressure.
Based on the overall outlook, immediate support is located at 0.2400, which aligns with the mid-Bollinger Bands level. Since the price is facing selling pressure from the overextended zone, there is a higher possibility of a bearish correction to test the mid-Bollinger and support level. However, a break below 0.2400 would also expose the 200-day SMA.
The alternative trading approach is to look for a bullish rejection from the 0.2400 to 0.2050 price zone. In that case, a fundamental push from ETF listing news could drive the price above the mid-Bollinger Bands level, offering a trend reversal opportunity targeting the 0.4000 level.
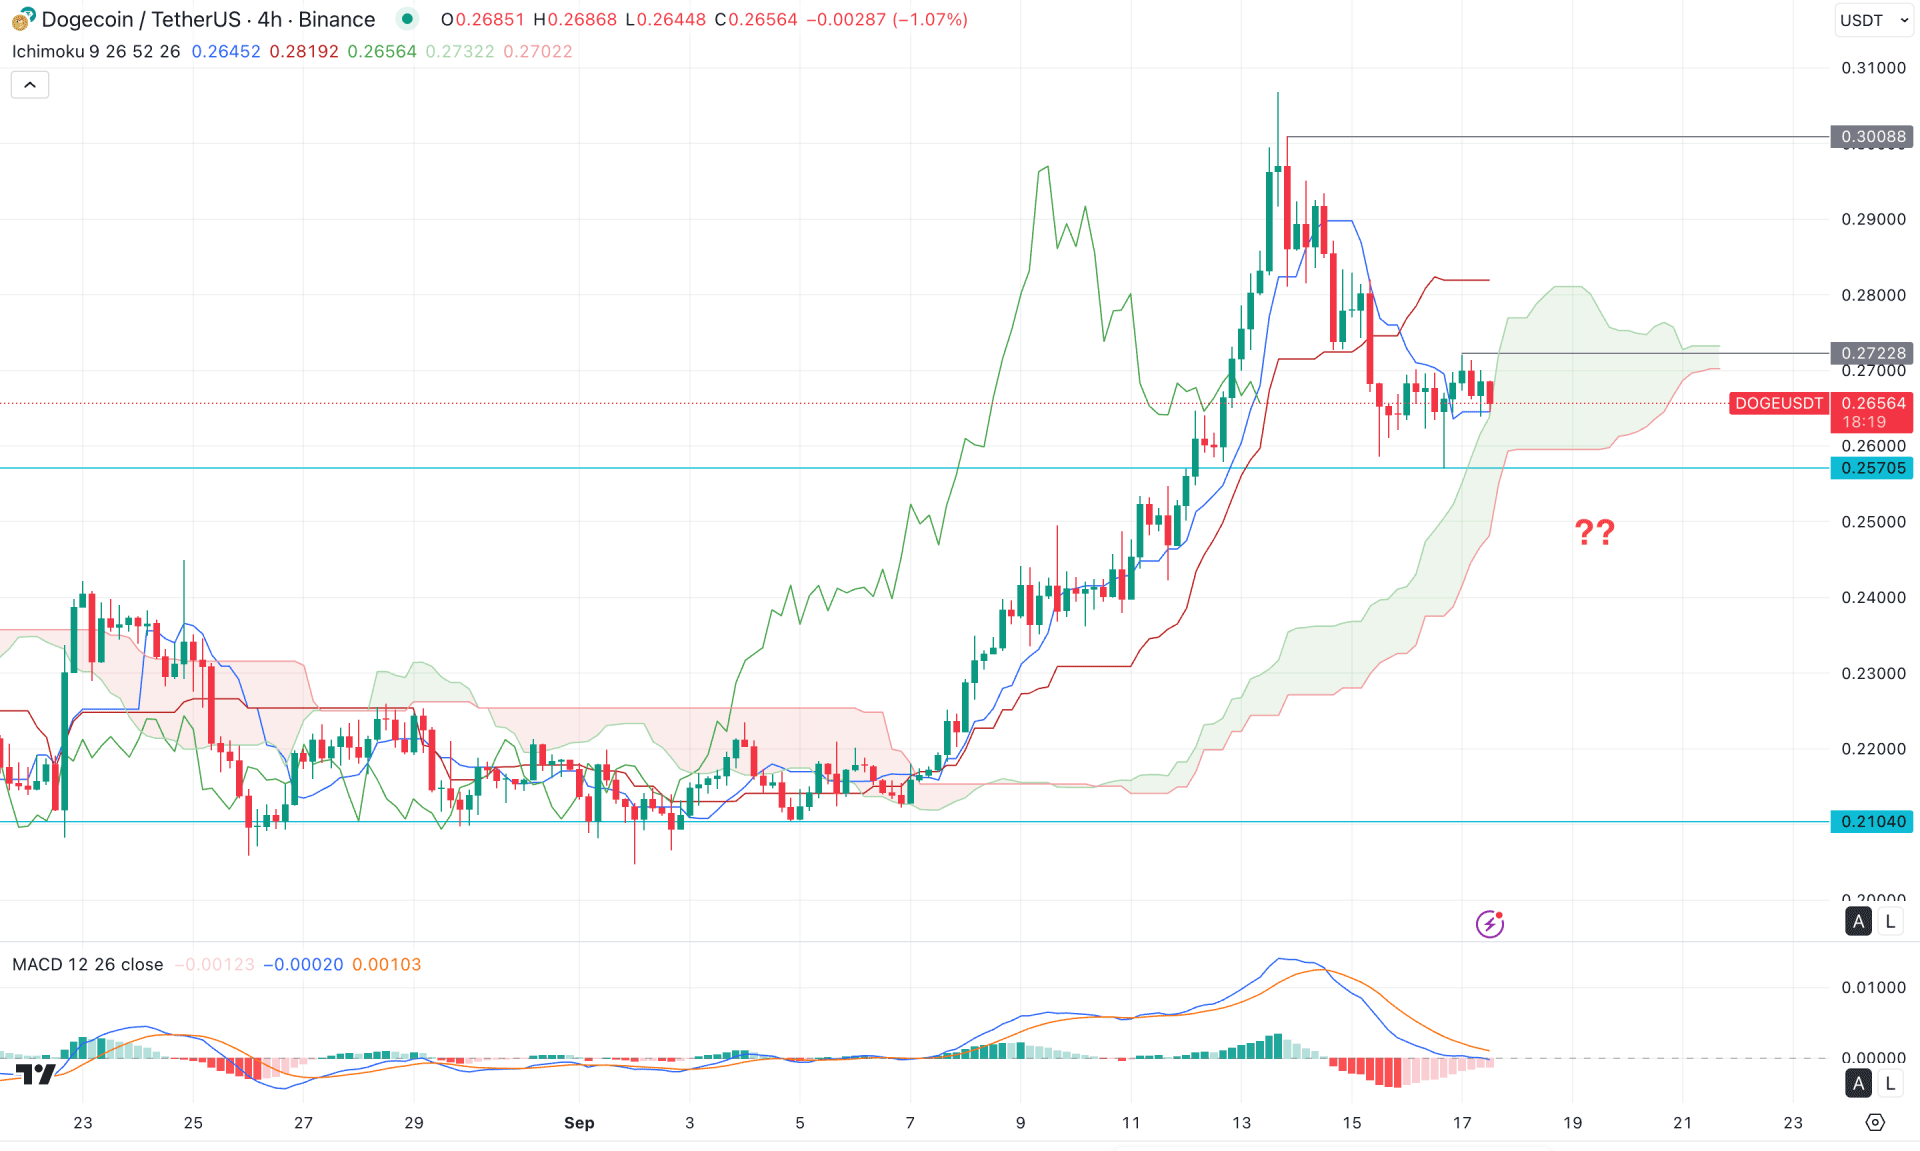
In the H4 timeframe, an extended bullish momentum is visible as the most recent price is hovering above the Ichimoku Cloud zone. Moreover, the Future could still be bullish, where the Senkou Span A is above the Senkou Span B.
On the other hand, the recent price has formed a bearish recovery below the dynamic Kijun Sen level. Following the minor bearish corrective pressure, the price reached the Ichimoku Cloud area, while the MACD Histogram remains sideways at the neutral area.
Based on this outlook, investors should monitor how the price trades in the Cloud area. The primary anticipation is to form a bearish H4 candle below the 0.2570 level from where a bearish sell-side liquidity sweep can be formed. In that case, a bullish recovery with an H4 close above the Kijun Sen level might offer a long opportunity. However, a consolidation below the 0.2500 level could be a potential short opportunity, where the main aim would be to test the 0.2104 support level.
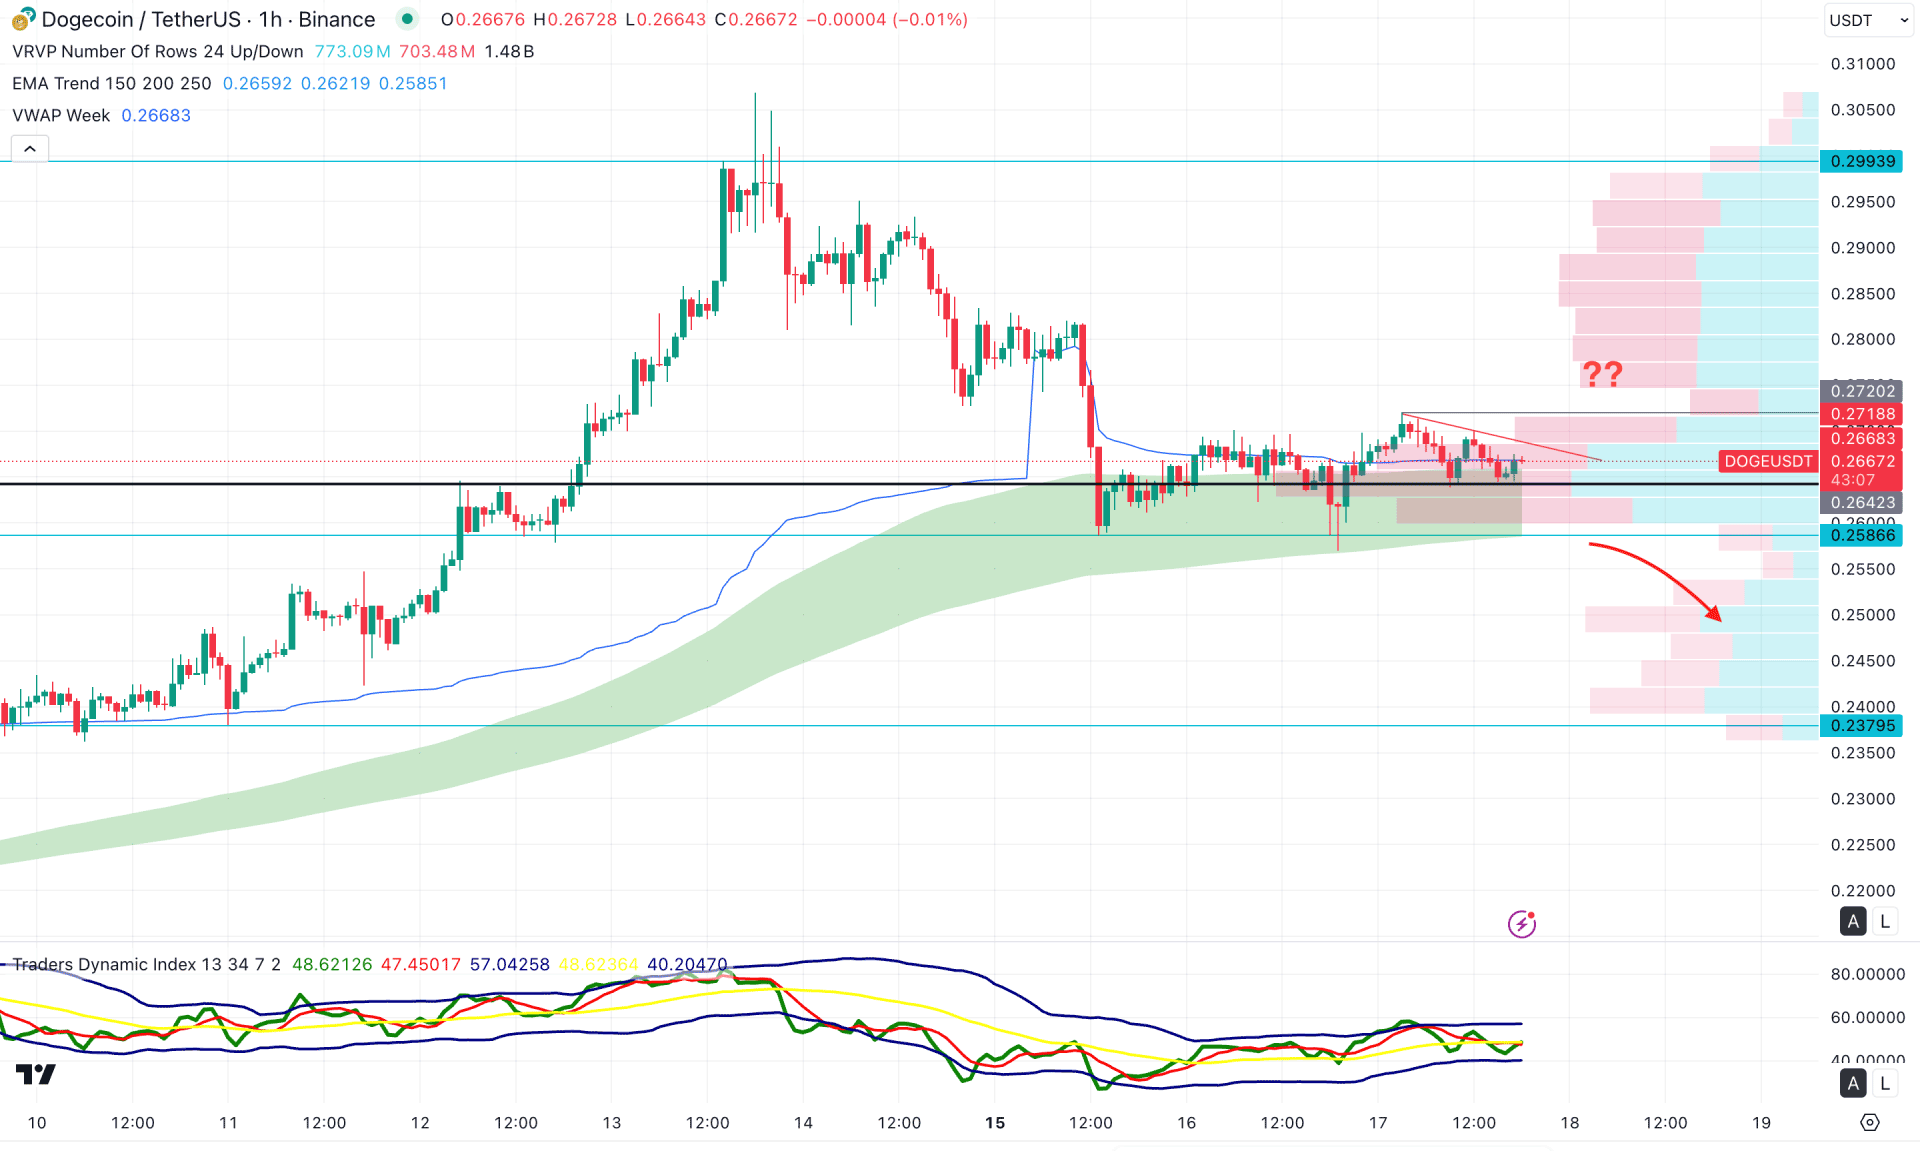
In the hourly timeframe, the recent price is trading sideways above the intraday high volume line, supported by the weekly VWAP level.
Moreover, the Exponential Moving Average wave is acting as an immediate support as the recent price is hovering above it with a valid bullish reversal.
On the other hand, the Traders Dynamic Index (TDI) rebounded from the lower band area, which signals a possible bottom formation.
Based on this outlook, a bullish trendline breakout with a consolidation above the 0.2720 resistance level could be a potential long opportunity, aiming for the 0.2993 level.
However, the corrective momentum might extend if the price fails to hold the buying pressure above the 0.2642 high-volume level. In that case, a bearish momentum might find support from the 0.2400 area before offering another long opportunity.
Based on the overall market momentum, DOGE/USDT is more likely to offer a long opportunity once the bottom is confirmed. As the recent price is trading sideways, an additional bearish intraday pressure is pending.


