
Published: January 10th, 2023
As COVID restrictions stayed in place, China's official PMI data showed that the economy continued to fall in December. In November, manufacturing came in at 47 instead of 48, and services dropped from 46.7 to 41.6 since the previous month.
This information should have been put at the bottom since China is removing more and more restrictions and moving toward full reopening. From January 8, there will no longer be COVID testing for travelers coming into the country, which will help the service sector grow.
The Caixin manufacturing PMI dropped to 49 from 49.4 the month before because small and medium-sized businesses are having a hard time dealing with COVID restrictions. However, business confidence rose to a 10-month high, which was a good sign.
In Canada, employment in December was much better than expected. The employment change was 104K instead of the expected 80K! The unemployment rate went up to 5.2%, but the number of people working went up from 64.8% to 65% in November.
Also, working full-time printed 84.5k, while working part-time printed 19.5k. The BOC is now dealing with a very hot job market, and with wages going up by 5.2% year over year, they will have to take a more "hawkish" stance and keep raising rates.
Overall the bullish extension in the AUDCAD price could grab some sellers' attention in the market.
Let’s see the future outlook from the AUDCAD technical analysis:
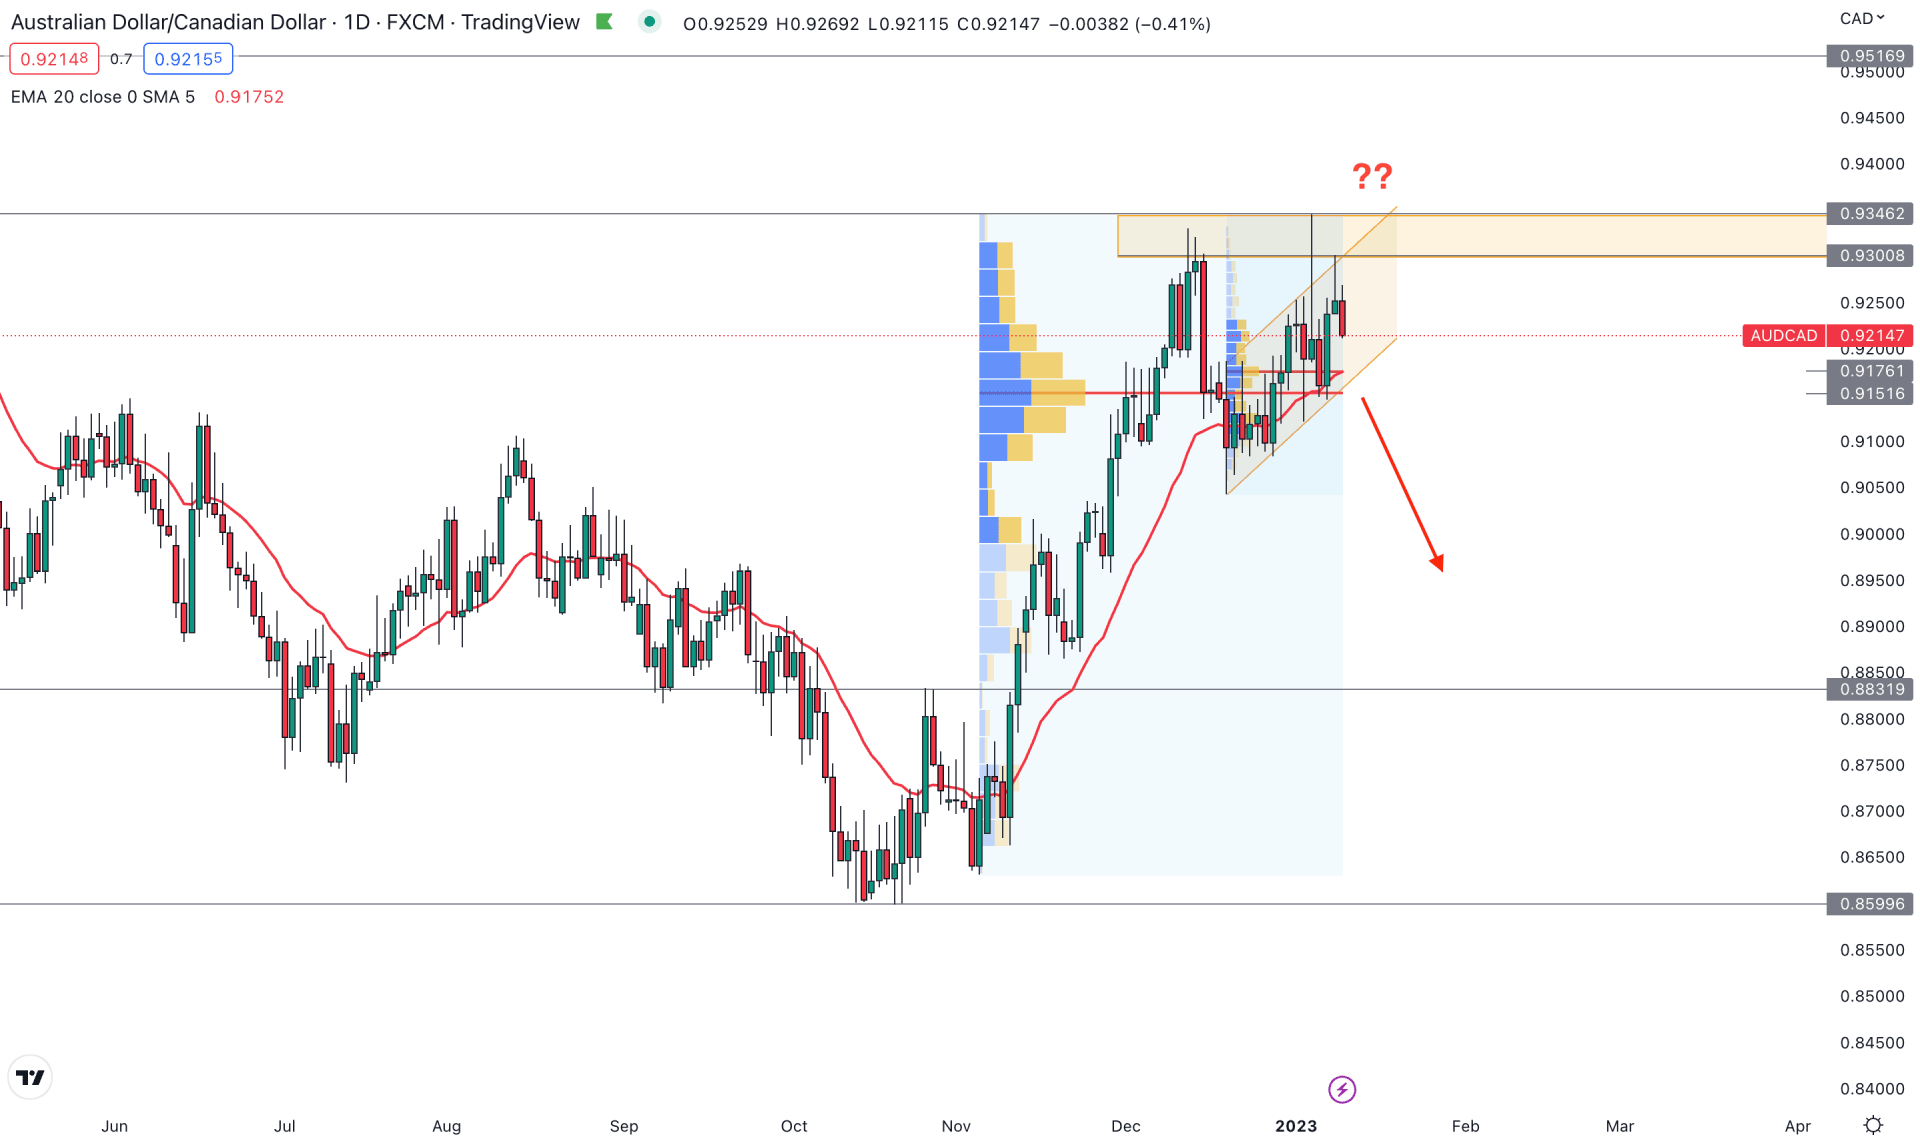
In the daily price of AUDCAD, the broader bullish outlook is tricky as the price made a new high in January 2022. However, the bulls failed to hold the momentum and showed an immediate rebound.
The current price is trading higher within an ascending channel where the 0.9346 level is the ultimate top of the structure. The selling pressure started from the buy side liquidity grab from the 13 December 2022 high, which increased the possibility of a bearish range extension.
If we look at the market structure, the top of the tradable range is spotted at 0.9346 and bottom is at 0.8631. As the current price is trading at the premium zone of this range, any bearish possibility with support from volume could offer a highly probable trading opportunity.
If we look at the fixed range high volume indicator, the highest trading volume level from November low to the January high is marked at 0.9151 level. Moreover, another high volume level from the December low to the January high is marked at 0.9176 level. Therefore, the current selling pressure is yet to overcome these areas before showing a sharp sell-off.
Based on the daily outlook, investors should closely monitor the daily channel support. A bearish break below the channel support with a strong daily candle could offer a short opportunity, targeting the 0.8831 level.
The bearish possibility is valid as long as the price trades below the 0.9300 level. A bullish recovery and a daily candle close above the 0.9350 level could invalidate the bearish possibility.
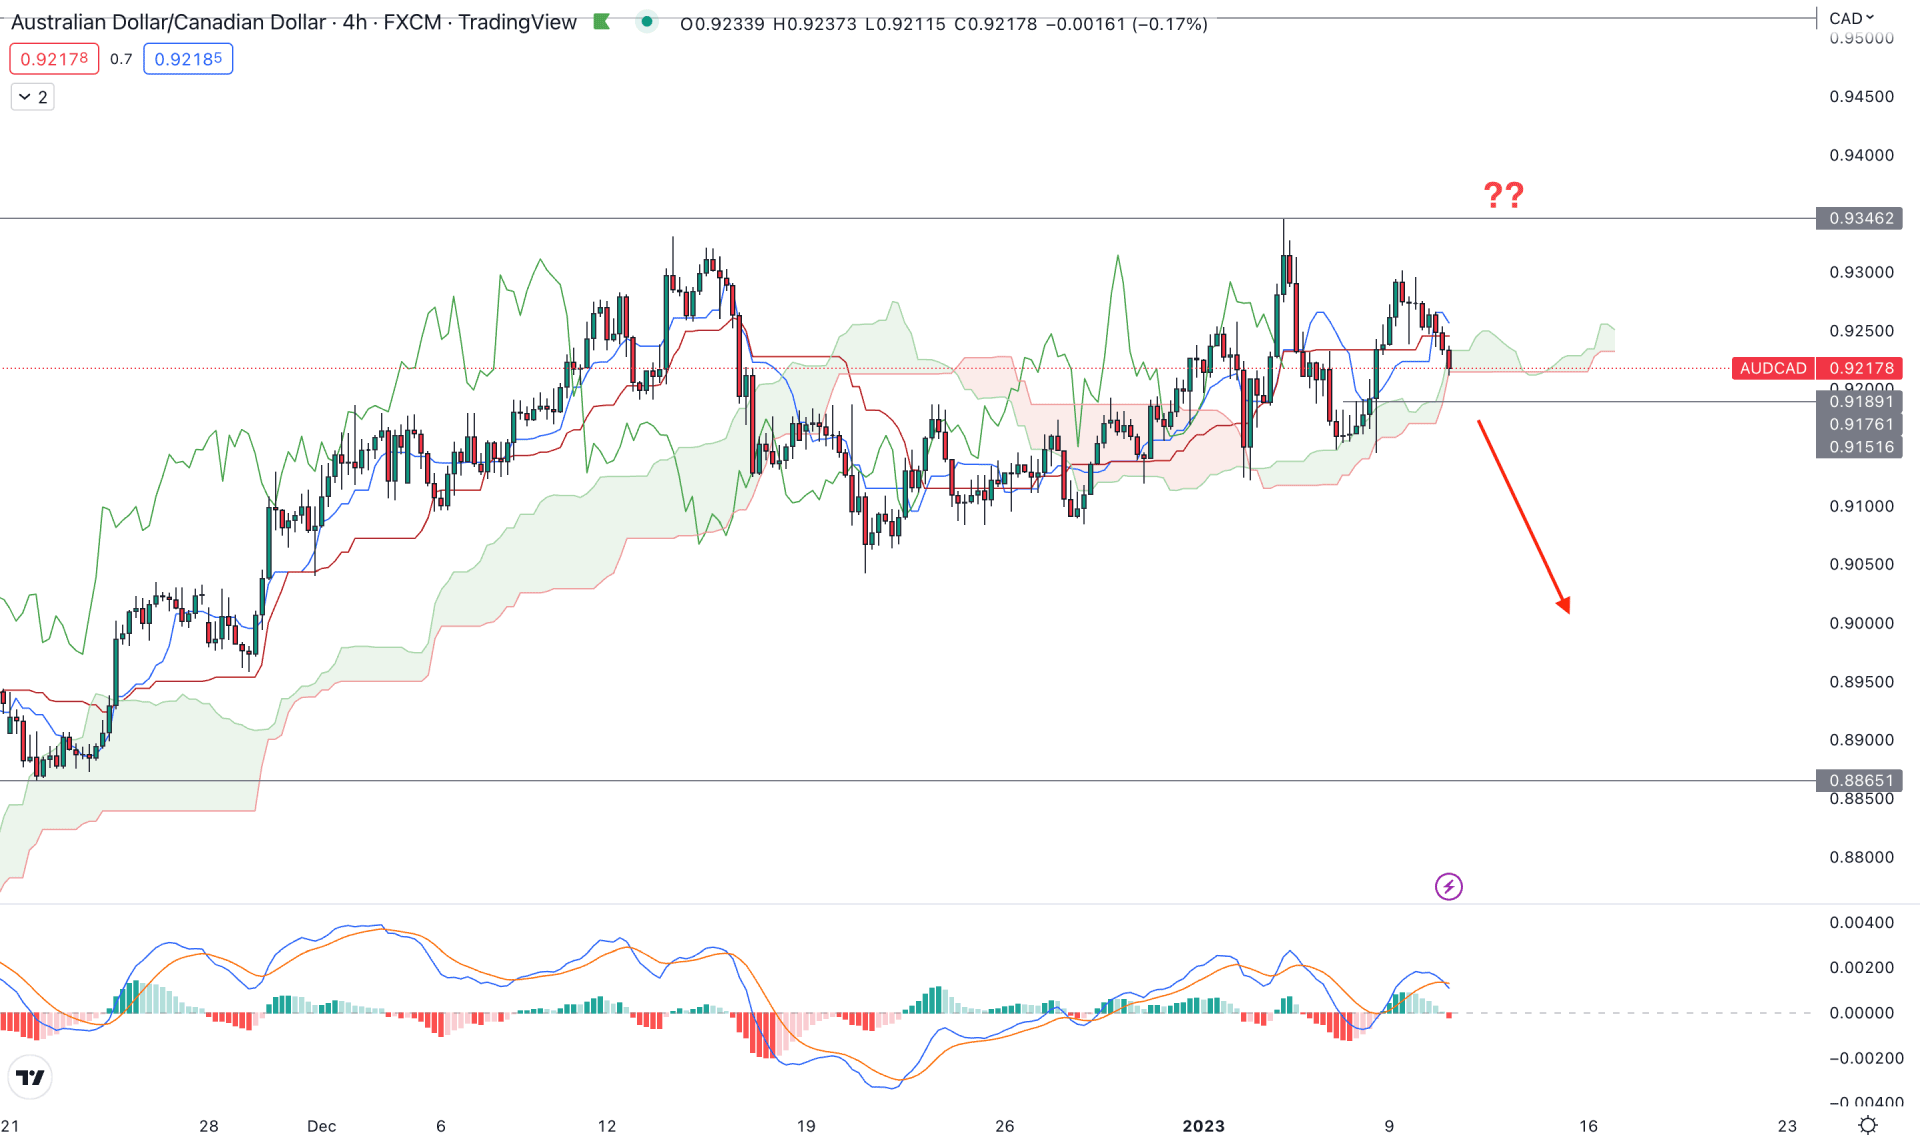
In the H4 timeframe, the bearish possibility is potent as there is a bearish crossover among dynamic Tenkan Sen and Kijun Sen. Although the future cloud is still bullish in this structure, the buying momentum is questioned from the immediate recovery after reaching the 0.9346 peaks.
In the indicator window, the MACD Histogram shifted to the bearish direction while MACD EMA’s are ready to move down from the positive zone.
In this price context, the downside momentum will be valid if there is a bearish H4 candle below the 0.9189 support level. In that case, bears may extend the momentum toward the 0.8865 support level.
On the other hand, an immediate bullish recovery with an H4 close above the dynamic Kijun Sen could increase the buying possibility toward the 0.9346 resistance level.
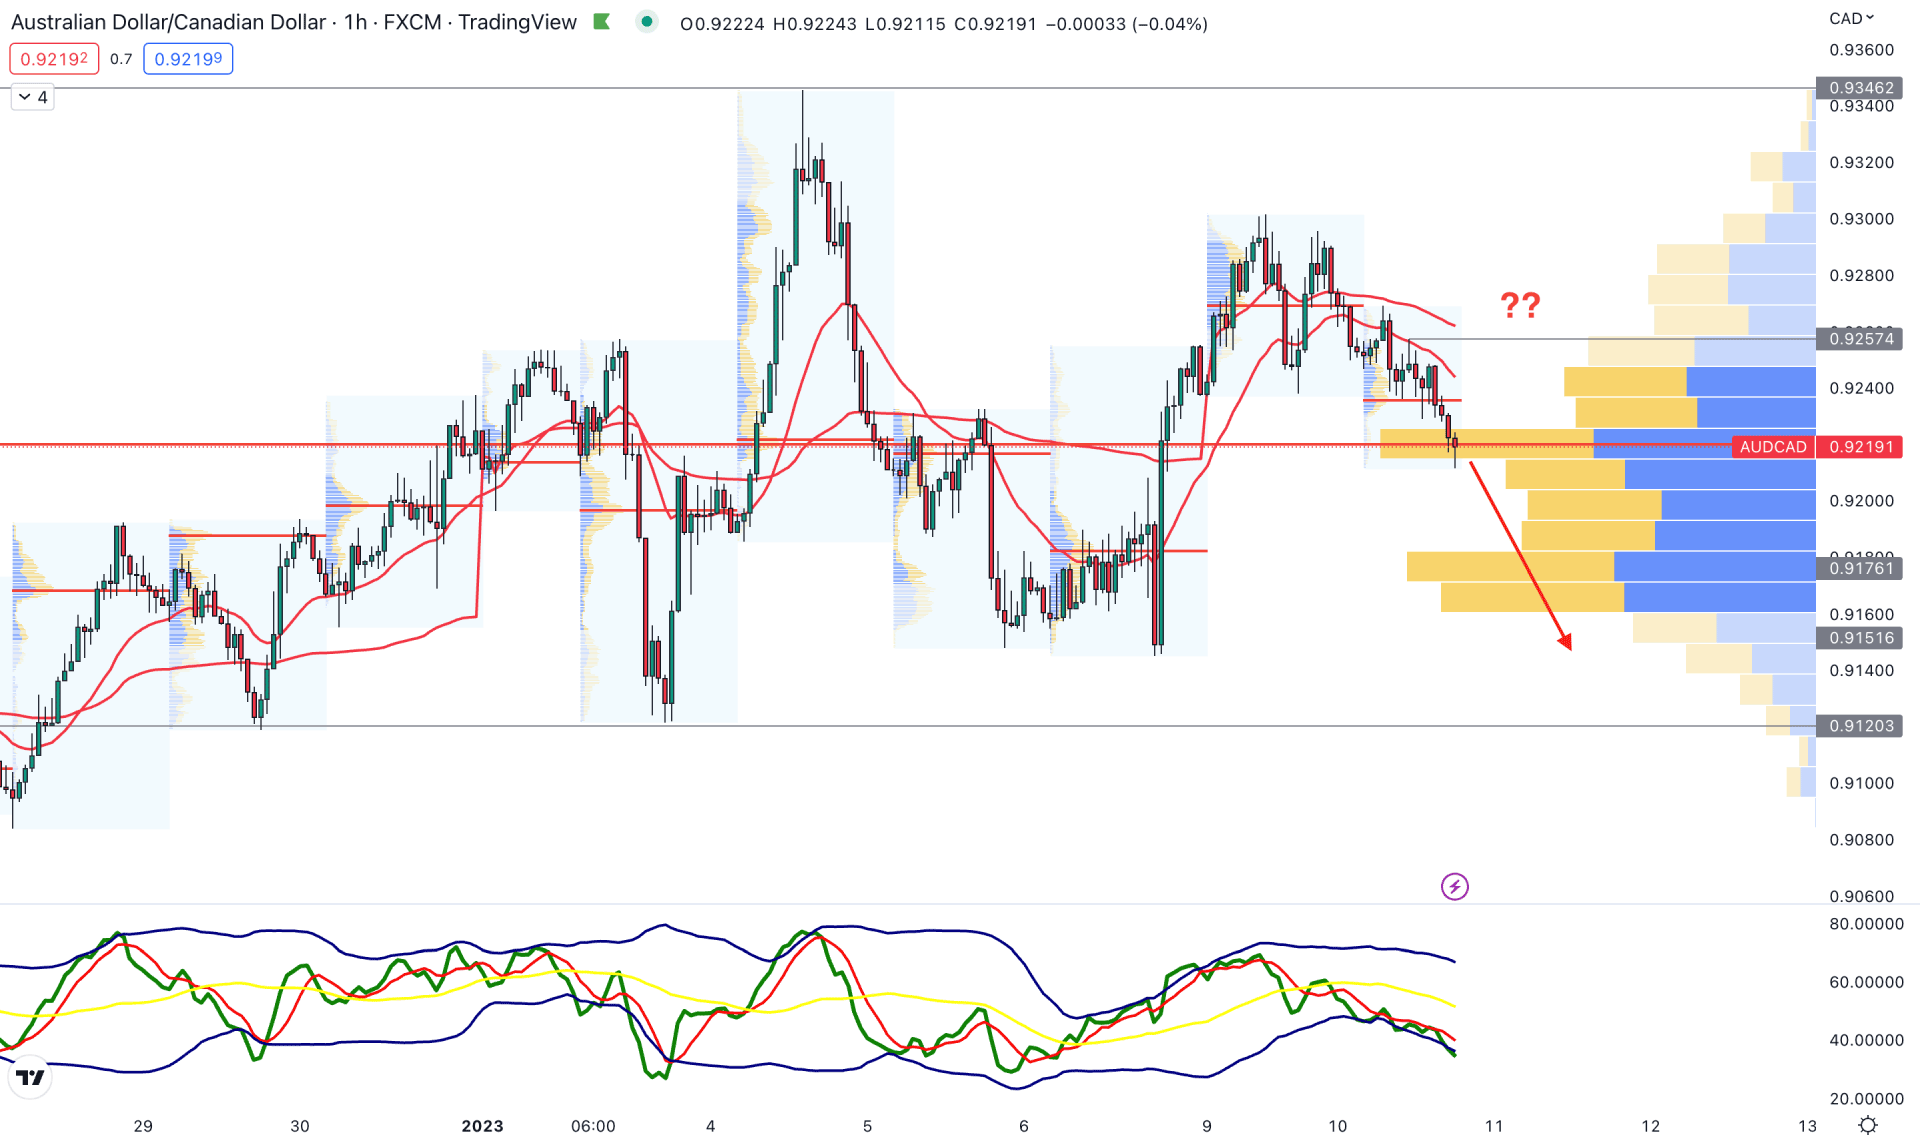
In the AUDCAD H1 chart, the selling pressure reached the visible range high volume level, which is at the 50% area of the current tradable range. In that case, a solid breakout with a stable price below the current 0.9220 high volume level is needed before offering a short opportunity.
The dynamic 20 EMA and weekly VWAP are above the current price and aiming lower, which is a sign of strong selling pressure on the price.
Based on the current price structure, the bearish possibility is potent where the primary aim is to test the 0.9120 support level. However, a bullish recovery with an H1 candle above the 0.9260 level would open a long opportunity, targeting the 0.9360 resistance level.
‘Based on the current outlook, AUDCAD has a higher possibility of showing a bearish momentum in the coming days. Investors should closely monitor the intraday price to find a proper correction before joining the long-term trend.


