
Published: December 12th, 2023
IOTA, the native token of the IOTA ecosystem, surged significantly in recent weeks, subsequent to the declaration that a development foundation had been established in Abu Dhabi. As stated in an IOTA press release, the IOTA Ecosystem DLT Foundation asserts that it was the "first" foundation to be registered in accordance with the DLT Foundations Regulations, which were implemented by Abu Dhabi Global Market (ADGM).
The funding for this nascent organization will consist of IOTA tokens valued at $100 million, which will be reserved for a duration of four years.
IOTA is a decentralized ledger that differentiates itself from conventional blockchains by employing a proprietary technology known as Tangle. This distinctive methodology provides considerably elevated velocities in comparison to traditional blockchains.
In the absence of a conventional blockchain, there are no miners and, as a result, no transaction fees. IOTA, as opposed to alternative networks wherein expenses may increase in response to congestion, strives to deliver unlimited throughput at a minimal cost.
IOTA aspires to establish itself as the preeminent platform for facilitating transactions among Internet of Things (IoT) devices. This is a substantial undertaking, given the estimated 20.4 billion IoT devices that will operate by 2024.
There are 3,038,128,133 IOTA in circulation, which is 66% of the overall supply. Let’s see the upcoming price direction of this token from the IOTA technical analysis:
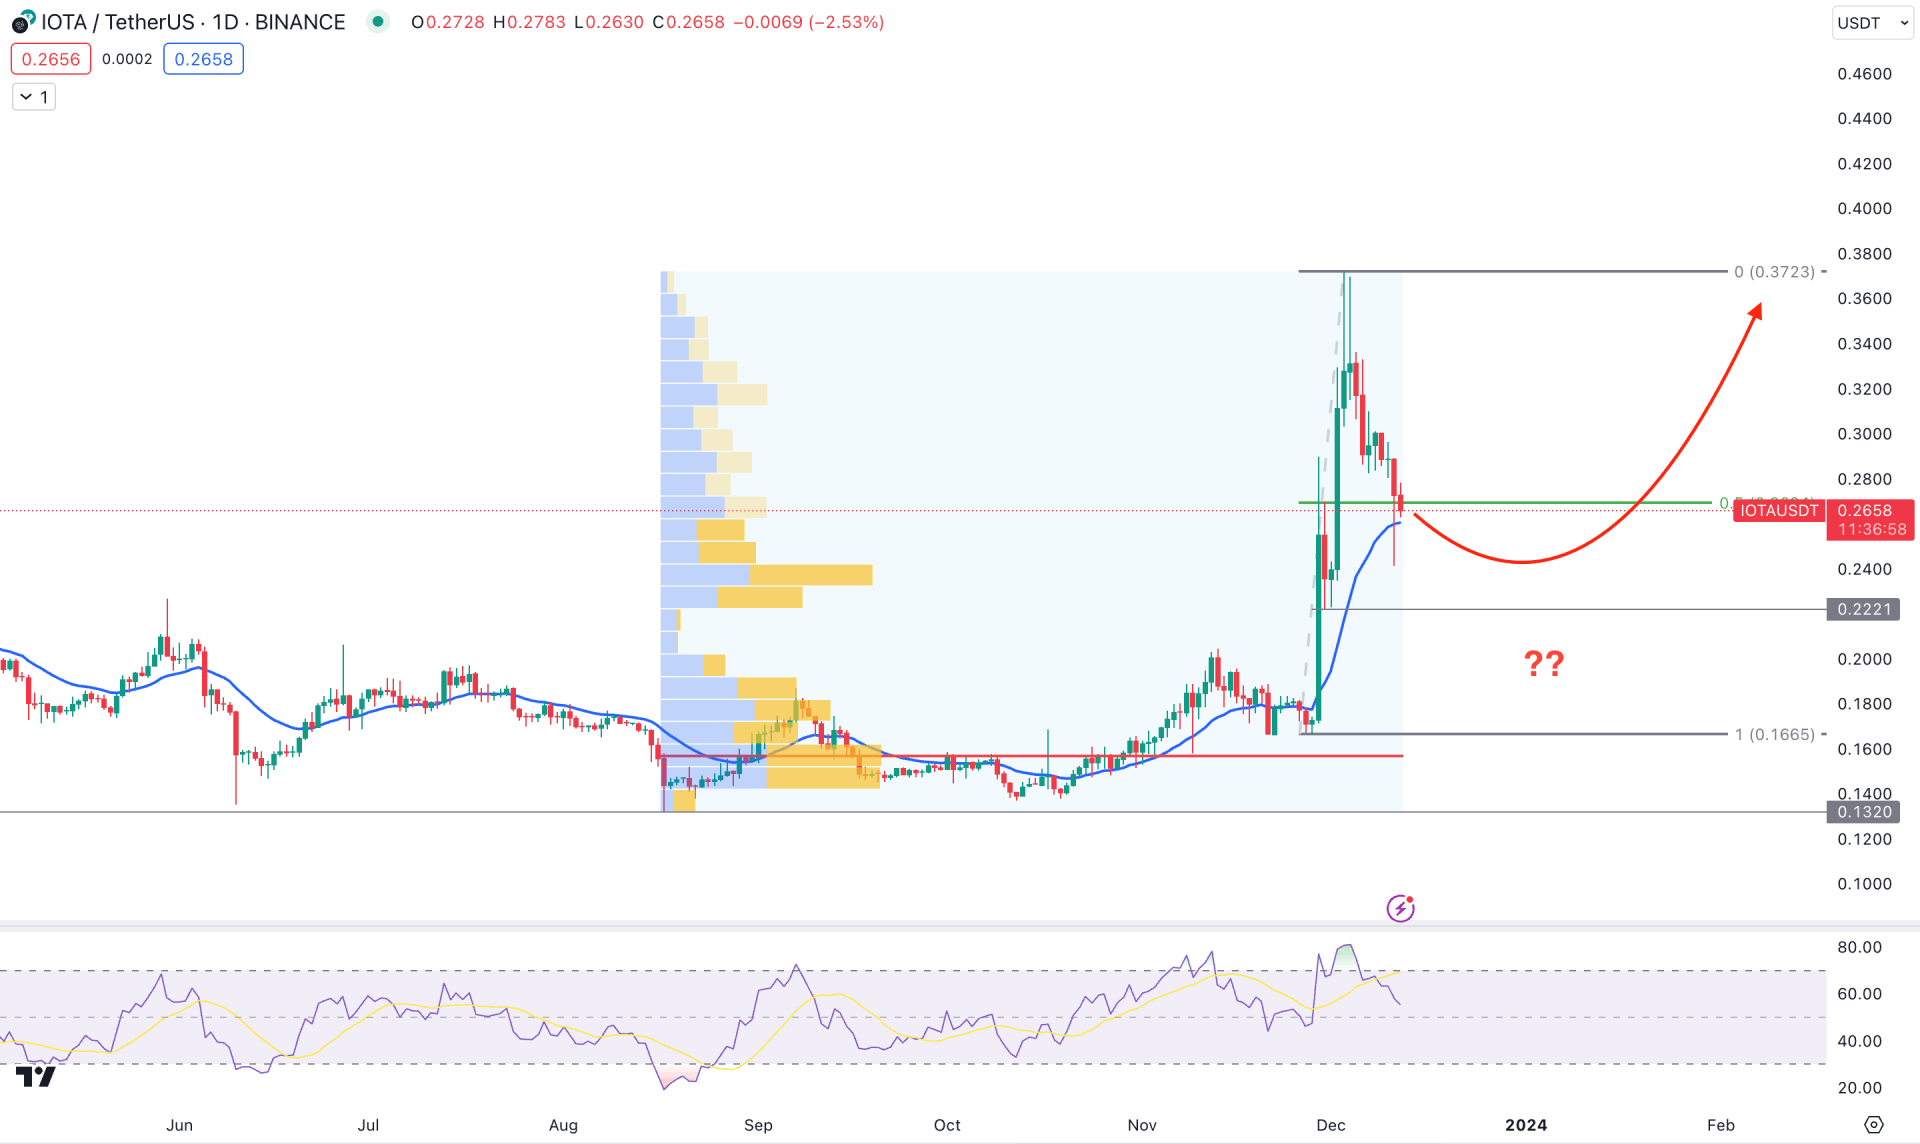
In the IOTA/USDT daily chart, an impulsive bullish leg is present, which has a solid fundamental background. Moreover, the price went sideways and showed a corrective bearish pressure after setting a top at the 0.3727 level. It is a sign that bulls still hold their position and can rebound the price once the profit-taking session is over.
The monthly close in November suggests a bullish range breakout with a new yearly high formation in the higher timeframe price action. Moreover, the continuation in December is the primary indication of a bullish yearly close during the crypto winter. The weekly price also suggests a bullish continuation as the last two week’s selling pressure is still within the earlier week’s impulsive body.
In the volume structure, the most active level since August 2023 is at the 0.1573 level, which is at the consolidation zone. The lack of selling pressure from the 0.3723 peak suggests less selling pressure in the market. In that case, a bullish reversal is potent from the discounted zone instead of anticipating a pump and dump.
In the daily price, the overall market pressure is bullish, where the recent price reached the discounted zone from the 0.1665 low to the 0.3723 high. Considering the ongoing bullish trend, a bullish rebound is possible from the discounted area, but it needs to form a valid bullish rejection from the near-term support level.
Based on this outlook, a bullish rebound from the 50.00 RSI with sellers’ elimination at the dynamic 20-day EMA could be a long opportunity in this pair, targeting the 0.4000 psychological level.
On the other hand, an extended bearish correction and a daily close below the 0.2000 level could open a short opportunity, targeting the 0.1200 zone.
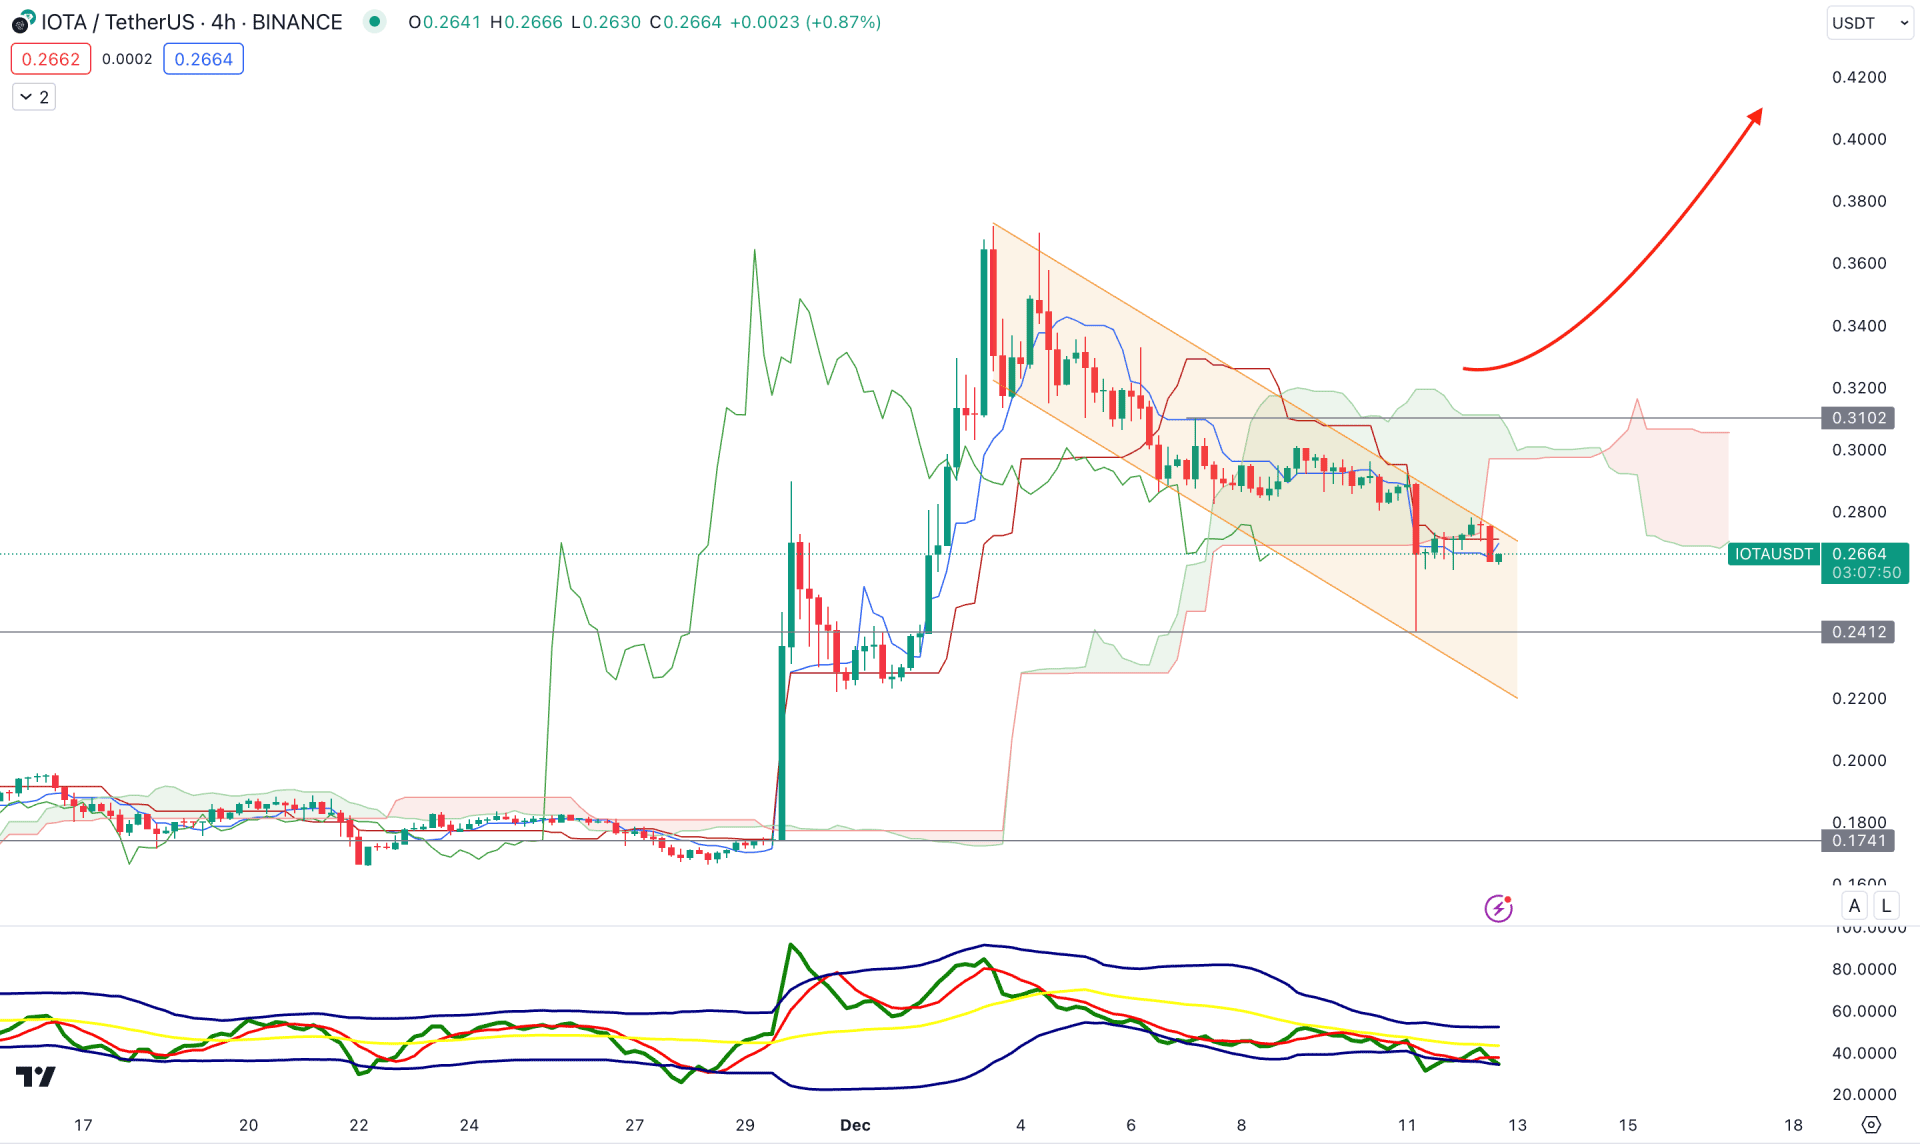
In the H4 timeframe, the current price trades sideways after forming a strong top. Although the most recent price moved below the Ichimoku Kumo Cloud zone with a dynamic Senkou Span A below the Senkou Span B, the bullish possibility is potent.
In the secondary window, the TDI level is at the 40.00 line, which suggests a minor bearish pressure in the market.
The dynamic Kijun Sen is closer to the price with a sideways momentum, which suggests an indecision. Moreover, the ongoing descending channel formation suggests a corrective price action, from where a breakout could result in a stable trend.
Based on this structure, a bullish daily candle above the 0.3100 level could be a long opportunity, where the main aim is to test the 0.4400 level.
On the other hand, the downside momentum needs a stable market below the Kumo Cloud before anticipating the 0.2000 level.
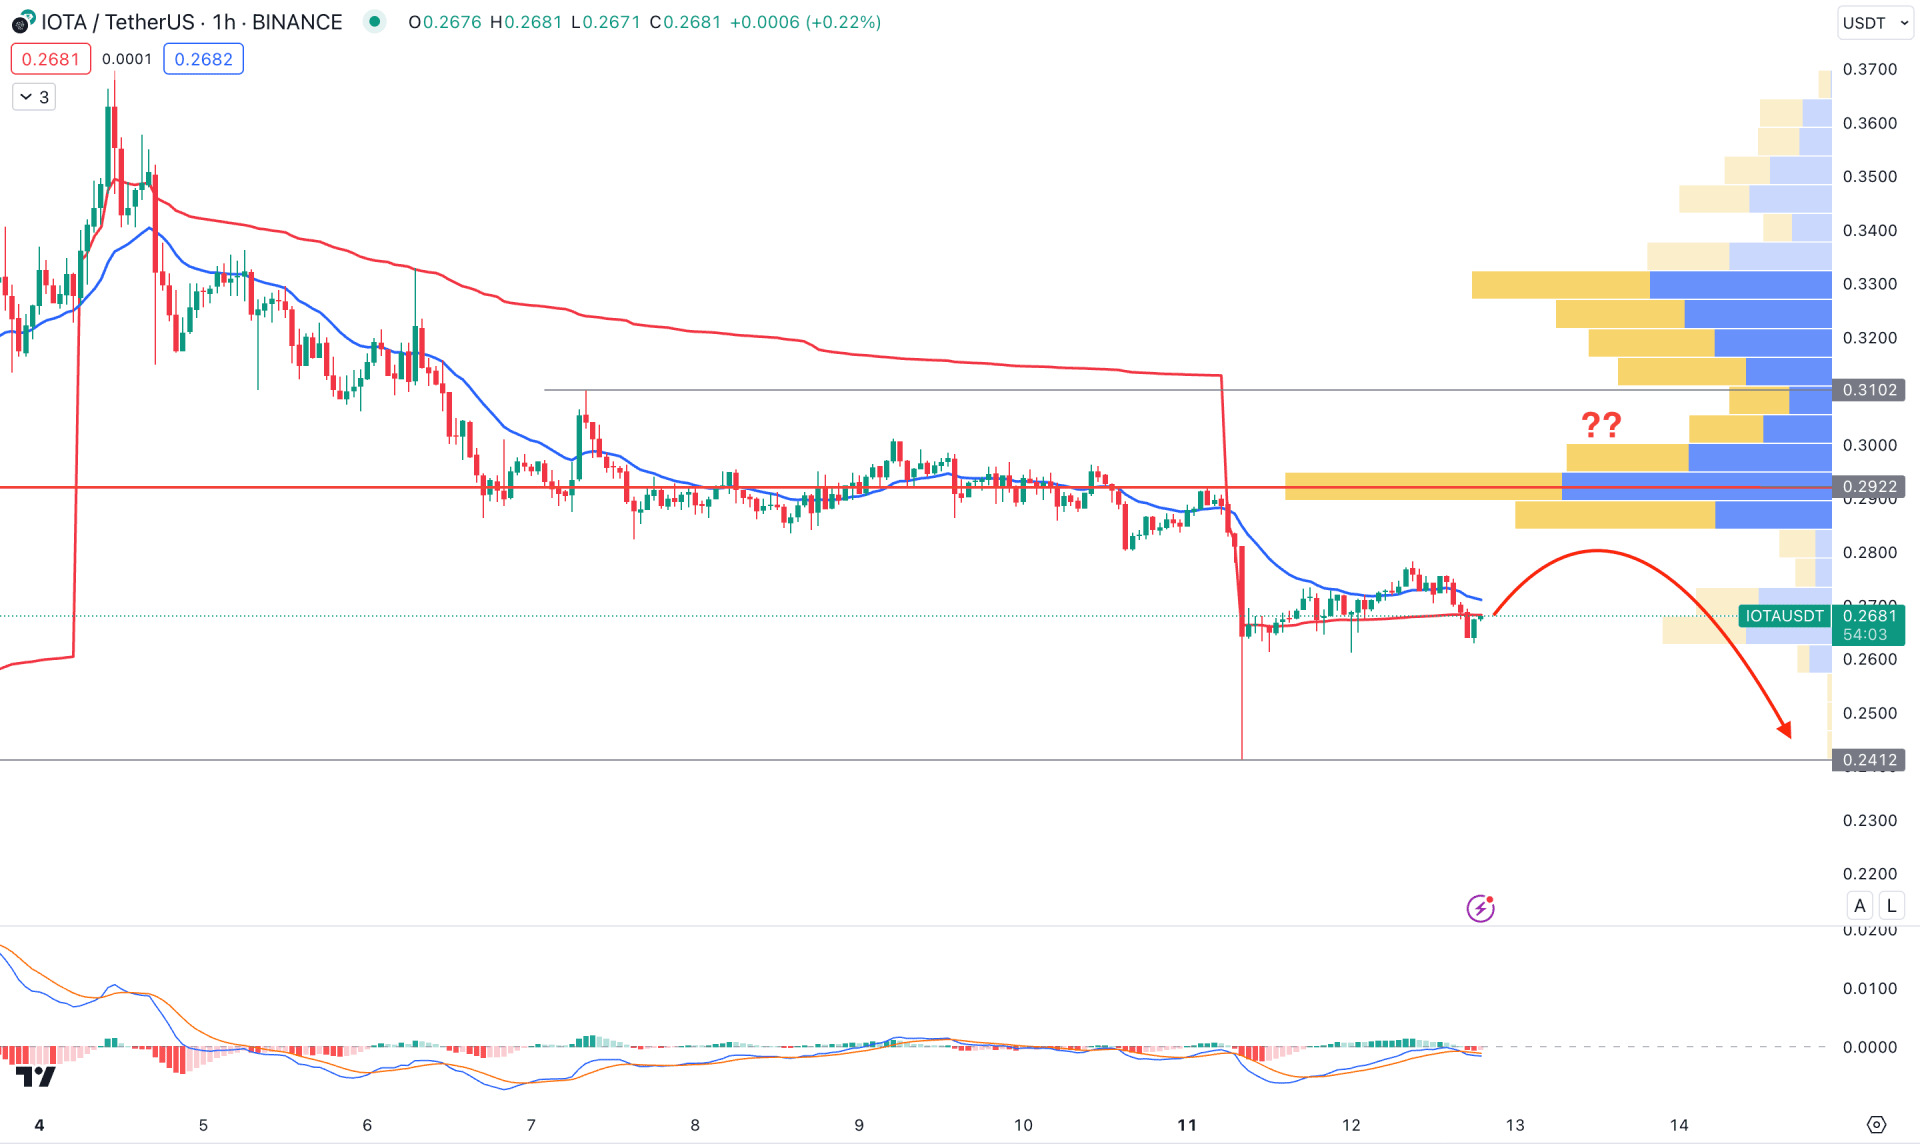
In the H1 chart, the current bearish momentum is potent as the static visible range high volume level is above the current price. Moreover, the dynamic 20 EMA and weekly BWAP work a resistance.
Based on this structure, a downside continuation is potent, which could lower the price towards the 0.2300 psychological level. The alternative approach is to look for a bullish H1 candle above the 0.3100 swing high before considering the selling pressure obsolete.
Based on the current market structure, IOTA/USDT bulls could regain momentum as no significant selling pressure is visible from the top. Investors should closely monitor the intraday swing levels as a bearish sweep from a near-term low could be a potential long opportunity in this pair.


