
Published: March 26th, 2021
The cryptocurrency market still remains in the bullish phase, disregarding the fact of the strong Bitcoin correction. Most importantly, BTC/USD price remains above the key psychological level at $50,000, which emphasizes that the trend is bullish. This obviously will reflect on the altcoin market in general and the IOTA coin in particular.
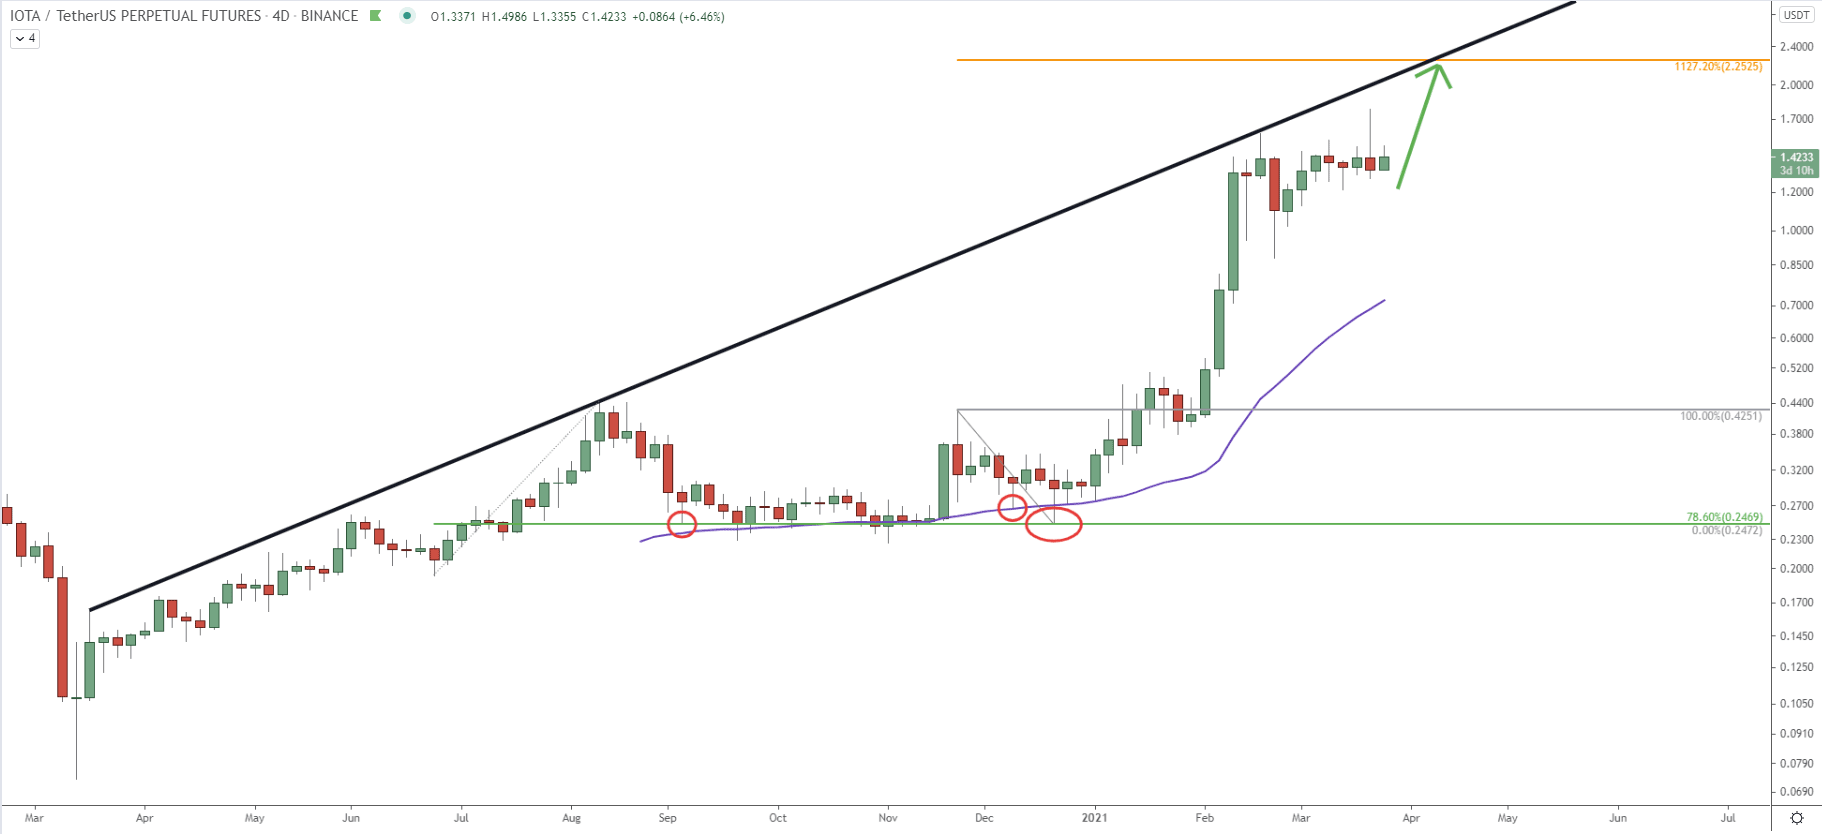
On the weekly chart, IOTA/USDT price is clearly trending up. In fact, compared to the bitcoin, the pullback was much smaller, suggesting that IOTA/BTC price is likely to continue rising. The previous strong support has been formed at 0.24, which is a 78.6% Fibonacci retracement level. There were multiple bounces off this support area, along with the 50 Exponential Moving Average.
Overall, the trend is in a bullish phase, and during the next couple of weeks, the price might increase from 1.42 to 2.25 resistance. This resistance level corresponds to the 1127.2% Fibonacci retracement level applied to the last pullback where 78.6% Fibs and 50 EMA got rejected. It also corresponds to the resistance trendline, implying that the uptrend is likely to last for the next 2-4 weeks.
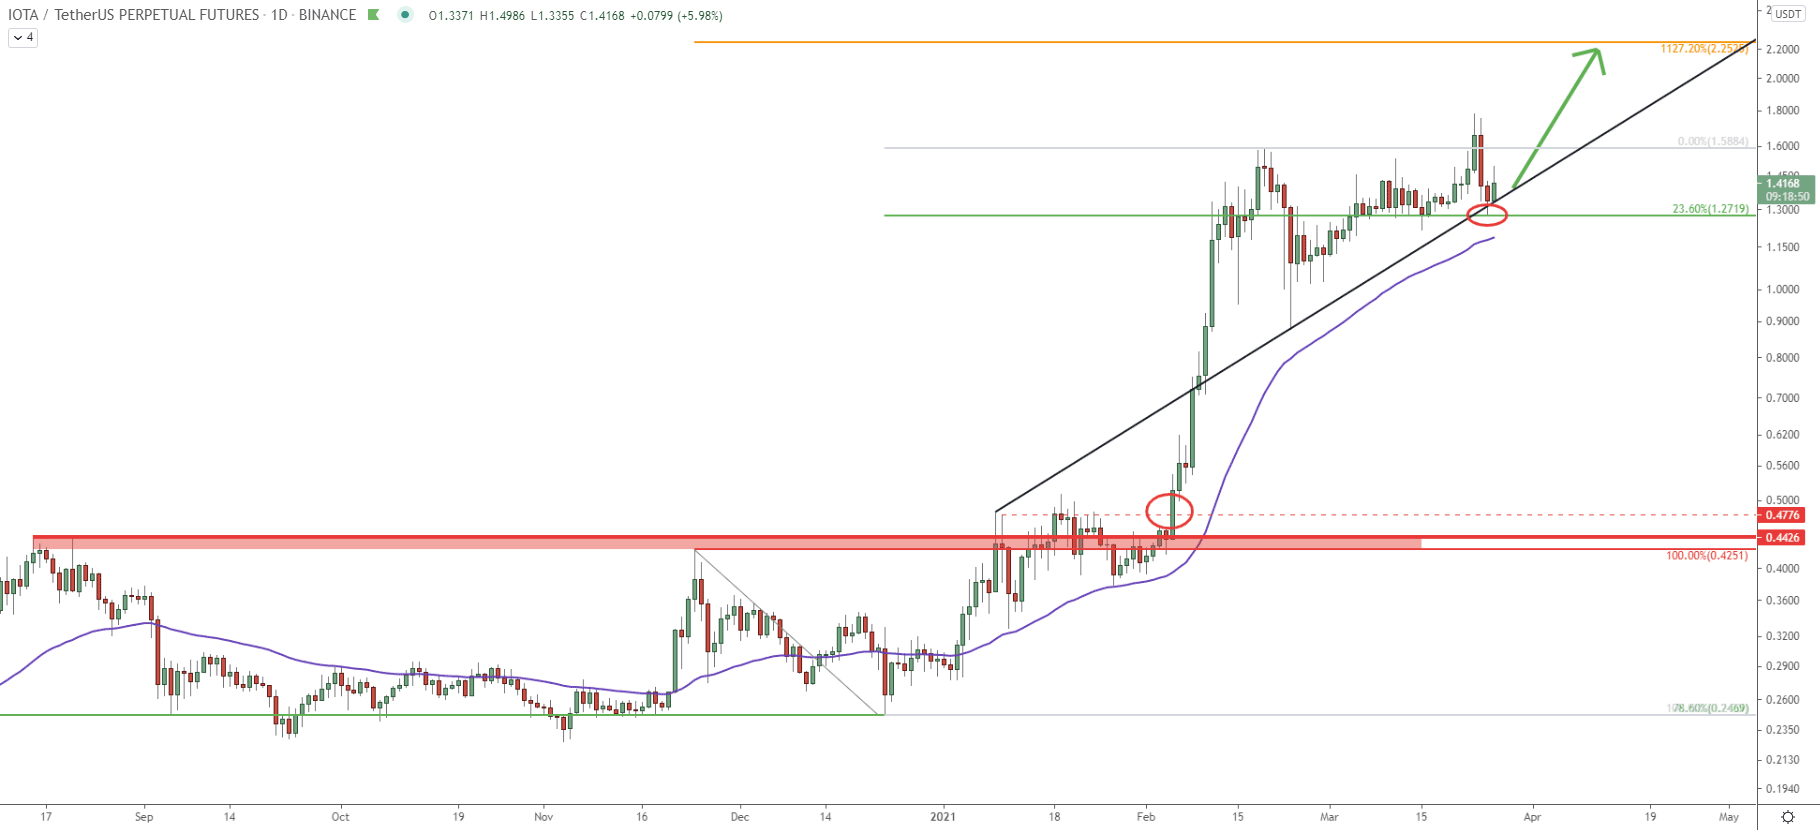
On the daily chart, it can be seen that the strong resistance has been formed near 0.42. This resistance was respected throughout the entire 2020, but in February 2021 it finally got broken, and the price went up exponentially. The average-price uptrend trendline shows, that it has been rejected just yesterday, along with the 23.6% Fibonacci retracement level at 1.27.
This makes 1.27 level key support, and as long as it is being respected, the uptrend continuation should be expected. At the same time, the consolidation phase could be extended further, where IOTA will re-test the 50 Simple Moving Average before/if the price will continue rising. Having said that, the trend remains heavily bullish and the uptrend continuation might have already started.
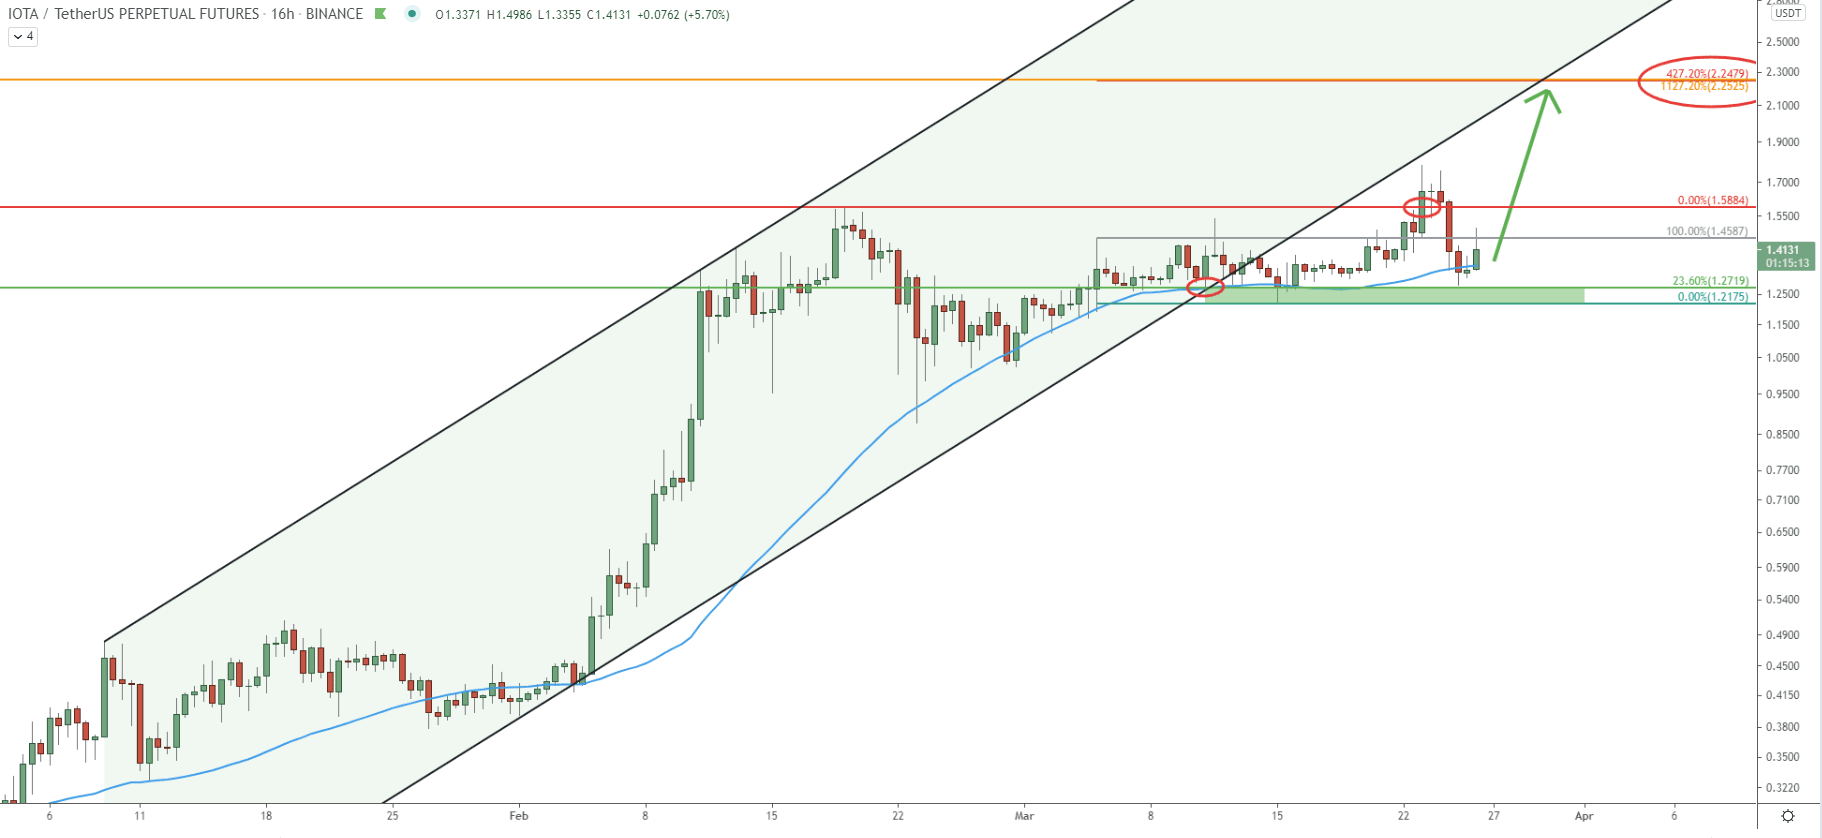
On this 4-hour logarithmic chart, price continues to trade within the ascending channel. At the beginning of March, there was a clear rejection of the bottom of the change as well as 50 SMA. Then, there was an attempt to break below the 1.27 support, but the price only managed to produce the spike below, reaching 1.21 low. This makes an area between 1.21 - 1.27 a key demand zone and a point of interest for buyers.
The most recent price action shows that the previous height at 1.58 was broken, after which the price went down and re-tested 1.27 support. This was a very precise rejection of this level, showing that bulls remain in complete control.
Fibonacci applied to the pullback towards the 1.21 support shows, that 427.2% Fibonacci retracement level corresponds exactly to the previously mentioned resistance at 2.25 as per the weekly chart. At the same time, it corresponds to the channel trendline, which is likely to act as the resistance as well.
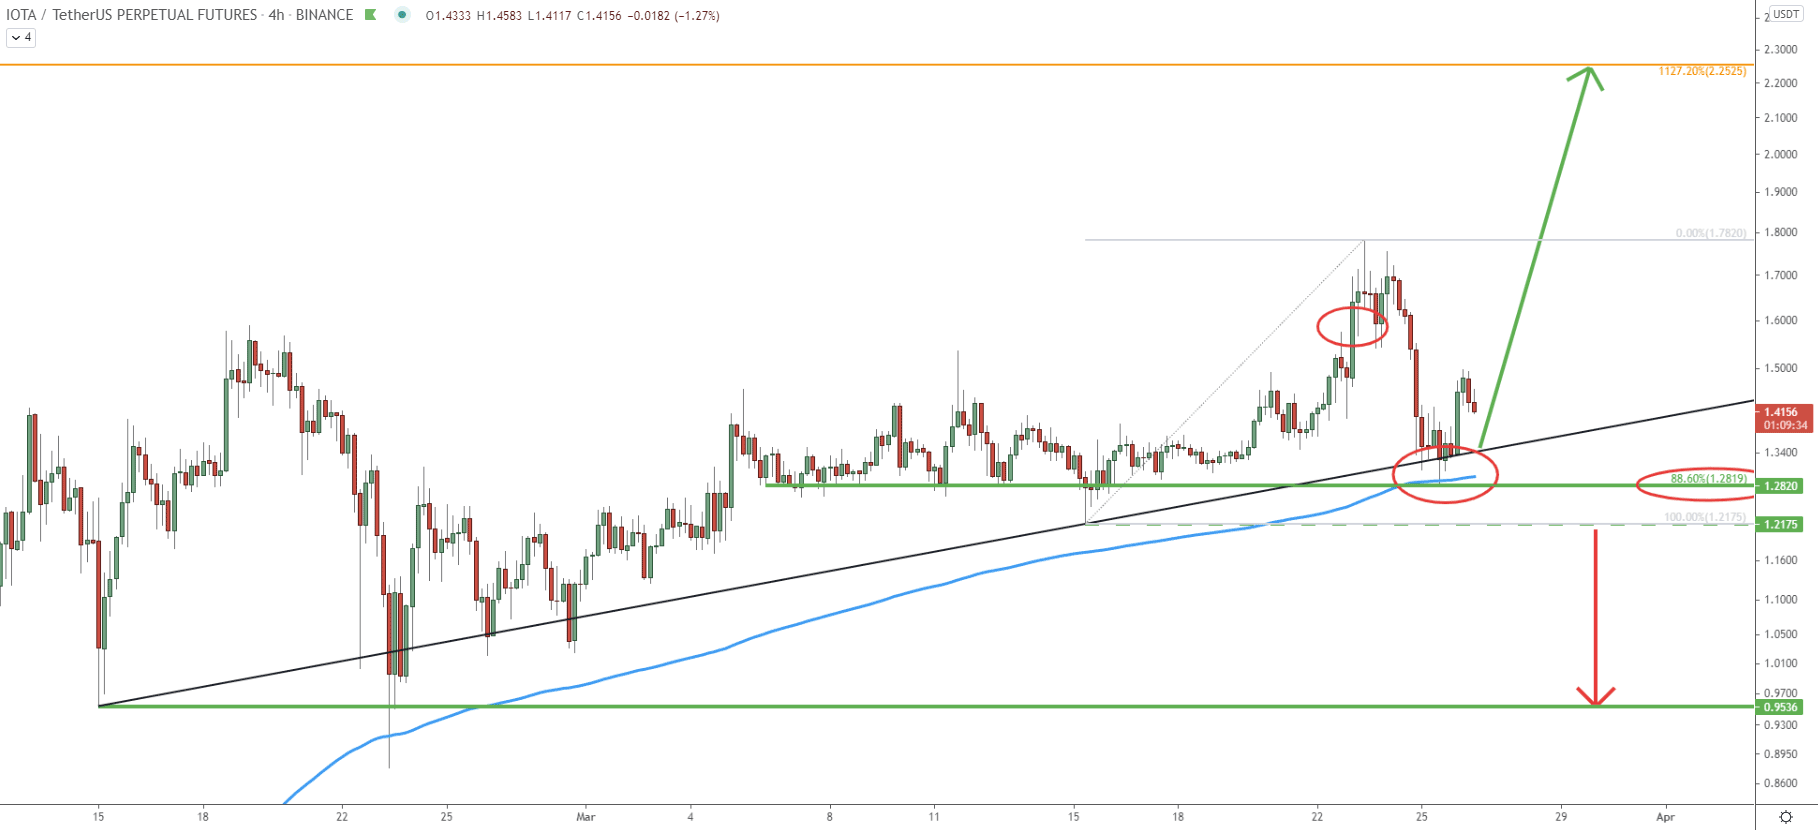
Here we have a clear vision of the key demand area located near 1.28 level. There were multiple bounces off this area throughout the entire March. The most recent bounce occurred yesterday, where the price rejected the 200 SMA along with the 88.6% Fibonacci retracement level. Most importantly is that the uptrend trendline was also rejected, while the higher highs and higher lows pattern is now in place, validating the short-term uptrend. On higher timeframes, the long-term uptrend remains valid, and both these facts are strongly in favor of an uptrend continuation.
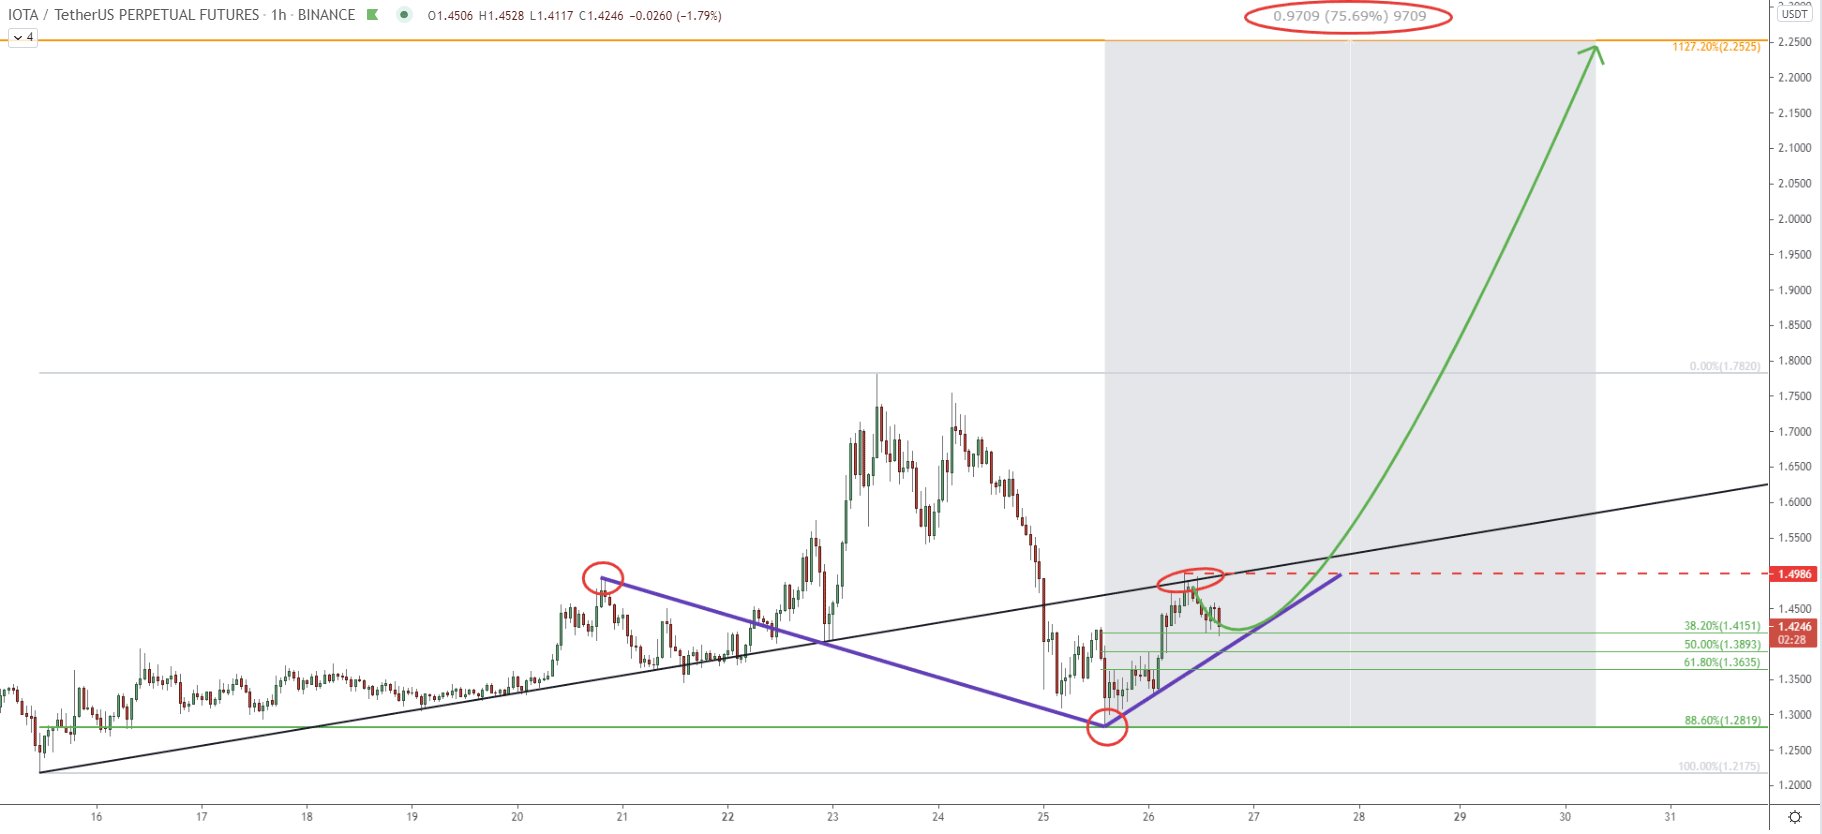
Finally, on the hourly chart price bottomed out at 1.28, where IOTA bounced off the 88.6% Fibs as well as the downtrend trendline. On the other hand, the resistance has been formed at 1.49, where the price rejected the simple uptrend trendline. In the short term, their consolidation might take place between 1.28 support and 1.49 resistance. It is likely that IOTA/USDT will bounce off one of the minor Fibonacci support levels, either 38.2%, 50%, or 61.8% Fibs as can be seen on the chart. It is also highly likely that the uptrend trendline will be tested before/if uptrend continuation will take place. But, buyers will be waiting for the break above the 1.49 resistance, which should be the final confirmation that the uptrend has started. Overall, it might result in a price increase by 75% from the 1.28 low, up to 2.25 resistance.
IOTA price remains in a bullish phase on the long, medium, and short-term timeframes. Nonetheless, a minor resistance must be broken to confirm further bullish pressure. In this scenario, IOTA is likely to continue rising, with a total potential gain of 75%.
As per the 16-hour chart, the key resistance and the potential upside target is spotted at 2.25 level. This is the price that corresponds to two Fibonacci retracement levels, making it an extremely important supply area.
As per the 4-hour chart, the key support area is formed between 1.21 - 1.28. Break below the 1.21 level will invalidate this bullish outlook. In this case, IOTA/USDT can be expected to move further down, potentially towards the key support area near 1.00 psychological level.
Support: 1.28, 1.21, 1.00, 0.95
Resistance: 1.78, 2.25