
Published: March 14th, 2024
At the latest market close, Intuitive Surgical, Inc. (ISRG) lagged behind the S&P 500, which experienced a decline of 0.19%. In contrast, the Dow gained 0.1%.
The company's shares increased by 2.77% in the previous month, which is comparatively slower than the 2.91% gain observed in the medical sector.
Investors avidly anticipate Intuitive Surgical, Inc.'s upcoming financial release. The firm is anticipated to disclose quarterly earnings of $1.39 per share, which signifies a 13.01% increase from the previous year. Revenue of $1.87 billion is also projected, representing a 10.09% surge.
Regarding the entire fiscal year, analysts have projected earnings of $7.98 billion and revenue of $6.18 per share, representing increases of 8.23% and 11.95 percent, respectively.
Investors should closely observe any recent adjustments in analyst forecasts about Intuitive Surgical, Inc. Positive revisions frequently reflect the development of transient business trends, whereby a positive outlook signifies a favorable trajectory for the organization.
Intuitive Surgical, Inc. is presently valued at 63 forward price per share (P/E), an amount that exceeds the industry mean of 28.28. In addition, ISRG's PEG ratio is 4.83, which indicates the expected earnings growth rate in conjunction with the P/E ratio.
Let's see the future price direction of this stock from the ISRG technical analysis:
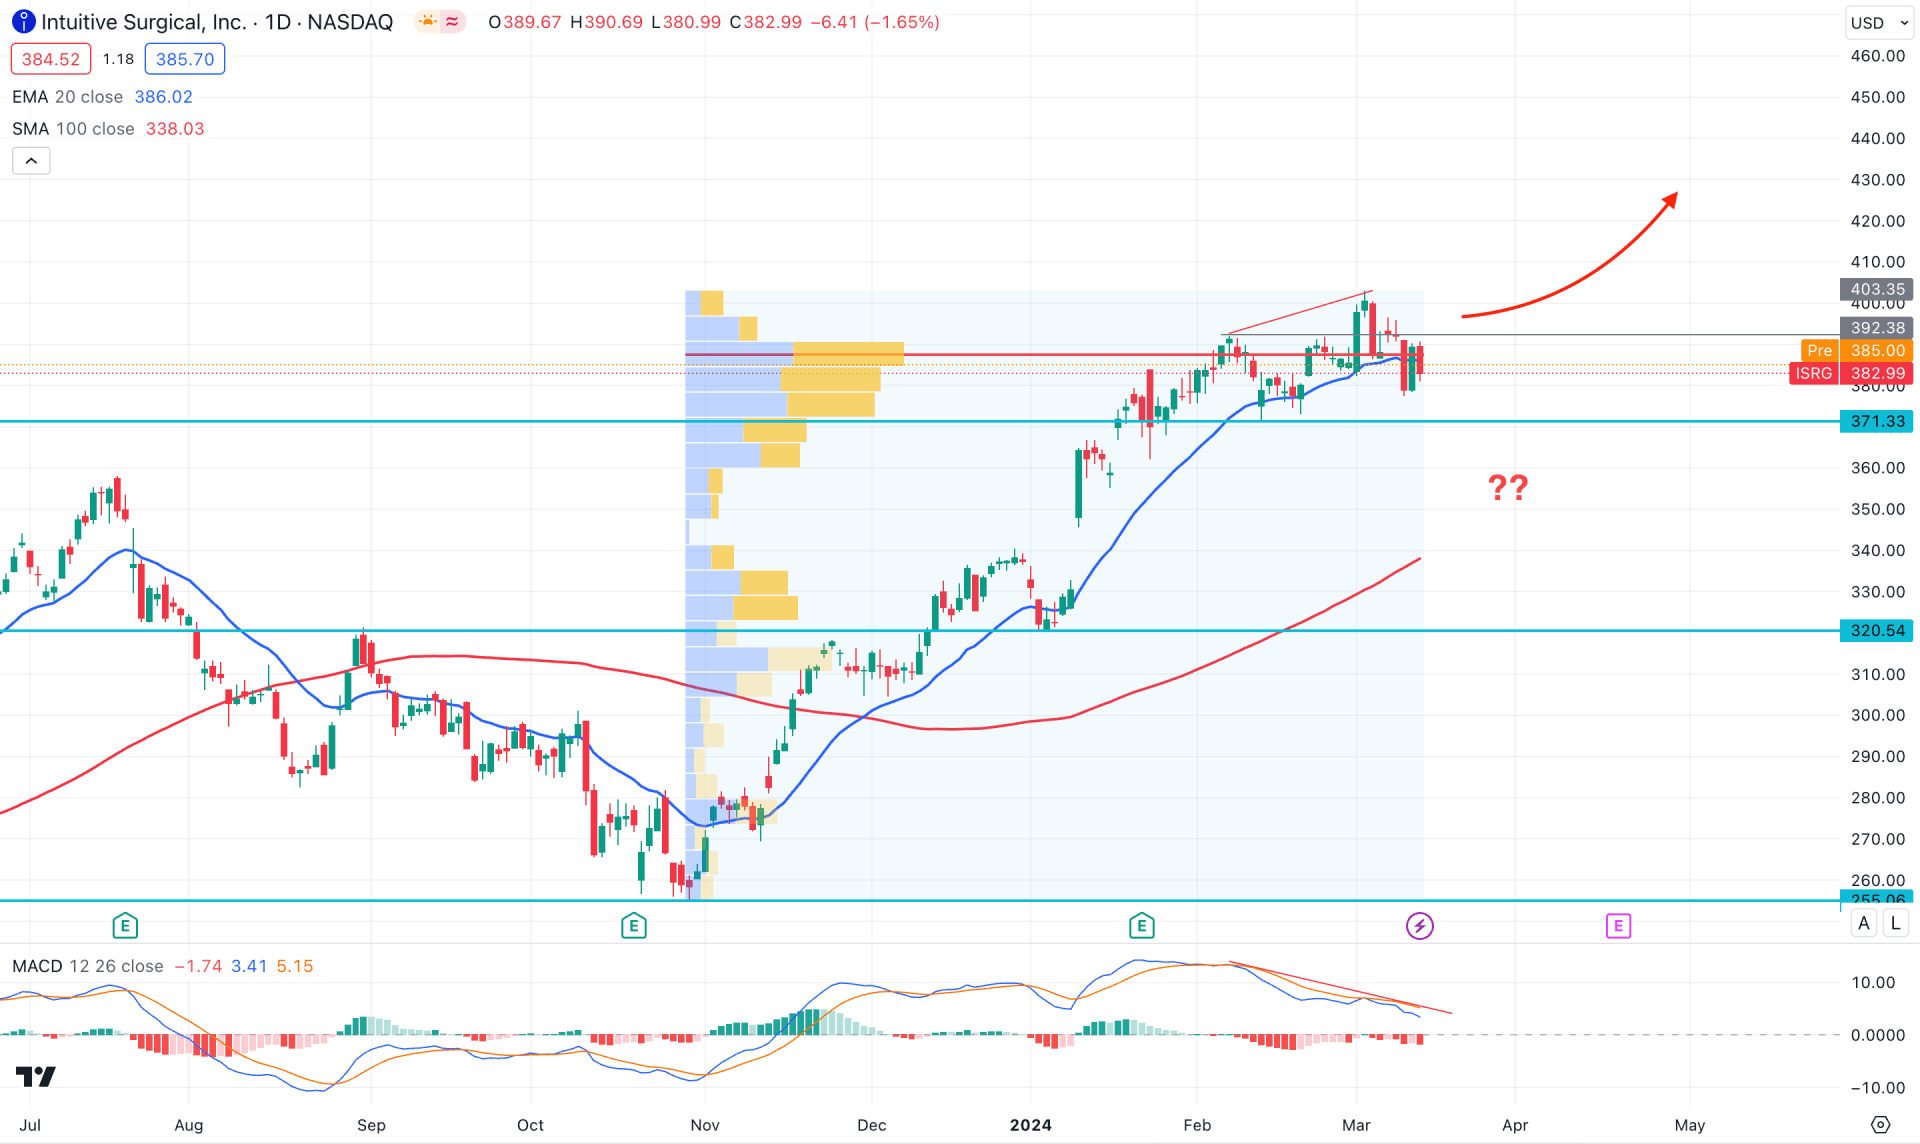
In the daily chart of ISRG, the broader market outlook is bullish, with the current price trading at the dynamic 20-day Exponential Moving Average level. However, the ongoing buying pressure has faded after making the new high at 403.35 level, which could be a challenging factor for bulls.
Before moving to the daily price action, let's see the market from the bird's eye. As per the monthly candlestick pattern, the running candle remains sideways after a minor bullish pressure in February. It is a sign that bulls are losing momentum, and a confirmation might come from the March close. A successful bearish candle close below the February high could be a potential short opportunity in this stock. However, more clues are needed from the lower timeframe to gauge the early upcoming movement.
Based on the weekly chart, a bearish continuation is visible as the current candle trade is below last week's low, while dynamic support levels are way below the current price.
A similar price action is visible in the daily chart, where the current price made a bearish CHoCH pattern at the top. Moreover, the daily candle closed below the dynamic 20-day EMA, which suggests a minor downside correction.
In the secondary window, the MACD signal line formed a divergence, suggesting buyers profit taking from the existing bull run. Moreover, the current MACD Histogram remained sideways at the neutral point, which indicates a limit to the possible bearish trend.
Based on the ongoing price action, a bearish correction may come after having a daily close below the 371.33 static level. Investors should closely monitor how the price reacts after violating this line, as a consolidation below this level could open the room for reaching the 320.54 support level.
The alternative approach is to find an immediate bullish reversal from the current area before anticipating the trend continuation. The ideal trading strategy is to look for a daily candle above the 392.28 level, which could extend the buying pressure toward the 450.00 psychological level.
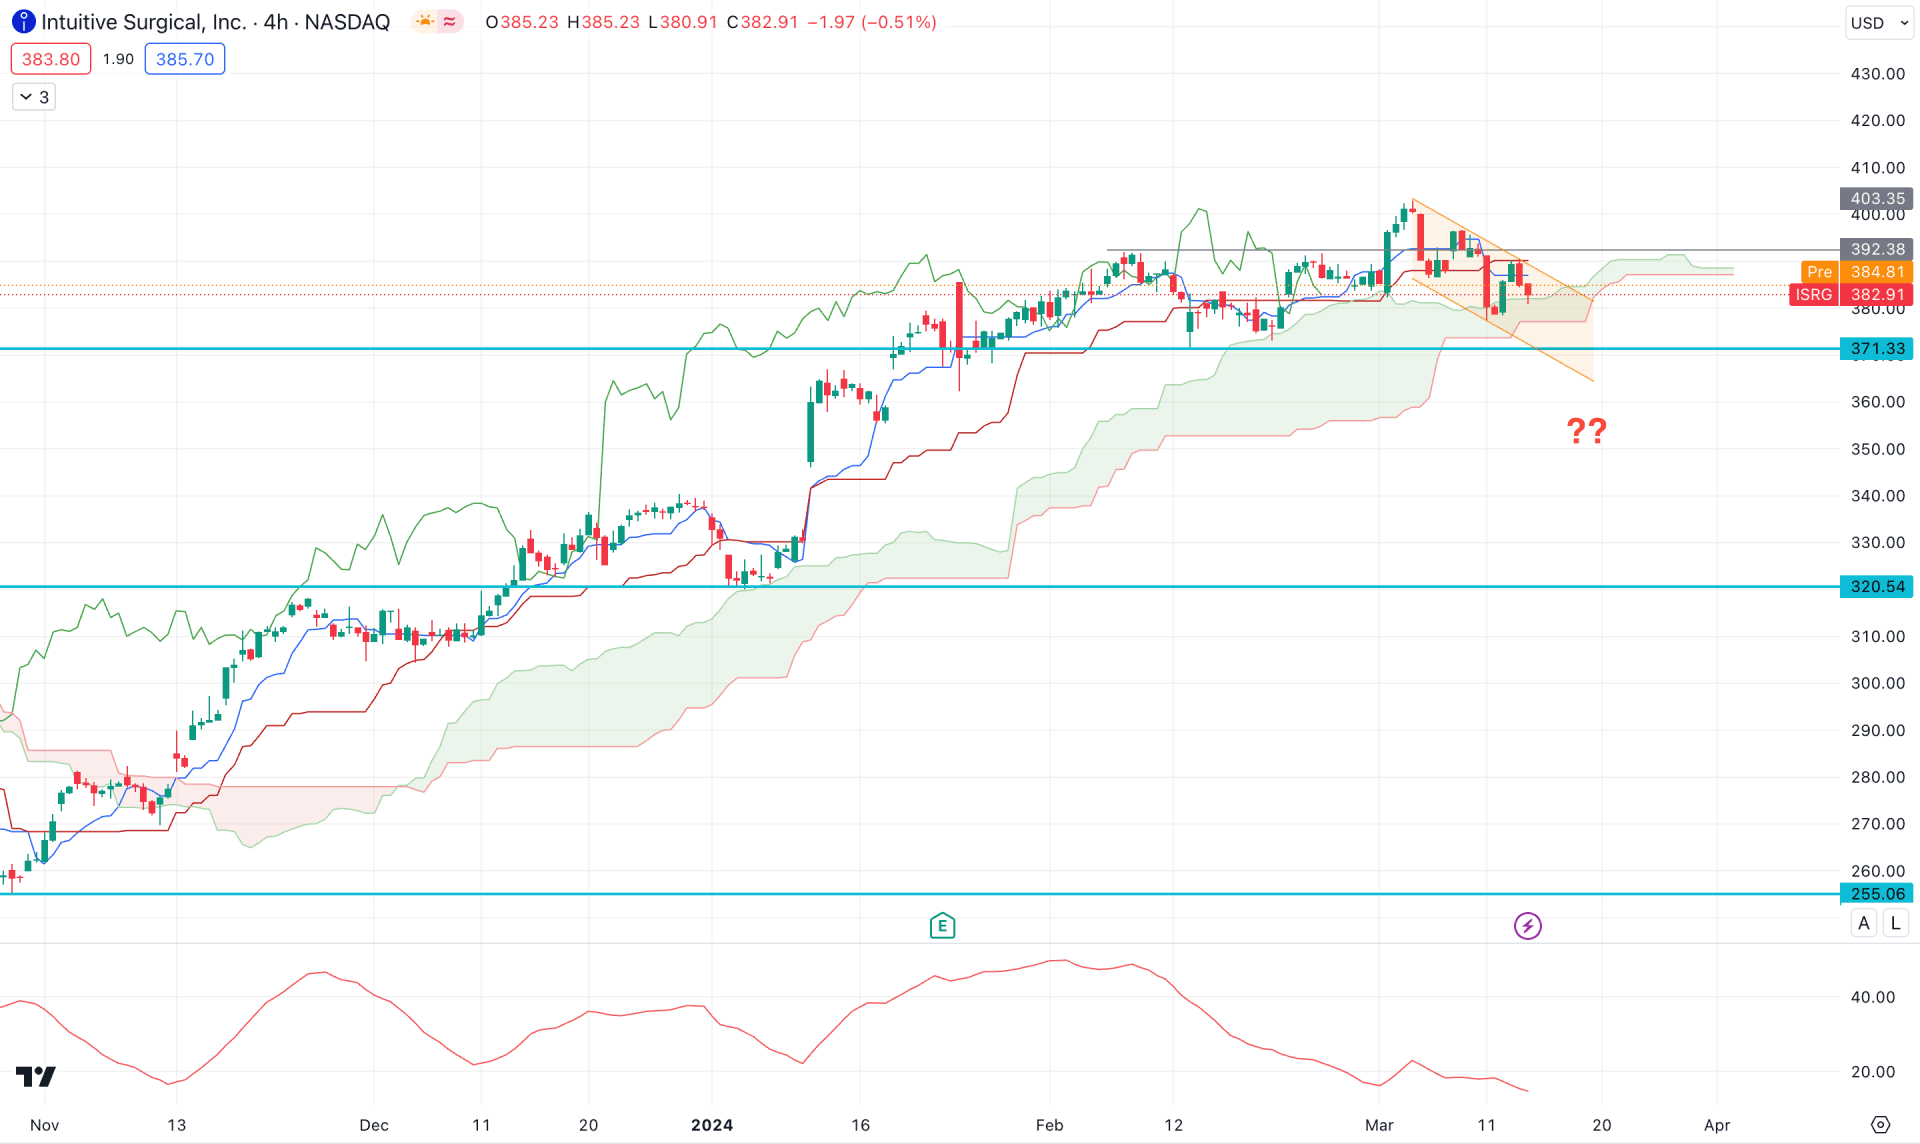
In the H4 timeframe, the overall market momentum is indecisive as the current price trades within a descending channel above the Kumo Cloud. However, the future cloud looks negative to bulls as the Senkou Span A comes closer to the Senkou Span B.
In the secondary window, another signal of a corrective price action is visible as the Average Directional Index (ADX) line hovers below the 20.00 satisfactory line.
Based on this H4 structure of ISRG, investors need a solid seller's failure in the market before anticipating a bullish continuation. In that case, a valid channel breakout with an H4 close above the 392.50 level could be a trend continuation signal, targeting the 430.00 level.
Alternatively, the ongoing price action signals a possible bearish correction, which needs proper validation before anticipating a short signal. A valid H4 close below the 371.33 level could open a bearish opportunity, targeting the 320.54 static level.
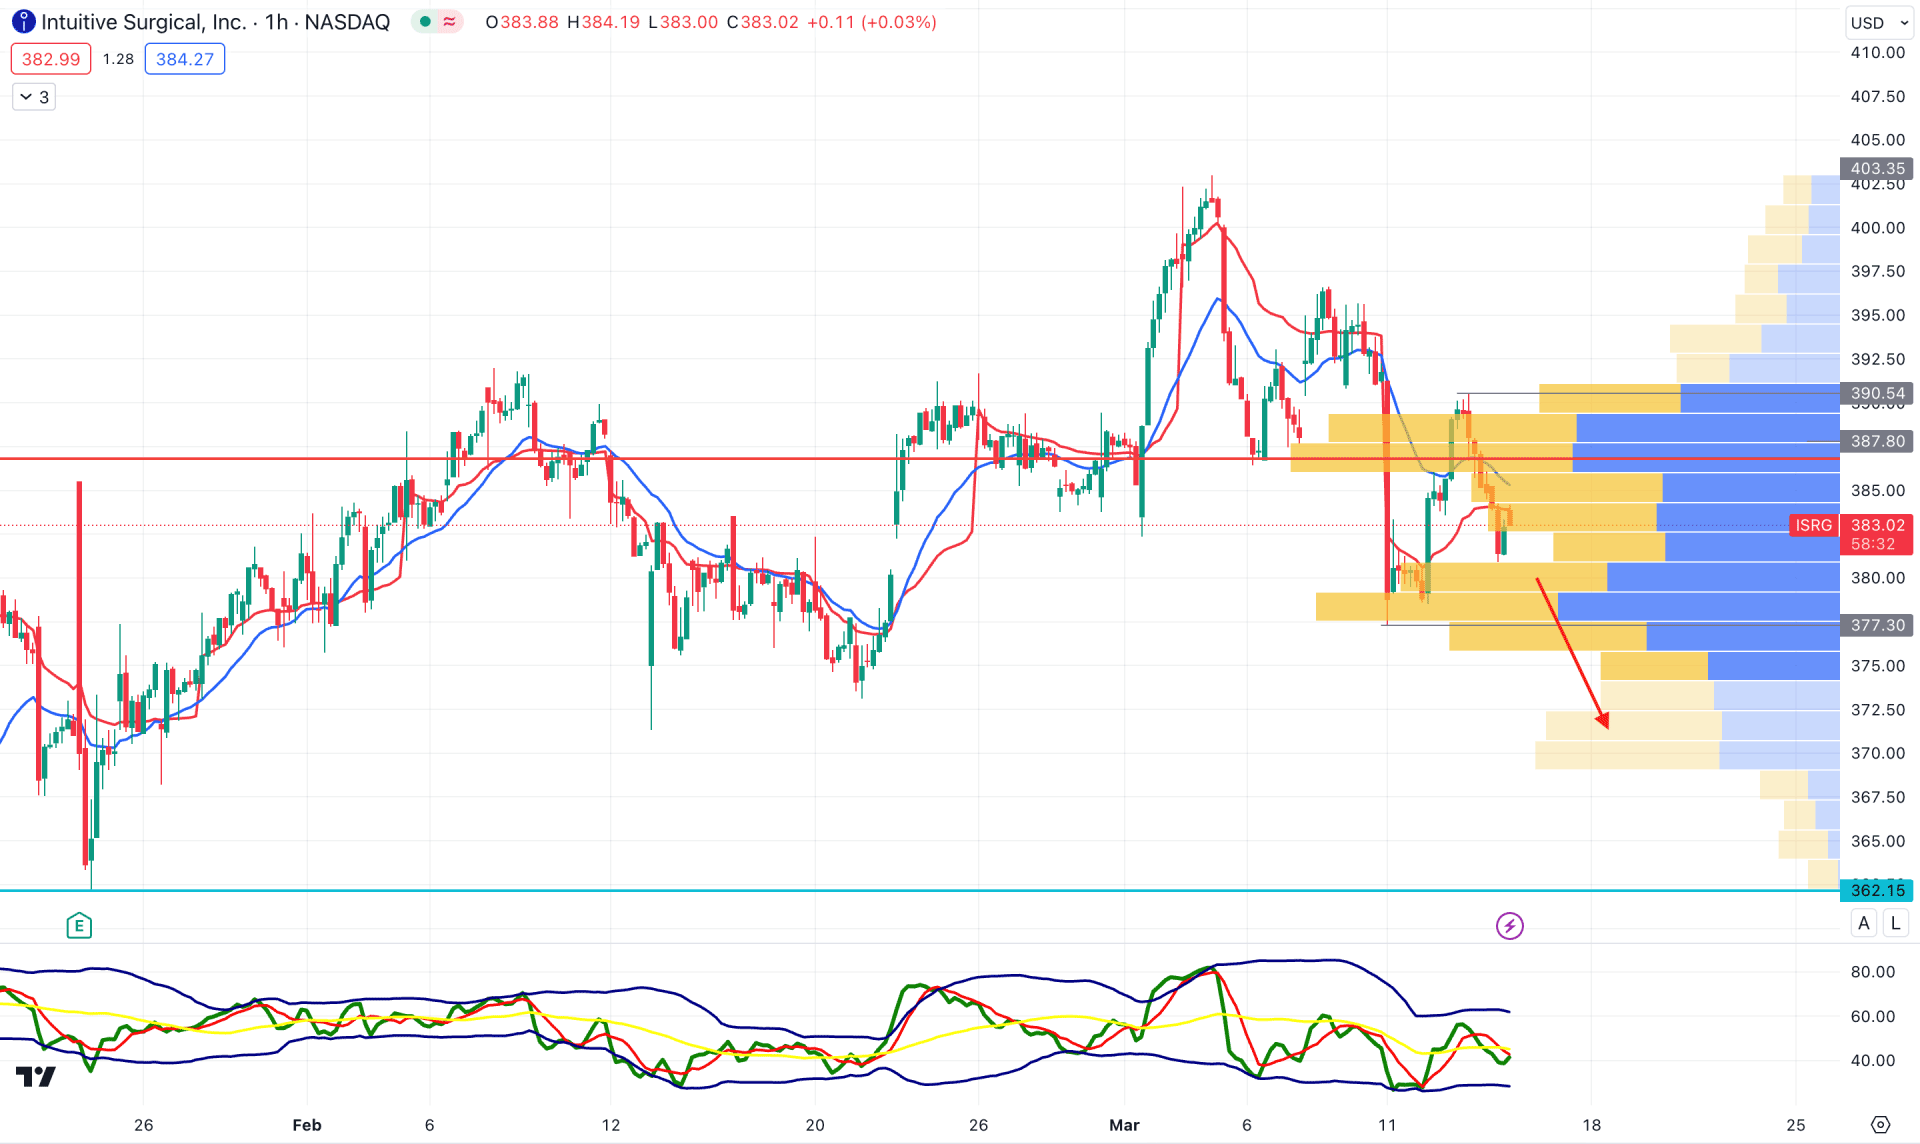
In the H1 chart of ISRG, the overall market momentum is bearish, as the current price trades have been below the visible range high volume level for a considerable time. However, the 20 EMA and weekly VWAP are above the current price, with a bearish slope, which suggests a confluence of bearish factors.
Based on this outlook, a bearish continuation is potent from the current area, where the main aim is to test the 362.15 support level.
The alternative approach is to look for long trades after having an H4 close above the 391.00 level, which could extend the buying pressure above the 400.00 area.
Based on the current multi-timeframe analysis, the ISRG price is more likely to extend the buying pressure after considerable downside correction. Investors can enjoy profits from the downside correction, which needs proper validation from the lower tiemframe's price action.


