
Published: November 30th, 2022
Intuit (NASDAQ: INTU) beat earnings and revenue per share expectations during this week’s fiscal Q1 earnings report release.
The financial software company has beaten estimates by 47 cents as the adjusted EPR came at $1.66. Revenue comes at $2.6B vs. $2.5B, as expected.
After-hours trading, Intuit shares declined by 1.7% on the intraday chart and for this year, there is a 41% slide.
In the specific revenue segment, the revenue was $2.6B for TurboTax maker alongside other accounting software.
The credit Karma division of the company was experiencing collapse over all verticals in the last few weeks of Q1, as previously said. Chief financial officer of Intuit Michelle Clatterbuck said "Despite this impact on Credit Karma, we are reiterating operating income and earnings per share guidance for the fiscal year 2023.”
Intuit also predicts the full fiscal year 2023 revenue from $14.035B to $14.250B, approx. 10%- 12% growth, down from the previous growth guidance of 14%-16%.
The current stock price of Intuit finished at $379.71, -10.76% in the previous three months and -41.79% in the last twelve months.
Let’s see the future price direction of Intuit stock from the INTU technical analysis:
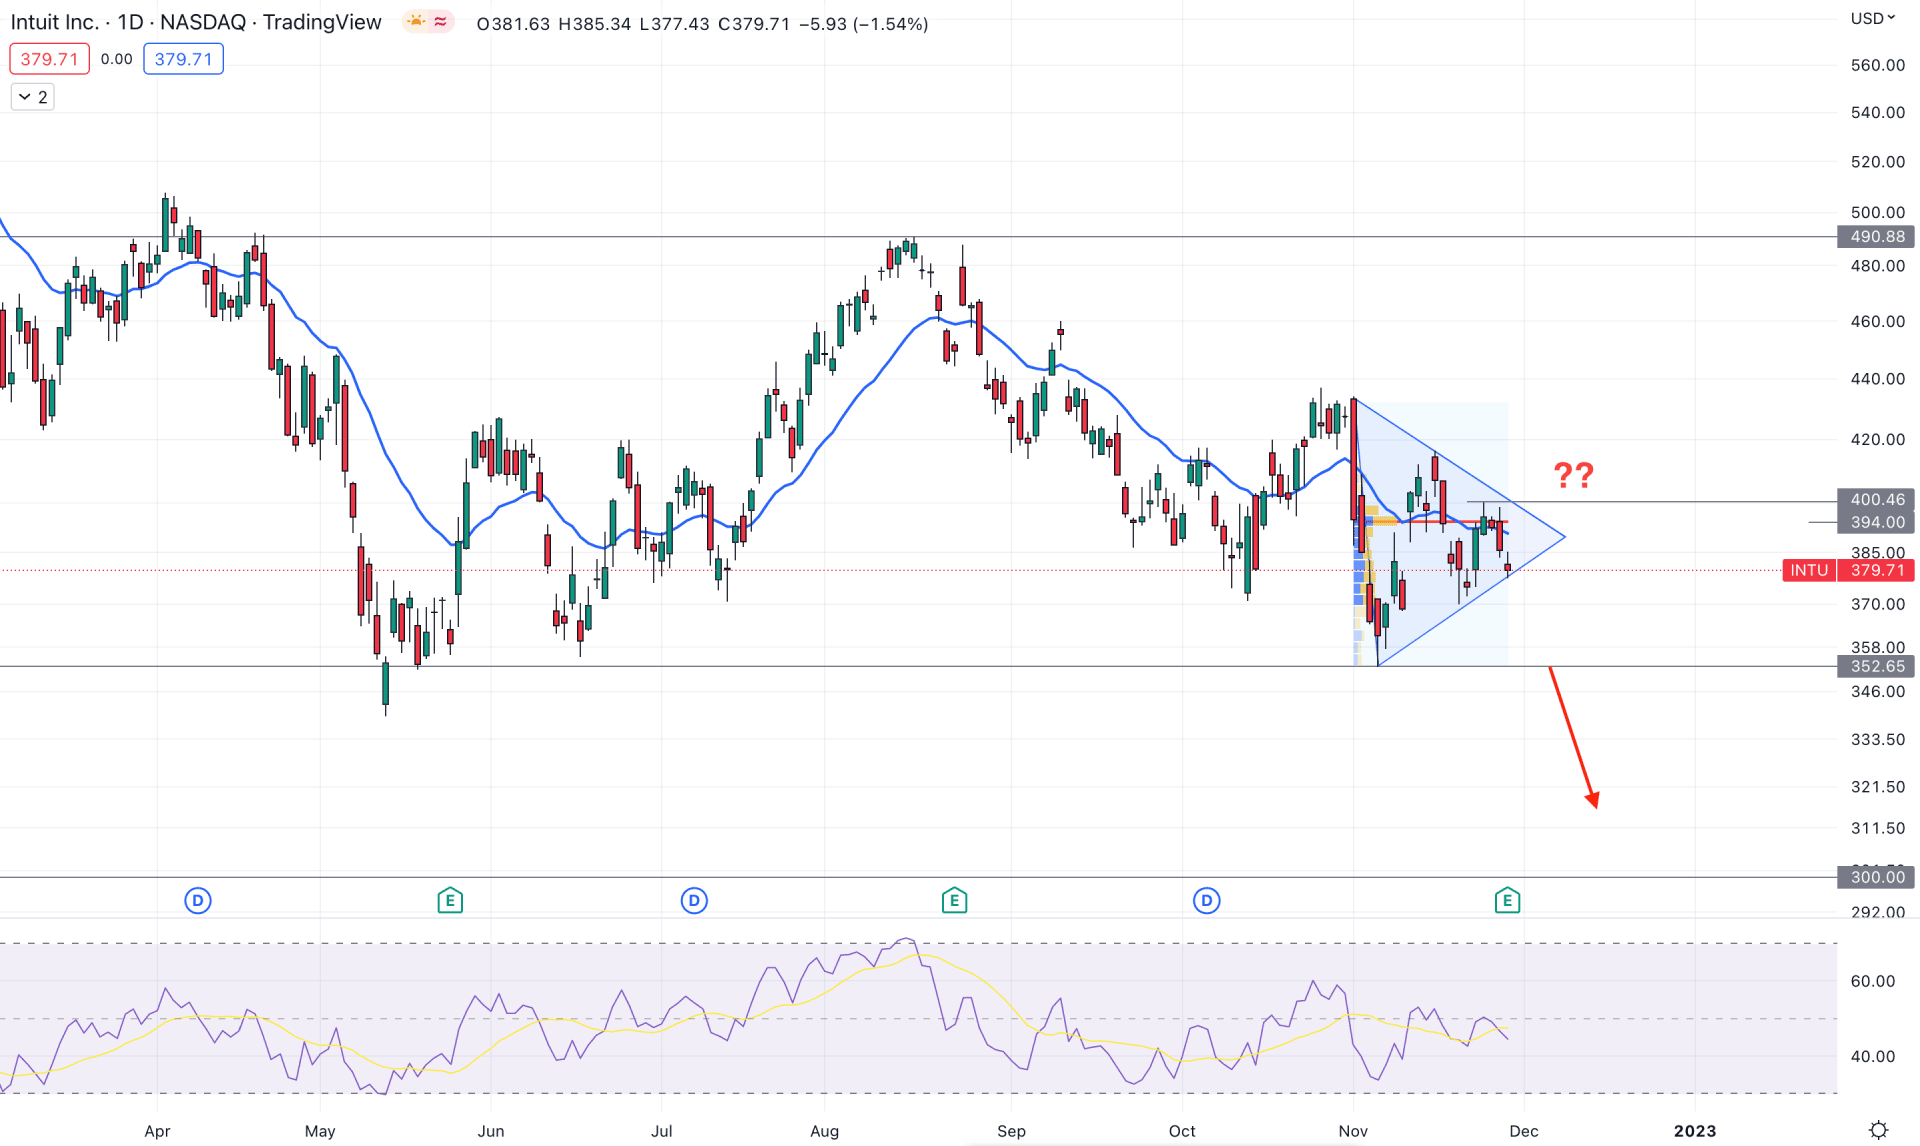
Although the latest earnings per share for INTU came with a 39% increase, the price did not show any significant movement. The weaker revenue forecast grabbed sellers' attention in this pair, which could increase the possibility of a bearish breakout from the triangle pattern.
In the daily chart of INTU, the broader market context is bearish, where the current trading range is 507.52 high to 338.78. Although the current price is trading at the discounted level of this zone, there is a sign of buyers' presence in the market from the fixed range high volume level.
The current high volume level from 352.65 low to 433.73 level is 394.00, which is above the current market price. Moreover, the dynamic 20-day EMA is trading at a high volume level and providing a confluence resistance to the price.
In the indicator window, the Relative Strength Index (RSI) shows extreme selling pressure as it remains below the 50% level for a considerable time.
Based on the daily price structure of INTU, bears have a higher possibility of taking control of the price in the coming days. In that case, a bearish selling pressure below the triangle low is needed, which could lower the price towards the 300.00 psychological level.
On the other hand, any bullish reversal and a daily candle close above the dynamic 20-day EMA and 394.00 high volume level could open a long opportunity, targeting the 490.88 resistance level.
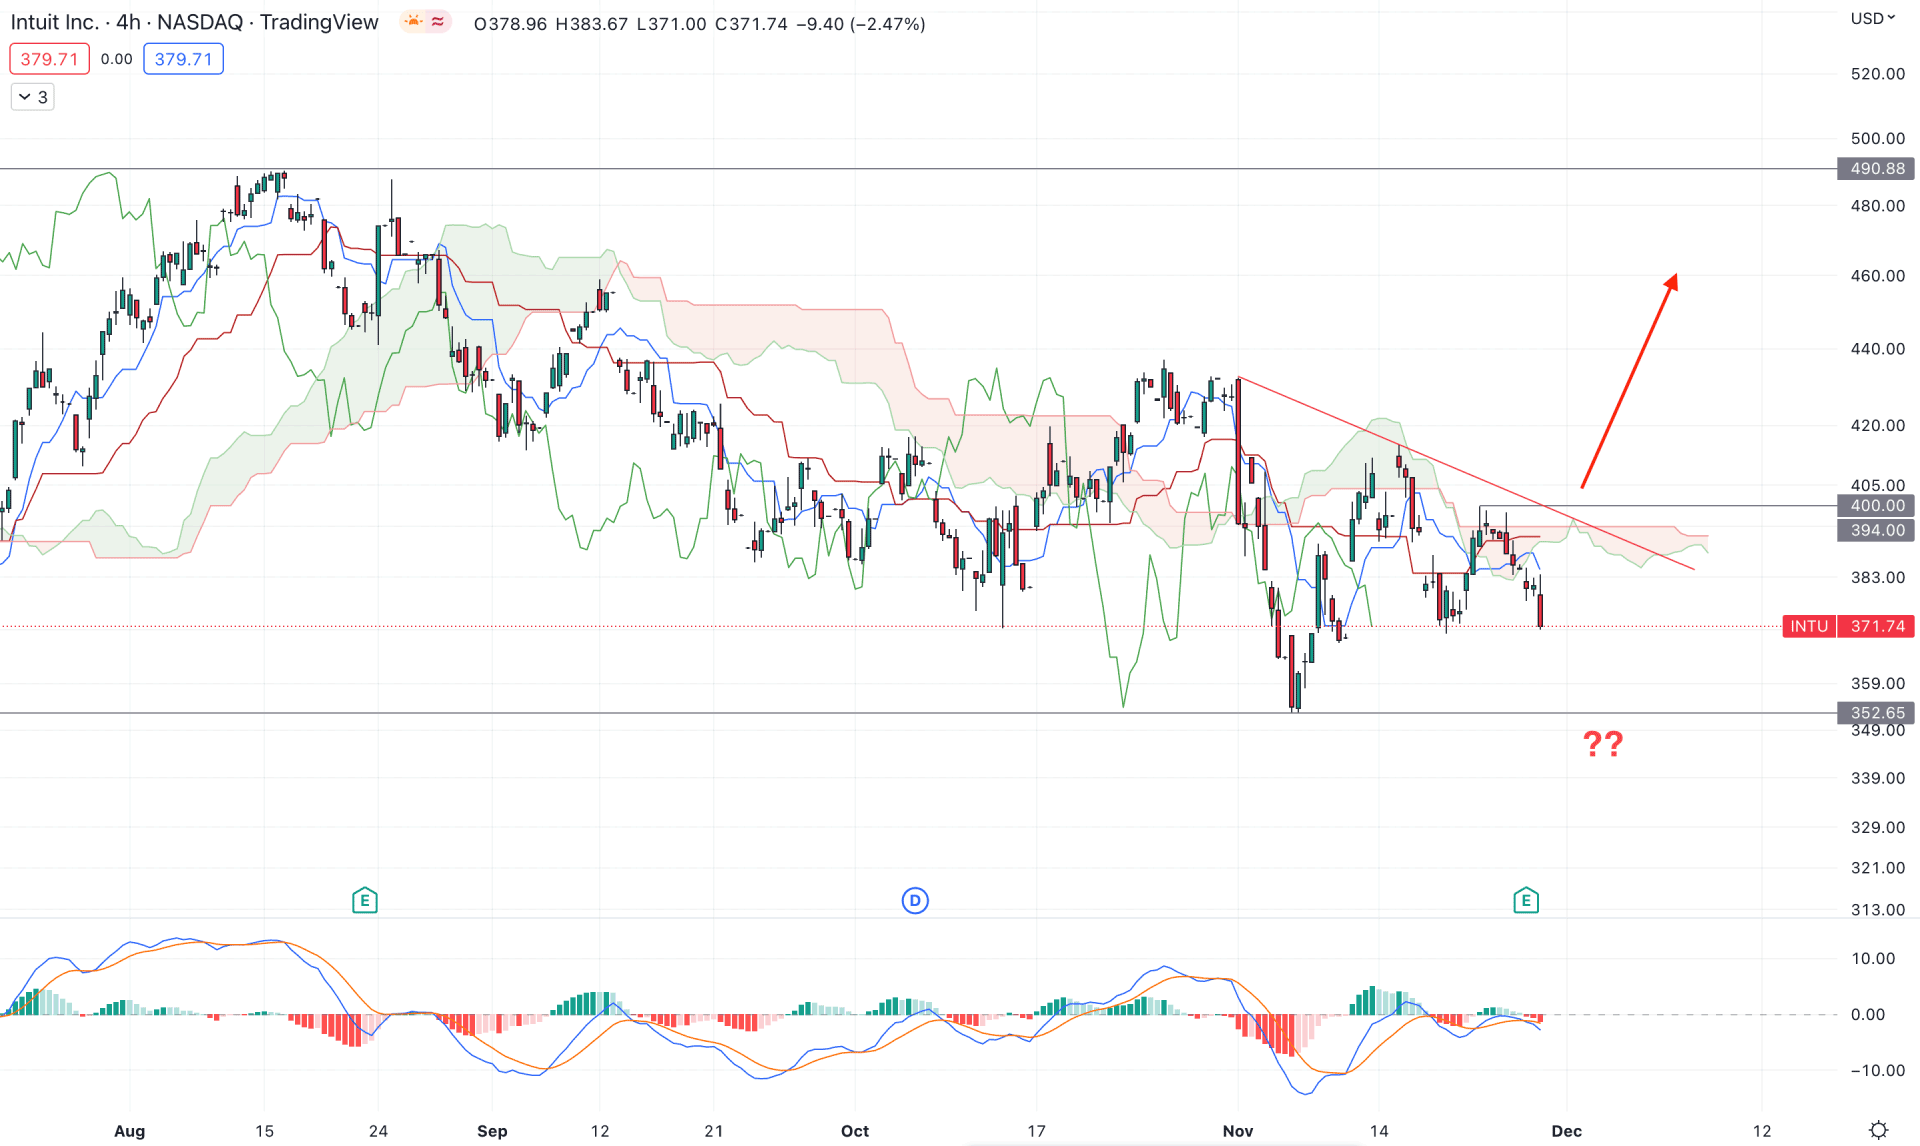
In the Intuit stock H4 chart, the bearish possibility is potent as the current price is trading below the cloud resistance. Moreover, the future cloud shows a bearish possibility, where the Senkou Span A is below the B. The current price is also trading below the dynamic Tenkan Sen and Kijun Sen, from where any bearish pressure could form a new bearish trend.
In the indicator window, the MACD Histogram is losing its momentum from the bearish zone, where a bullish breakout and a formation of a positive Histogram could offer a long opportunity.
The H4 outlook offers both bullish and bearish trading opportunities but investors should monitor how the breakout happens.
The bullish trading opportunity is available once these conditions are present in the price- a bullish trendline breakout, a bullish recovery above the dynamic Kijun Sen, a flip in the future cloud and a positive MACD Histogram. In that case, the buying opportunity is the potential to take the price towards the 490.88 key resistance level.
The alternative approach is to find a strong bearish rejection from the dynamic Kijun Sen level, which could extend the selling pressure towards the 300.00 key psychological level.
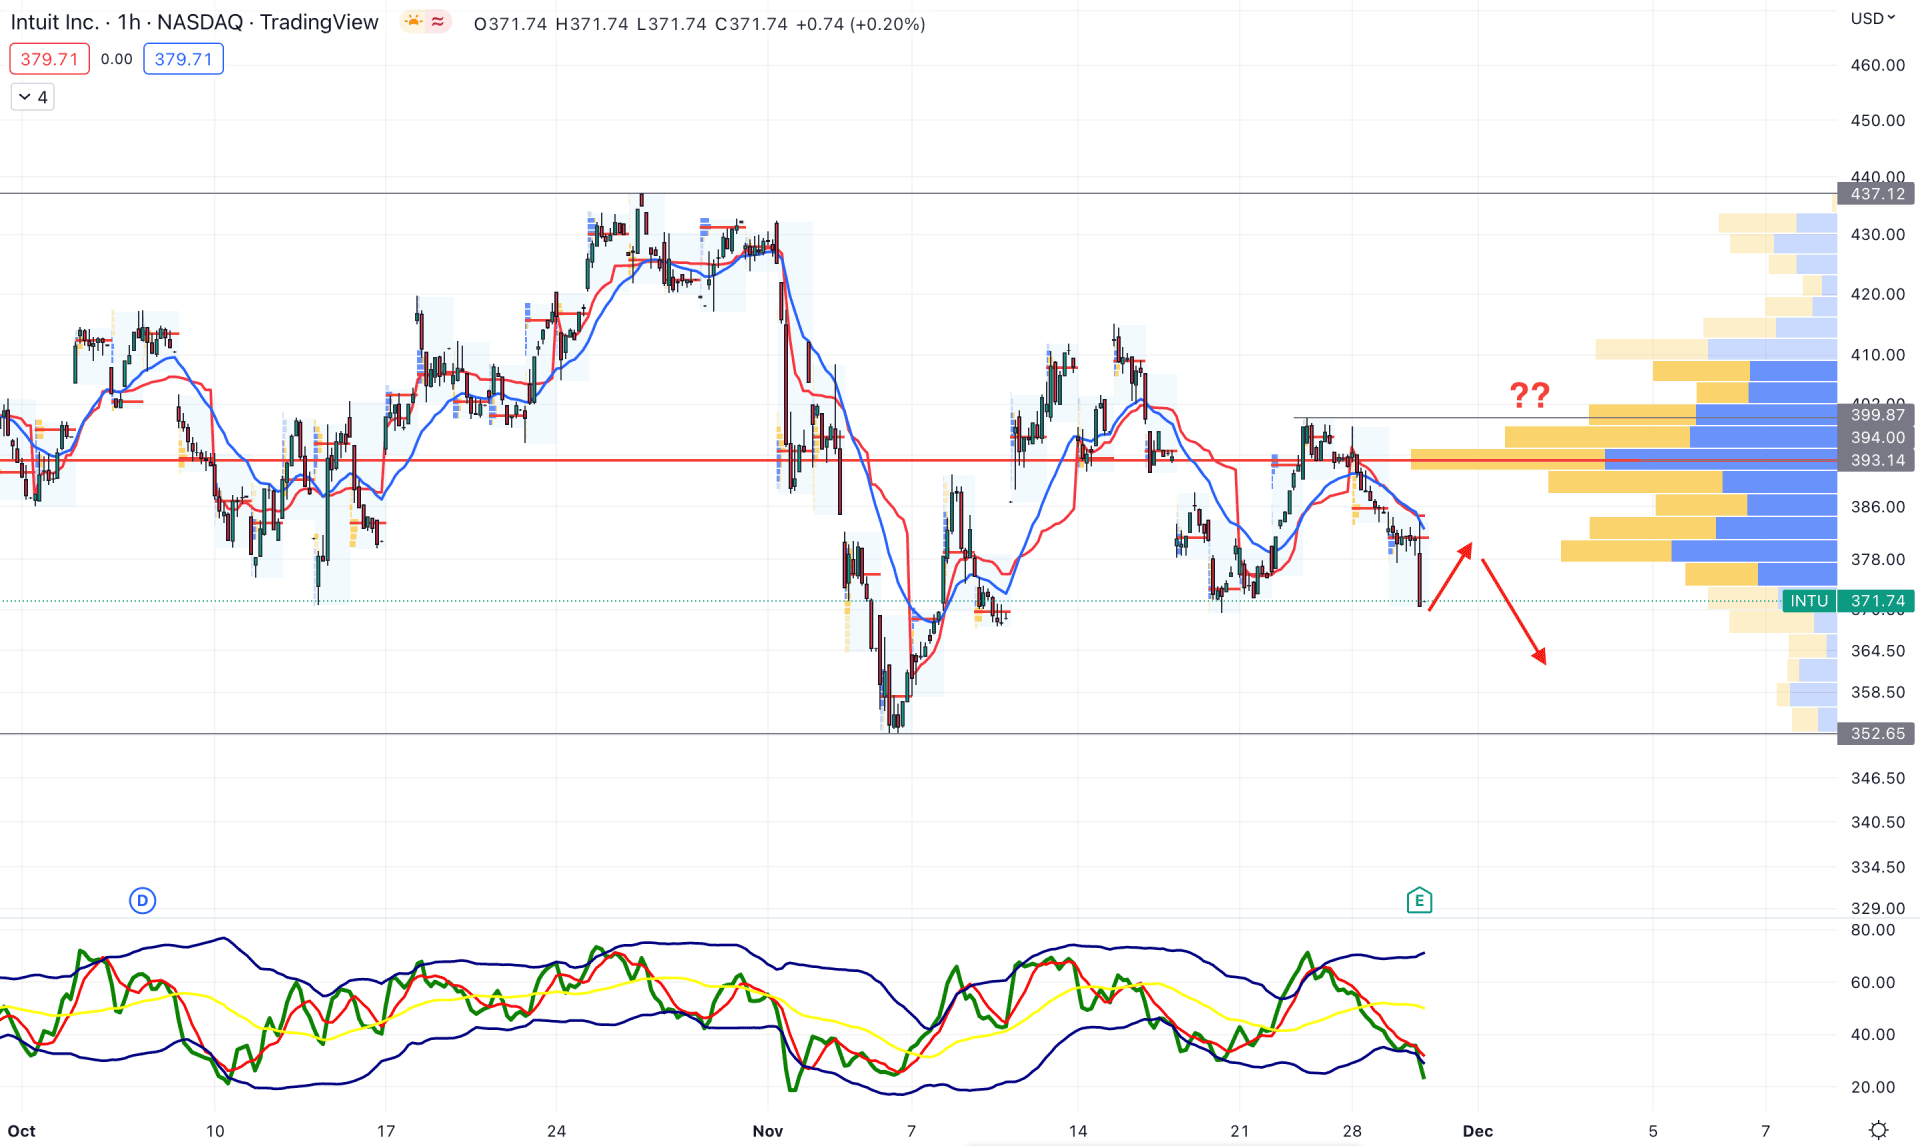
In the INTU H1 chart, the intraday selling pressure is clearly visible as the current price is trading below the visible range high volume level of 393.14. Moreover, the latest intraday high volume level is above the price, making multiple lows.
In the main chart, the dynamic 20 EMA and weekly VWAP are closer to the price, working as a resistance level. Moreover, the Traders Dynamic Index (TDI) remains below the lower band area.
Based on the current price outlook, any bearish rejection from the 375.00 to 395.00 area could offer a short opportunity, where the main aim is to test the 350.00 area. The alternative approach is to wait for a bullish breakout and an H1 candle close above the 400.00 level before aiming for the 417.12 level.
Based on the current findings, the INTU price needs to form a strong breakout from the latest triangle pattern before offering a trading opportunity.
As the broader market trend is bearish, a strong break below the triangle support could offer a high probable trading opportunity. For bulls a strong breakout with a new high volume level formation is needed before offering a long setup.


