Published: August 20th, 2024
Intuit Inc, the company that creates QuickBooks, TurboTax, and other accounting software, has dropped 3.05% in the past month, outpacing the 3.2% loss in the S&P 500 and the 7.5% loss in the Computer and Technology sector.
Investors and analysts will closely monitor Intuit's performance in its next earnings release. The business's revenue report will be made public on August 22, 2024. An EPS of $1.86 is expected for the company, representing a 12.73% increase over the same quarter a year ago. In the meantime, our most recent consensus estimate predicts $3.08 billion in revenue, up 13.73% from the same quarter last year.
Investors should also note any updates to analyst projections for Intuit. As evidenced by these latest revisions, the composition of short-term economic trends is constantly changing. Positive amendments in estimates, therefore, reflect analysts' increased confidence in the company's business achievement and profit possibilities.
Given the importance of valuation, investors should note Intuit's current Forward P/E ratio of 33.88. This valuation is higher than the industry average of 30.16.
Additionally, investors should know that INTU has a Price to Earnings (PEG) ratio of 2.27. Similar to the commonly used P/E ratio, this PEG ratio considers the anticipated growth in earnings for the company.
Let's see the further aspect of this stock from the INTU technical analysis:

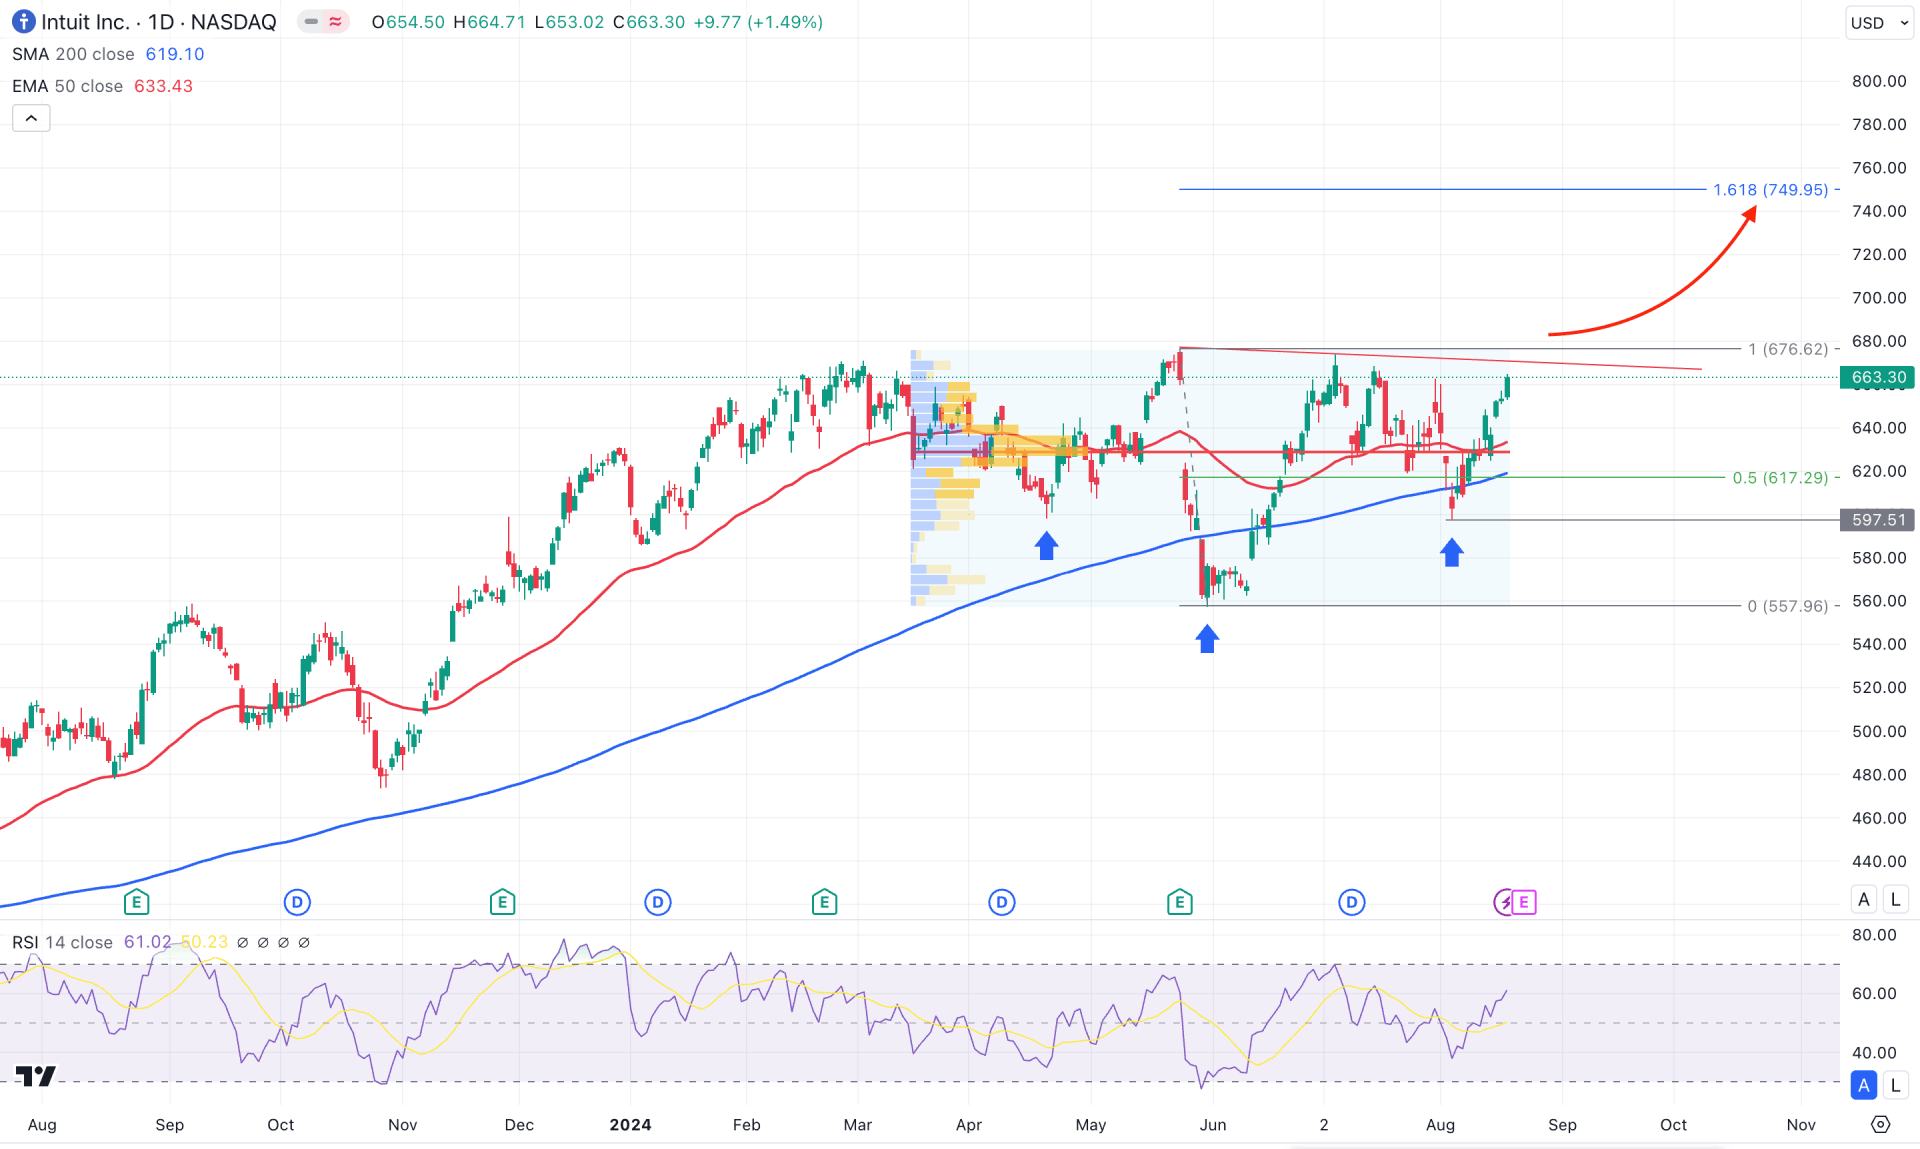
In the daily chart of INTU, the ongoing market momentum is corrective and backed by a stable bullish trend. Any bullish continuation opportunity could work well in this instrument, but it should come with a valid confirmation.
In the higher timeframe, the bullish engulfing pattern with a continuation formation is seen in the monthly chart, while the weekly price remains steady with a rally-base-rally formation. Depending on the daily chart's price action, investors might experience upward pressure.
In the volume structure, the highest activity level in the last 6 months is at the 628.97 level, below the current price. The ongoing bullish trend with support from the high volume line could be a decent bullish signal in this stock.
In the main chart, the 200-day simple moving average shows a strong bullish recovery, while the inverse Head and Shoulders pattern is visible. Moreover, the 50-day EMA is also below the current price, working as a confluence bullish signal.
Based on the daily market outlook of INTU, a valid bullish trendline breakout could validate the Inverse Head and Shoulder formation. In that case, a daily candle above the 676.32 high could be a valid long opportunity. On the bullish side, the price is more likely to find resistance from the 161.8% Fibonacci Extension level, which is at the 749.95 level.
On the bearish side, the price is still trading below the crucial trendline resistance. In that case, a bearish reversal candlestick formation from the 680.00 to 660.00 zone could open a bearish opportunity, aiming for the 559.96 low.

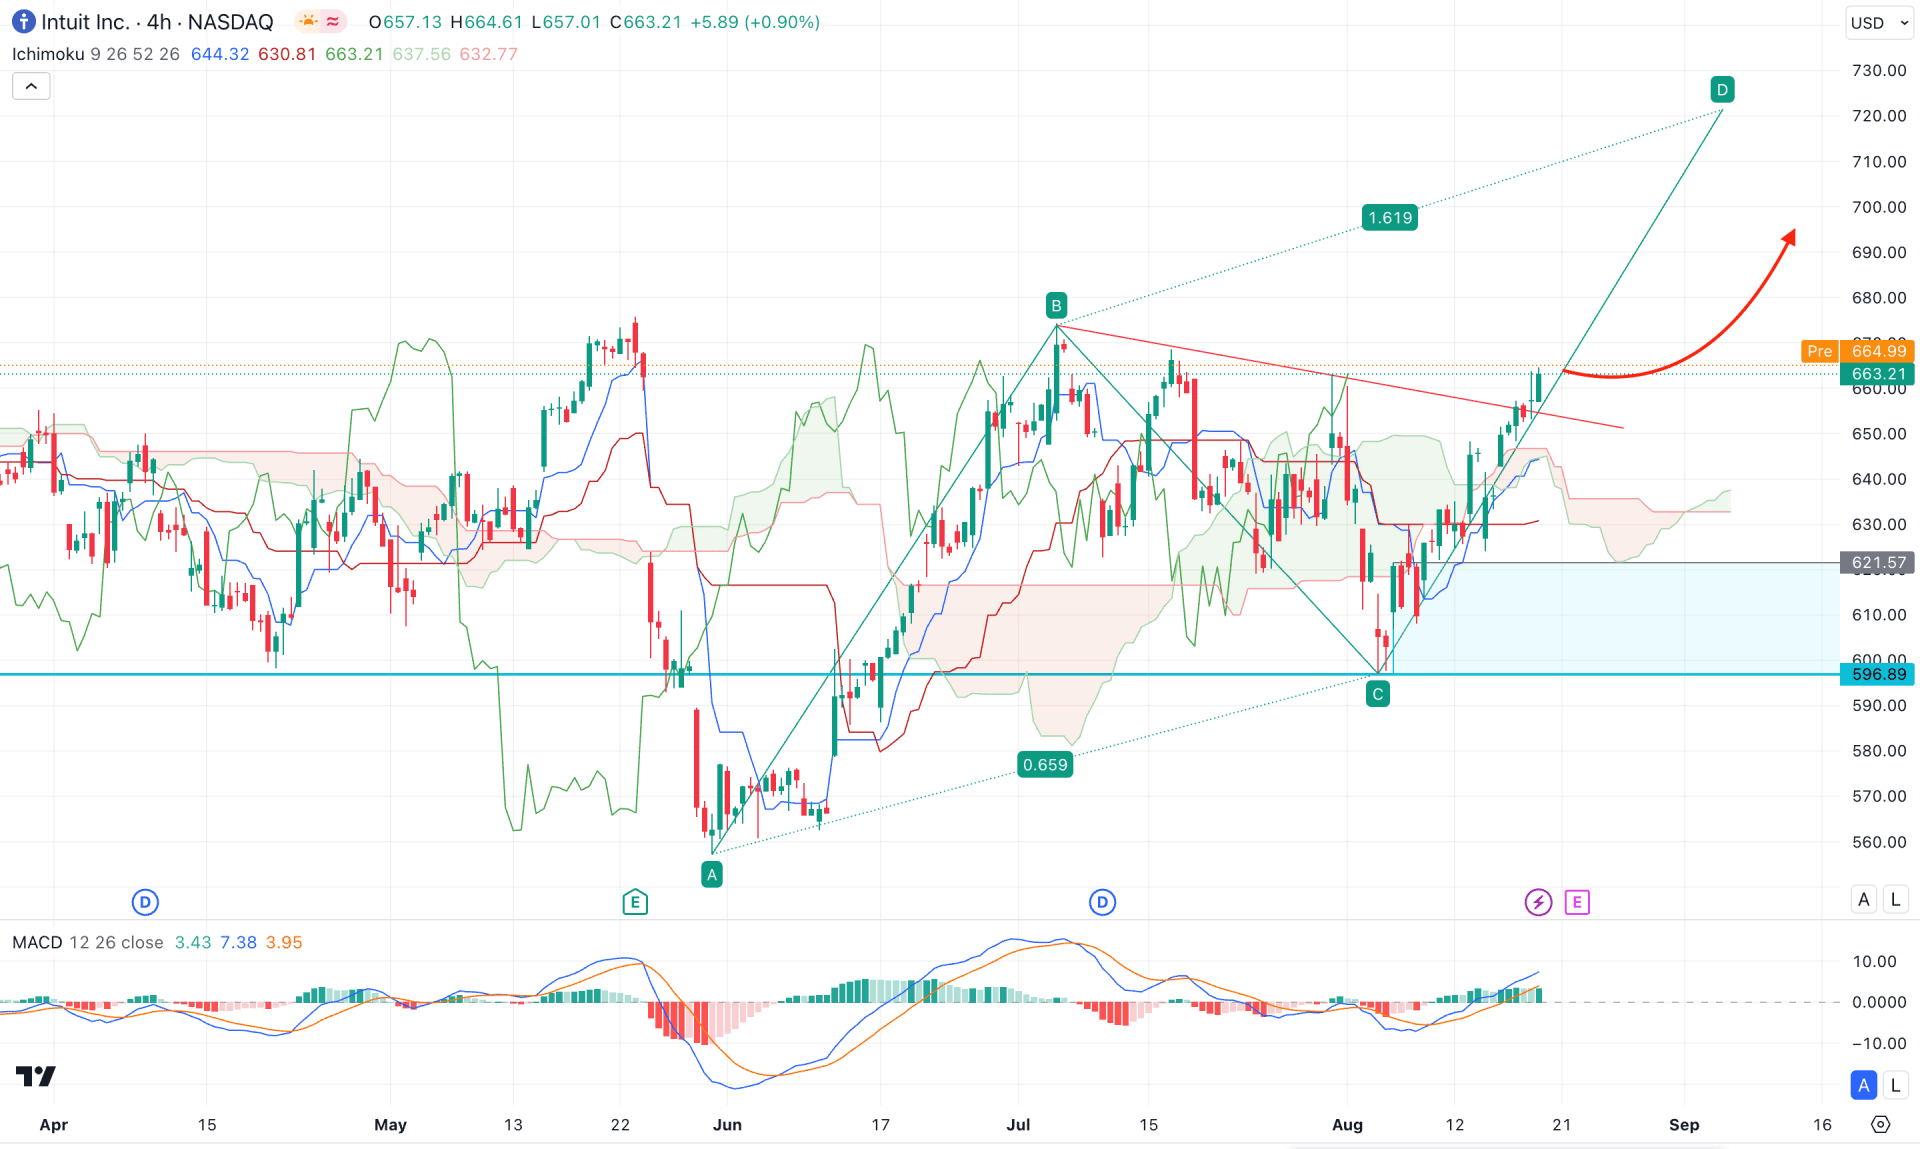
In the H4 timeframe, the most recent price trades bullish above the Ichimoku Kumo Cloud, suggesting a potential bullish continuation. Moreover, the current buying pressure is backed by a bearish reversal below the cloud zone with a V-shape recovery. In that case, any minor downside correction with a valid bullish reversal could be a potential long signal.
Moreover, the Future cloud looks positive to bulls where the Senkou Span A aimed above he Senkou Span B.
In the indicator window, the MACD Histogram remains positive for a considerable time, suggesting a stable momentum to bulls. Also, the ongoing buying pressure formed a valid rally-base-rally, where the near-term bottom is clear with a bullish order block.
Based on the H4 structure, the ongoing buying pressure is valid as long as the dynamic Kijun Sen is below the current price. In that case, the price is more likely to aim higher and complete the ABCD pattern at the 721.33 level.
On the bearish side, there is sufficient space left to form a bearish correction. In that case, the price might come lower towards the 621.00 area before forming another bullish signal. However, a break below the 596.89 low with a daily close could lower the price towards the 560.00 level.

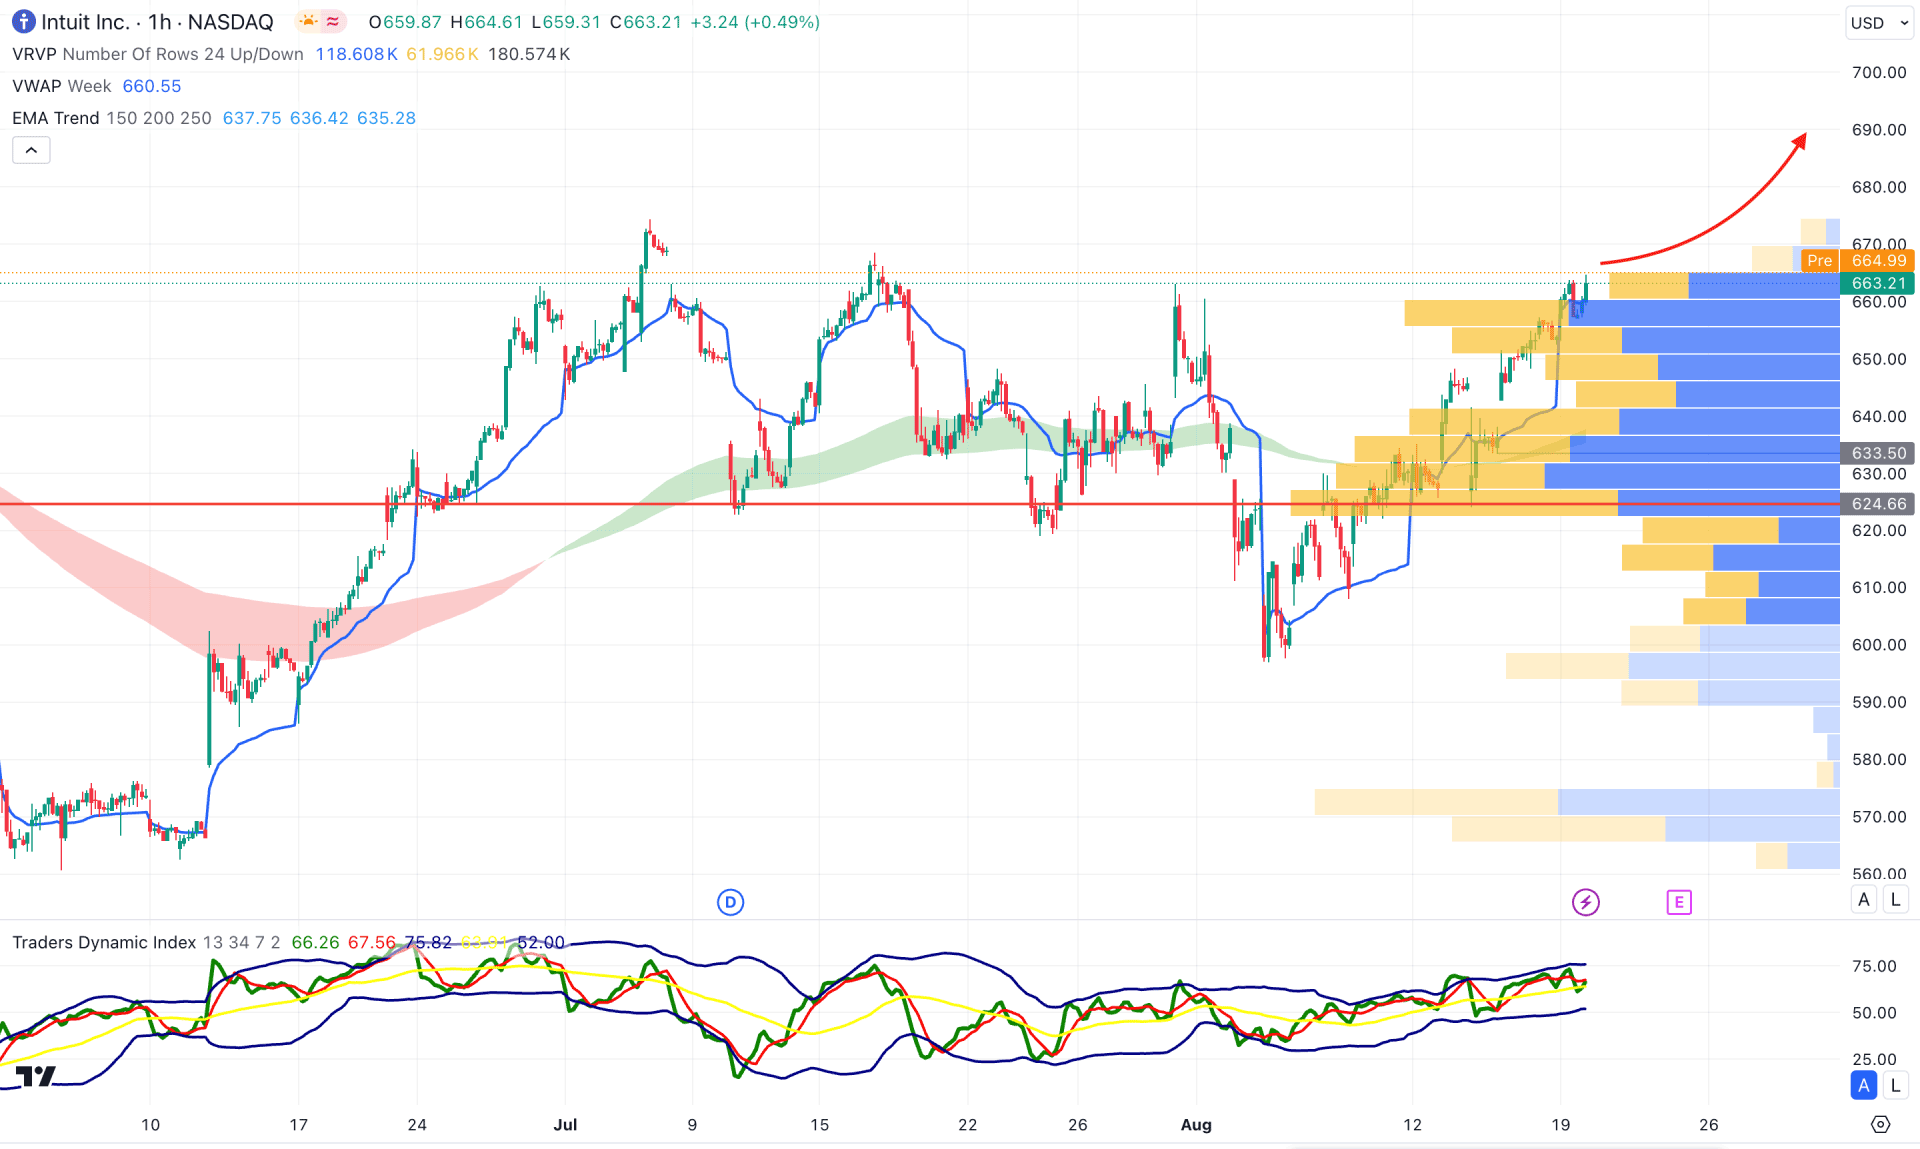
In the hourly timeframe, the current buying pressure is present, where the visible range high volume level is below the current price. The primary aim for this instrument would be to look for long trades as long as the current price hovers below the current price.
In the indicator window, the current Traders Dynamic Index (TDI) is above the 50.00 line, which indicates ongoing buying pressure.
Based on the hourly outlook, an upward continuation is potent as the current price hovers above the Moving Average wave. On the bullish side, a valid buying pressure from the weekly VWAP could be an intraday bullish signal in this instrument. However, an immediate bearish reversal with an hourly candle below the 624.66 high volume level could lower the price toward the 580.00 area.
Based on the ongoing market momentum, the INTU is more likely to extend the buying pressure after validating the Inverse Head and Shoulders Pattern. In that case, investors should closely monitor how the price closes above the trendline resistance before aiming for a conservative long approach.