
Published: August 14th, 2025
The NZDUSD pair retreated from the psychological 0.6000 mark, having reached a two-week high the day before, and encountered rejection near the 50-day EMA.
One of the main factors pushing the NZDUSD pair lower is the US Dollar Index (DXY), which measures the Greenback over an assortment of currencies. It has recovered somewhat from its lowest point in more than two weeks.
Meanwhile, the rising consensus that the US Federal Reserve (Fed) would reduce borrowing expenses in September may prevent aggressive bets by USD bulls and provide some support for the NZDUSD pair. Additionally, after the dismal publication of the July American Nonfarm Payrolls (NFP) and consistent US consumer inflation numbers, traders increased the odds for a minimum of two Fed rate reductions before the end of the year.
Additionally, the positive market sentiment, supported by an additional three months of the US-China economic truce and the US-Russia conference to resolve the conflict in Ukraine, could limit declines for the risk-averse Kiwi and restrict the safe-haven buck. Therefore, it would be wise to hold off on positioning for any more intraday weakening movement for the NZDUSD pair unless there is strong follow-through purchasing.
Let's see the complete price outlook of this pair from the NZDUSD technical analysis:

In the daily chart of NZDUSD, the broader market outlook has been positive since the liquidity sweep in April 2025. However, the price has formed a solid bottom, followed by visible consolidation. As the most recent price action is moving within a descending channel, investors should wait for further confirmation before anticipating a bullish trend continuation.
In terms of volume, the price is trading within a consolidation area, with the largest activity level since October 2024 being close to the current price. Since the high-volume line is hovering near the current price, a strong breakout is needed before anticipating the future price direction.
On the main price chart, a sideways market structure is evident, as the price is fluctuating between the 50-day exponential moving average (EMA) and the 200-day simple moving average (SMA). The long-term outlook remains bullish since the 200-day SMA is below the current price with an upward slope. However, a drop below the 50-day SMA would signal a possible pending correction before offering a long entry opportunity.
In the secondary indicator window, sideways momentum is also visible as the Relative Strength Index (RSI) hovers around the 50.00 neutral zone.
Based on this structure, investors should closely monitor how the price reacts within the descending channel. If the ongoing downside pressure from the channel resistance results in a daily close below the 0.5915 level, it could present a potential short opportunity targeting the 0.5762 level.
On the other hand, a buy-side liquidity sweep from the channel resistance is also possible, which might create another short opportunity from the 0.6000–0.6061 zone. However, a daily close above the 0.6061 level would invalidate the bearish scenario. In that case, the price may find a bullish rally-base-rally breakout, with the ultimate target being the 0.6379 resistance level.
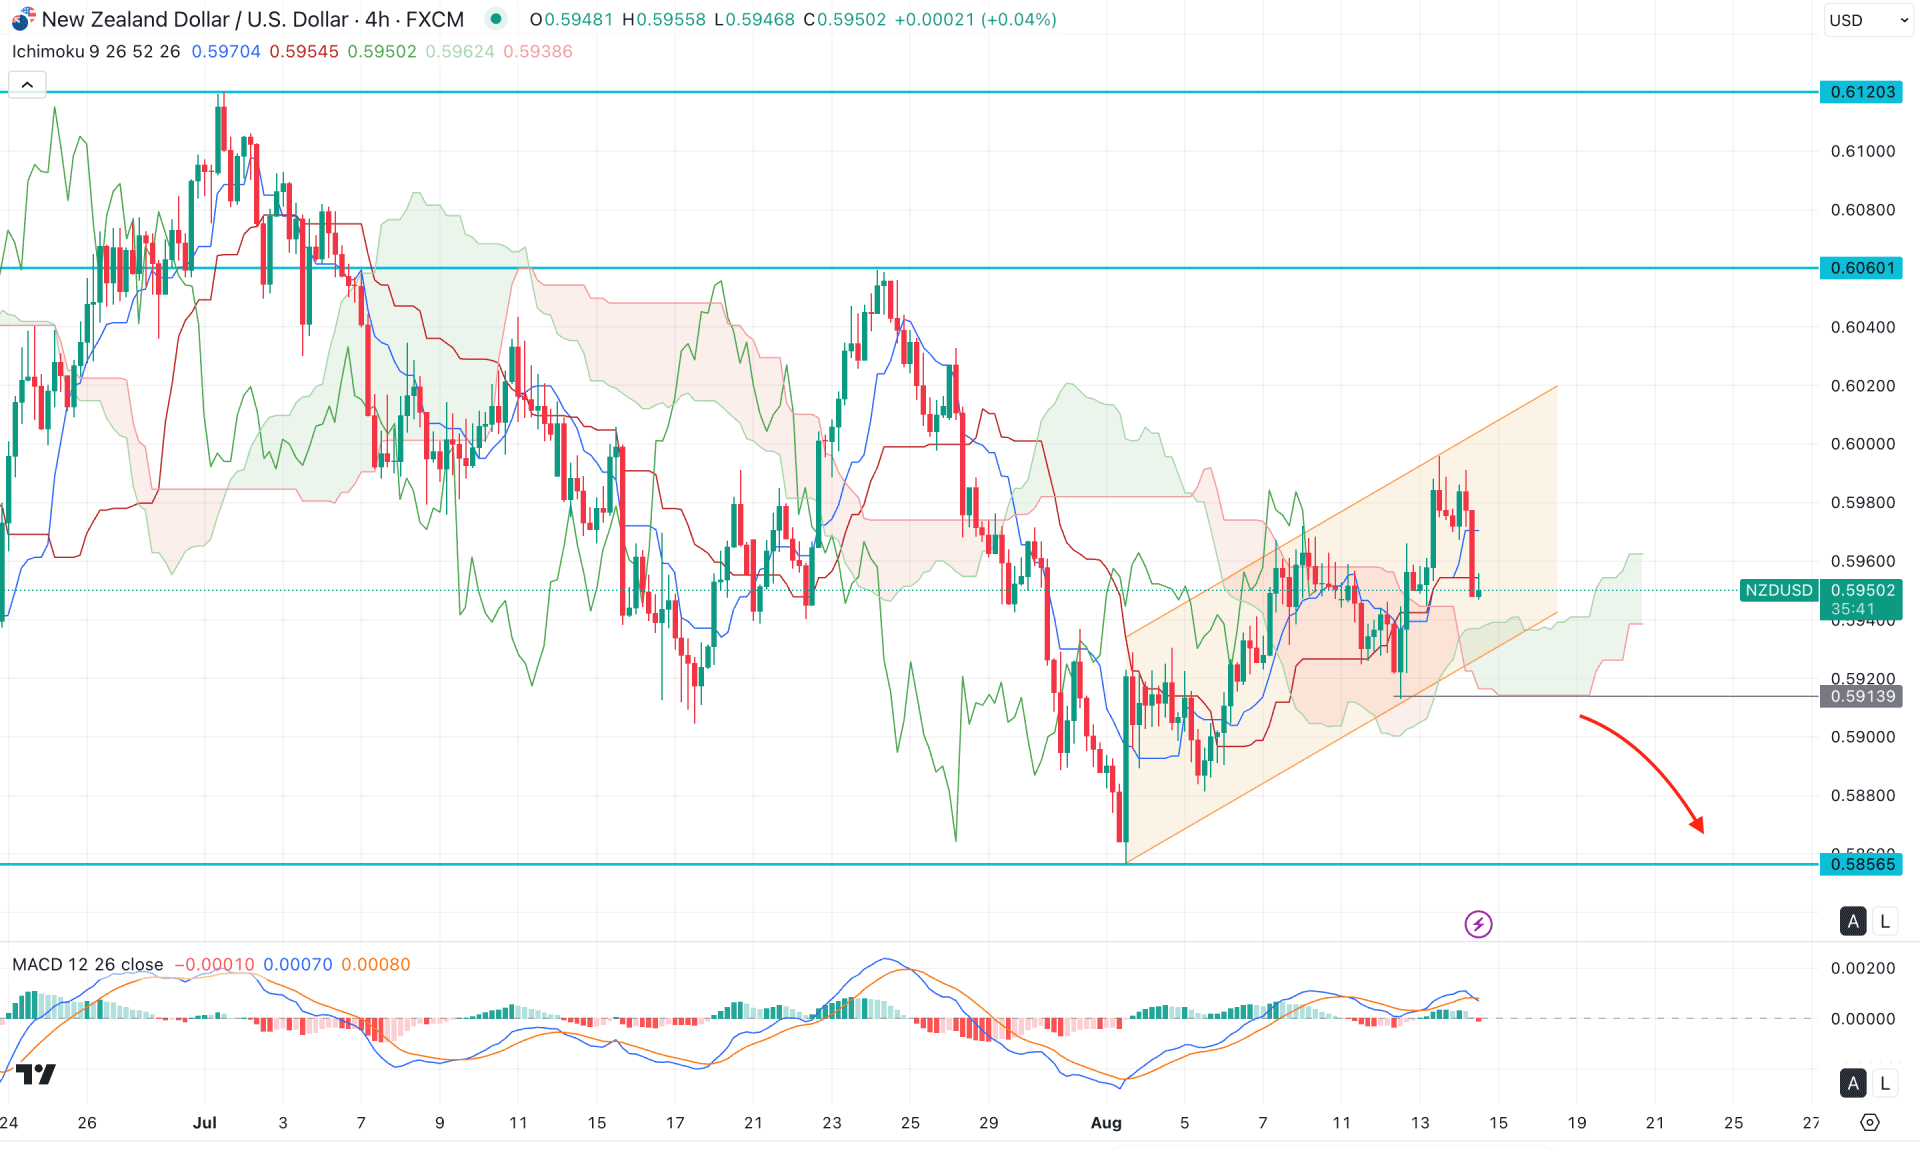
In the H4 timeframe, the recent price is trading above the Ichimoku Kumo cloud with corrective buying pressure. However, the most recent candle has formed a bearish engulfing pattern below the dynamic line, suggesting a barrier to bullish continuation.
In the future cloud, both Senkou Span lines are aiming higher, indicating a bullish trend. However, the MACD indicator shows a different story. According to the MACD signal line, the latest swing failed to create a new high and has formed a bearish crossover. Moreover, the histogram failed to maintain momentum above the neutral line and printed a red bar after seven consecutive bullish bars.
Based on the H4 market outlook, the price is still trading above the Kumo cloud, but the sideways momentum at this zone signals limited buying pressure. In that case, a bearish breakout below the channel support, with a four-hour candle closing below the 0.5913 level, could open a short opportunity targeting the 0.5856 level.
On the other hand, a failure to break below the cloud zone could extend the range, and the price might find a new resistance above the 0.6000 level.

In the hourly timeframe, an intraday selling pressure is visible where the current price is trading below the intraday high volume line. Moreover, the Moving Average wave is above the current price, working as an immediate resistance. However, investors should monitor how the price holds the selling pressure below the intraday high volume line, as it could initiate a bearish continuation opportunity.
In the secondary indicator window, the Traders Dynamic Index (TDI) has reached the lower Band area, suggesting an extreme selling pressure in the market.
Based on the overall market structure, an intraday bearish pressure is potent, and investors might expect a bearish continuation soon. However, a failure to hold the price below the 0.5960 level could be an alarming sign to bears. In that case, the price will extend the corrective upward pressure and visit the 0.6000 psychological level soon.
Considering the overall market structure, the sideways momentum in the daily channel is still valid, and the price is likely to extend the bearish pressure as a range extension. However, the intraday price is strongly bearish, from where a valid bottom formation could signal an early long opportunity.


