
Published: January 20th, 2026
Interactive Brokers Stock (IBKR) is expected to have respectable top- and bottom-line improvement in the upcoming quarter. This can be linked to increased customer activity and ongoing significant market volatility. The $1.49 billion Analysts' Consensus Prediction for sales indicates a 4.3% increase from the previous year.
In the fourth quarter, both client engagement and market fluctuations were strong. The longest government closure in US history, a decline in consumer morale, loosening monetary policy, and a predominant AI theme all contributed to this. This is anticipated to have boosted Interactive Brokers' commission revenues, combined with strong DART figures across the quarter's three months compared to the previous year. The analysts' consensus estimate for compensation revenues is $536 million, a 12.6% increase over the previous year.
As IBKR makes significant investments to strengthen platform capabilities and expand its regulatory and compliance responsibilities, overall operating expenses are likely to increase.
Let's see the complete multi-timeframe technical analysis of IBKR:
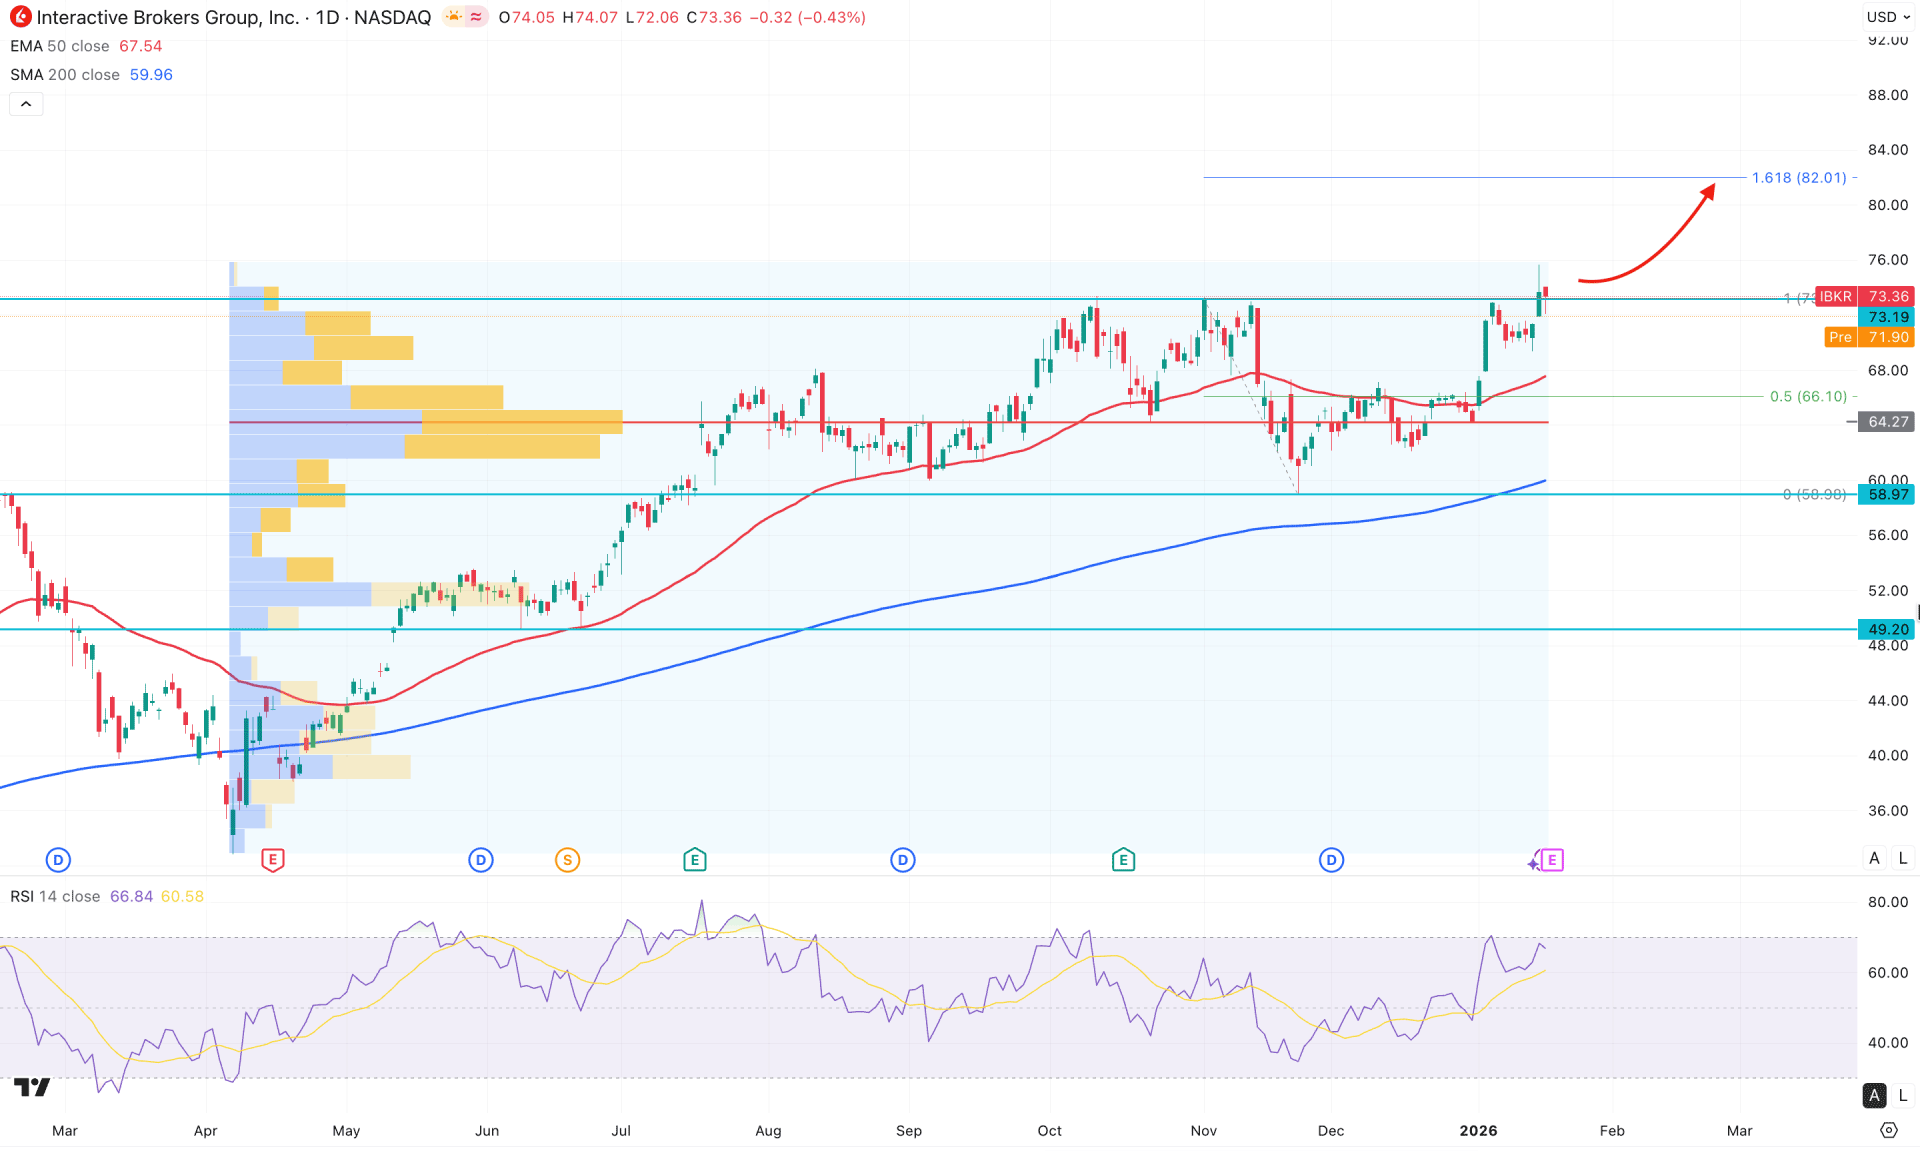
On the daily chart of Interactive Brokers stock (IBKR), the broader market momentum remains bullish, with no sign of a corrective recovery from the record high. The upcoming earnings report will be a key catalyst to monitor, as a positive outcome could push prices even higher.
On the monthly timeframe, an inside-bar breakout has driven the price to a new all-time high. The current candlestick structure suggests strong bullish continuation momentum, indicating that another upside expansion is possible.
The weekly timeframe shows a similar structure, with the most recent price action rebounding higher after testing a near-term order block.
From a volume perspective, the most active level since April 2025 is located at 64.27, which remains below the current price and within the broader range structure. This suggests that the recent breakout occurred in an environment of institutional participation, which could act as a confluence factor supporting further upside.
On the main chart, the most recent price action shows a bullish cup-and-handle breakout, rebounding from the 50-day Exponential Moving Average. Meanwhile, the 200-day Simple Moving Average is sloping upward from below, confirming a constructive long-term trend.
In the indicator window, the Relative Strength Index (RSI) is hovering around the 70.01 level, indicating an extremely bullish market condition.
Based on this overall market structure, the primary objective is to anticipate a bullish continuation, with the potential to test the 82.01 Fibonacci Extension level. Moreover, consolidation above the 50-day EMA could extend the buying pressure, with an extended target near the 100.00 psychological level.
Alternatively, a daily close below the 64.27 high-volume level would signal a bearish scenario. In that case, the price could retrace lower and test the 200-day SMA before presenting another long opportunity. A sustained decline below 60.00 would invalidate the bullish structure and open the door for a deeper pullback toward the 49.20 support level.
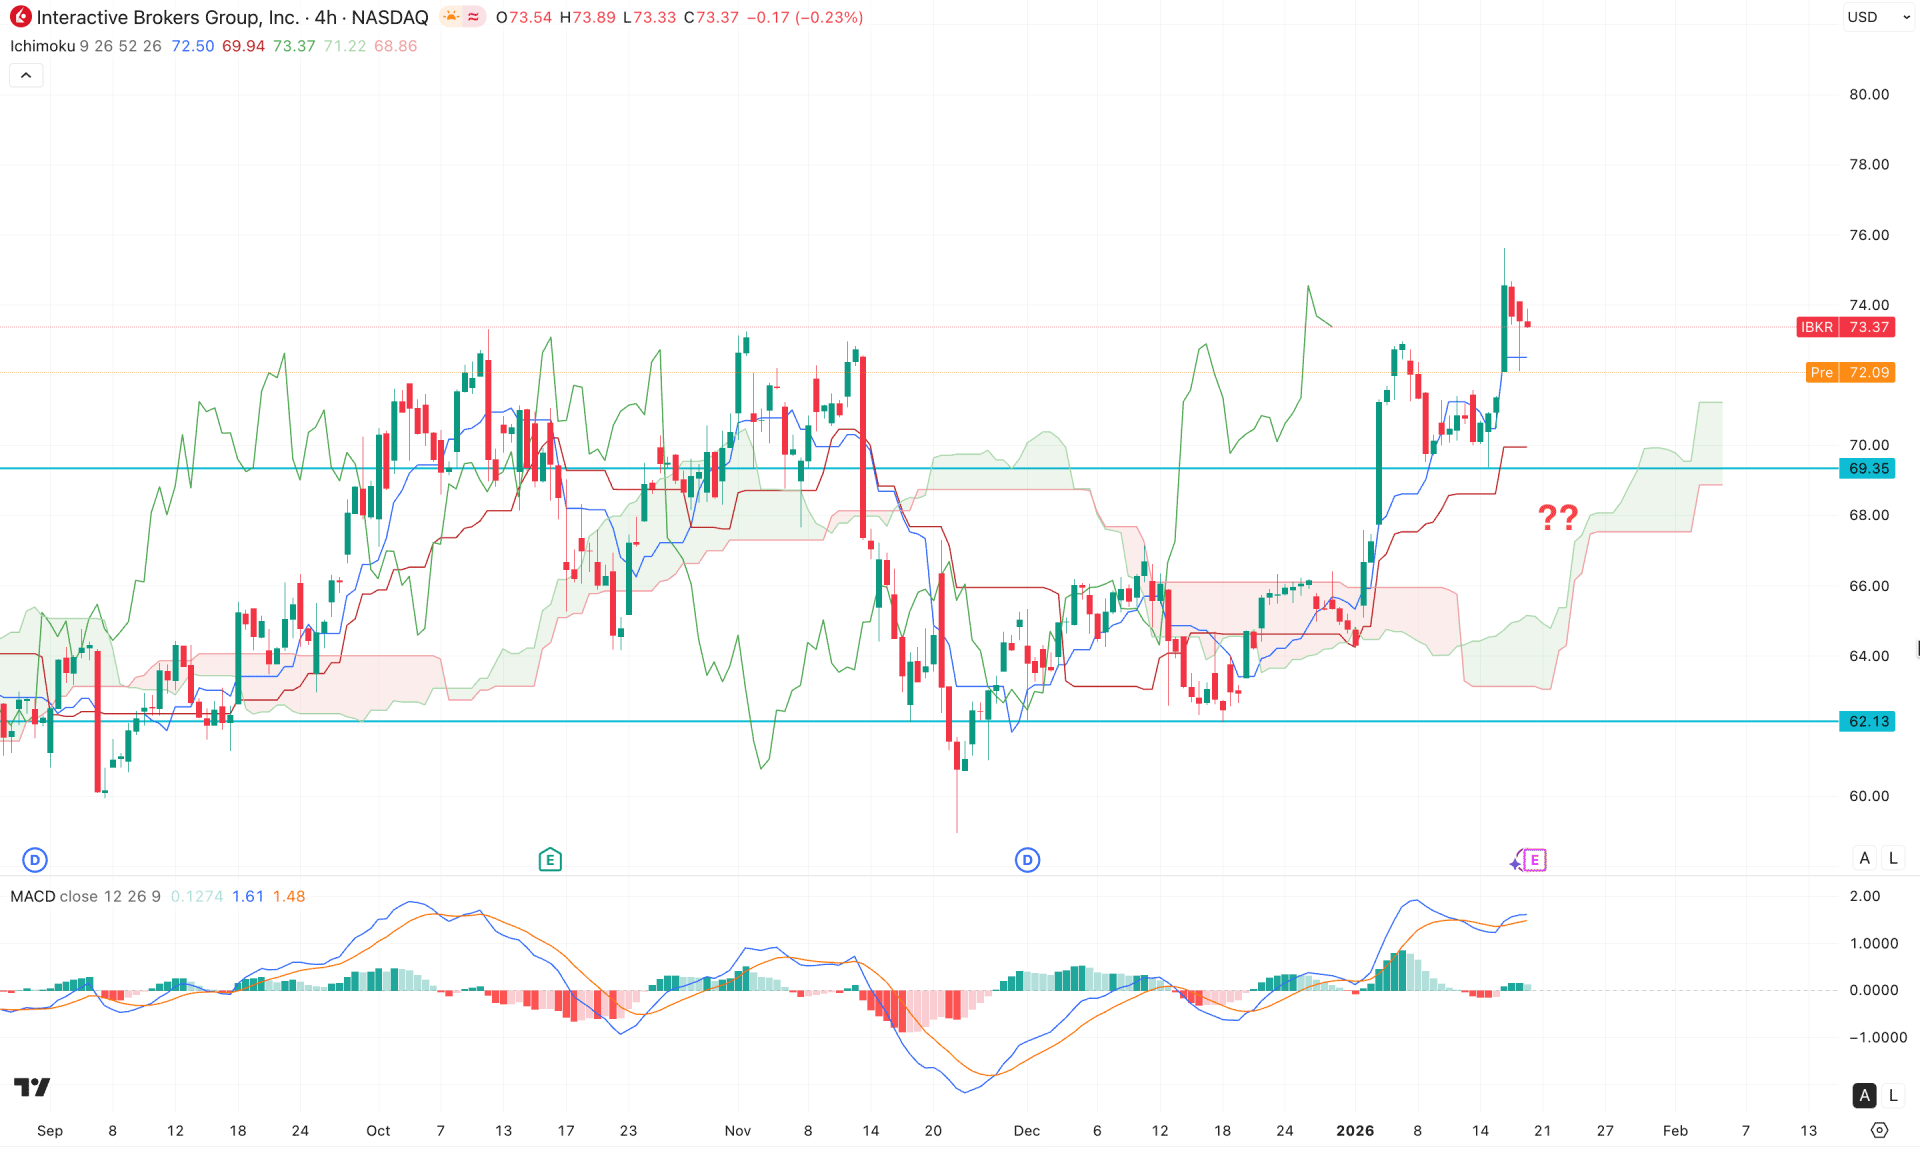
In the H4 chart of Interactive Brokers stock, a stable price structure is visible above the Kumo area, suggesting bullish momentum. Moreover, the future cloud outlook appears positive, as both leading lines are trending upward.
In the indicator window, the MACD signal line is hovering near the upper peak area, which signals an extremely bullish condition. However, the histogram has compressed toward the neutral zone, leaving room for further upside movement.
Based on this outlook, the extreme bullish condition is not fully justified, as the MACD signal line is still indicating neutral market momentum. Primarily, a bearish histogram with an H4 close below the Kijun Sen level could offer a short-term selling opportunity, targeting the cloud support area.
On the other hand, failure to break below the 69.35 level, followed by an immediate bullish candle, could help resume the existing upward trend.
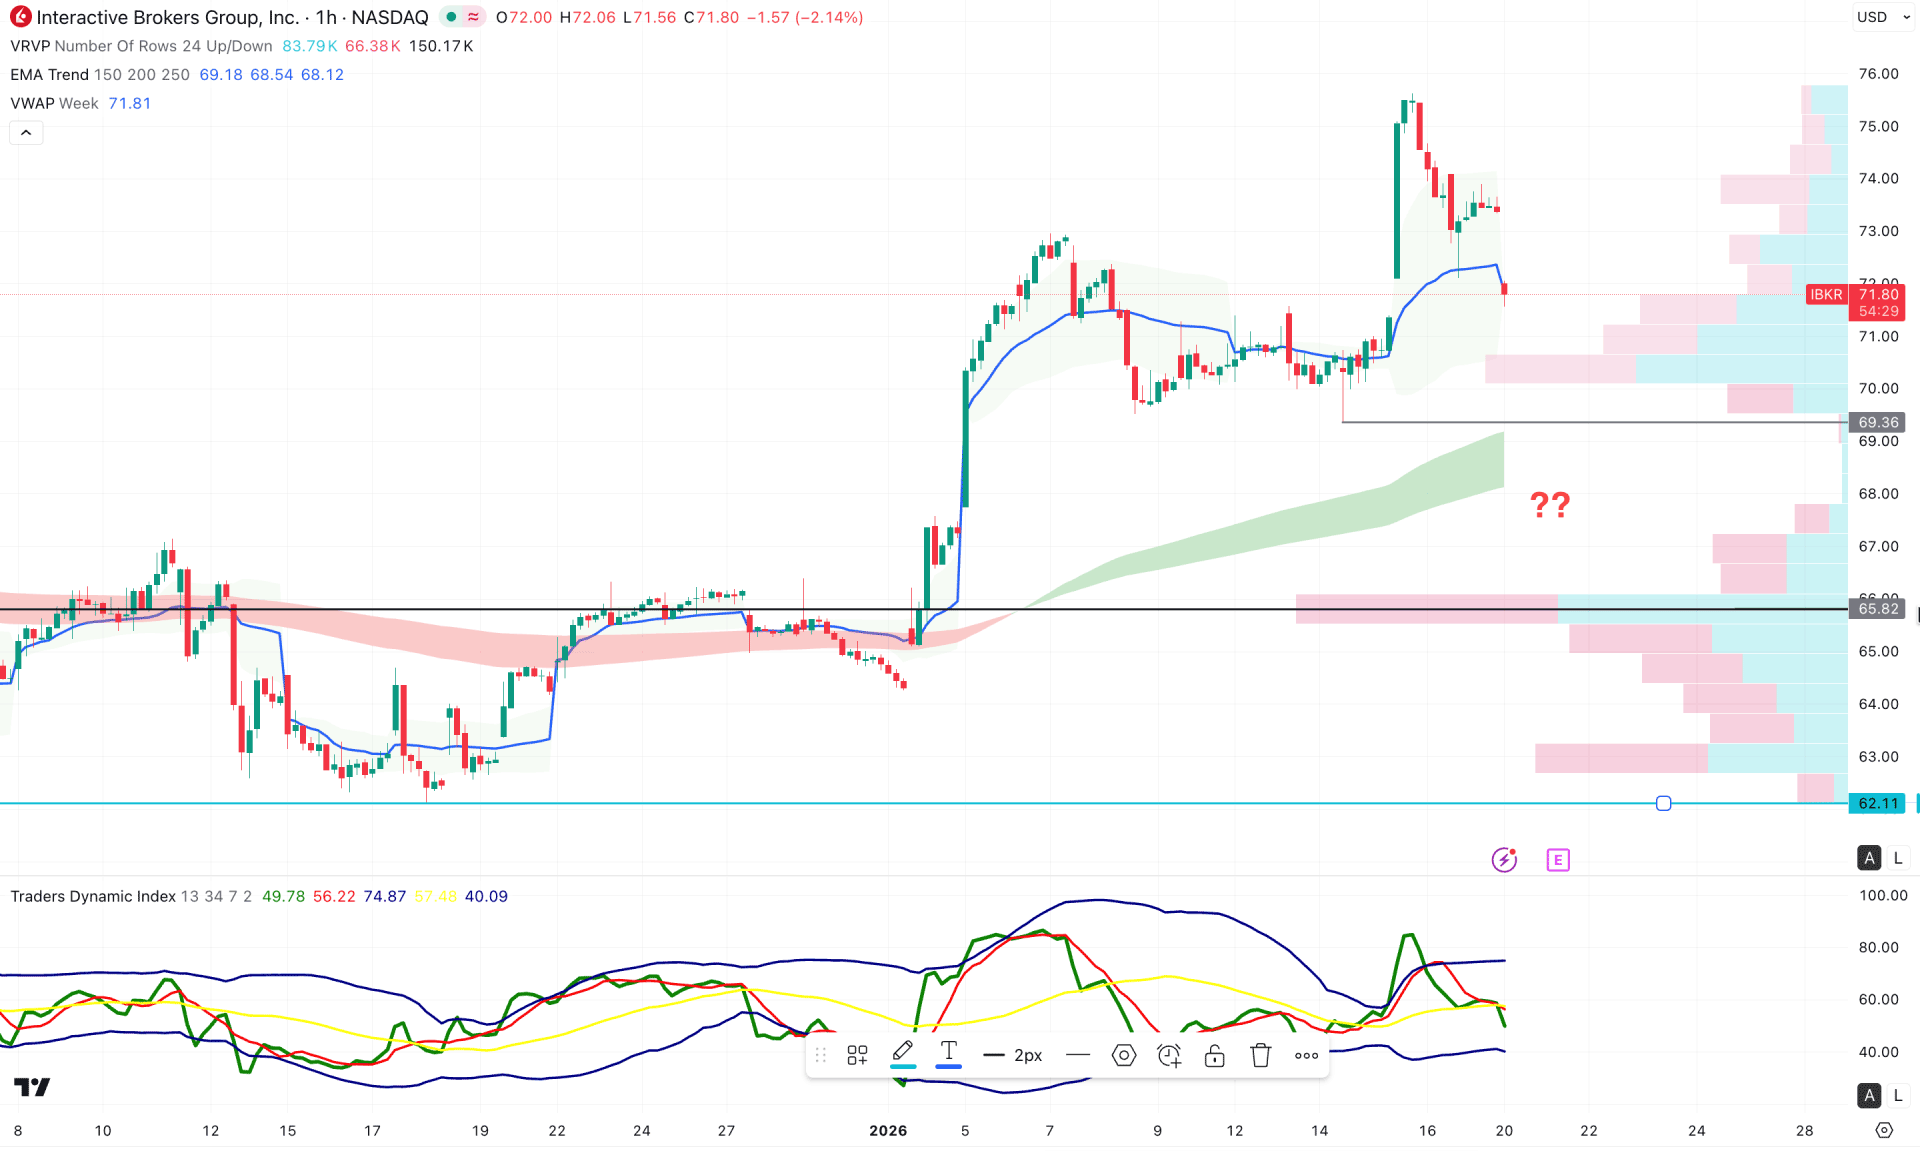
In the hourly timeframe, IBKR price is trading above the dynamic VWAP line, suggesting an ongoing buying pressure. Moreover, the dynamic EMA wave is below the current price, supporting the buying pressure.
In the secondary window, a potential divergence is visible with a signal of a top formation. Moreover, the latest TDI line has flipped below the 50.00 neutral line, signalling a bearish presence in the market.
Based on the hourly structure, the price is struggling to hold the buying pressure at the top. In that case, a minor downside correction could come from the point at which bulls could re-enter the market.
On the other hand, extended selling pressure with the price stable below the 65.82 level might push it even lower in the coming hours.
Overall, IBKR market momentum is bullish as no sign of a top formation in the higher time frame. As the major market momentum is bullish, investors should closely monitor the intraday chart as a valid rebound from a discounted zone could be a trend trading signal.


