Published: November 1st, 2022
Intel Corporation INTC published mixed Q3 results in 2022, while the top line missed analysts' estimates. Both earnings and revenues fell year over year, challenging the macroeconomic environment and decreasing demand.
The company published a GAAP profit of 25 cents per share or net income of $1,019 million in Q3 compared with $1.67 per share or $6,823 million in Q3 2021.
The major fall occurred due to a rapid, sudden decreasing economic activity and demand slowdown that resulted in top-line deflationary. Moreover, the Non-GAAP earnings in Q3 came at 59 cents per share or $2,432 million compared with $1.45 per share or $5,908 million in Q3 2021.
During the earnings report, management disclosed that Intel had long-term debt of $37,240 million cash equivalents and cash of $4,529 million as of 30 Sep 2022. The company made cash of $7,730 million from the first nine months of operations of 2022 compared with the prior-year period of $24,053 million.
Intel expects non-GAAP revenues to be $14-$15 billion in Q4 2022. Non-GAAP gross margin can be 45%. Expected Non-GAAP earnings of approx. 20 cents per share.
Let’s see the future price of Intel Corporation from the Intel Stock (INTC) Technical analysis:

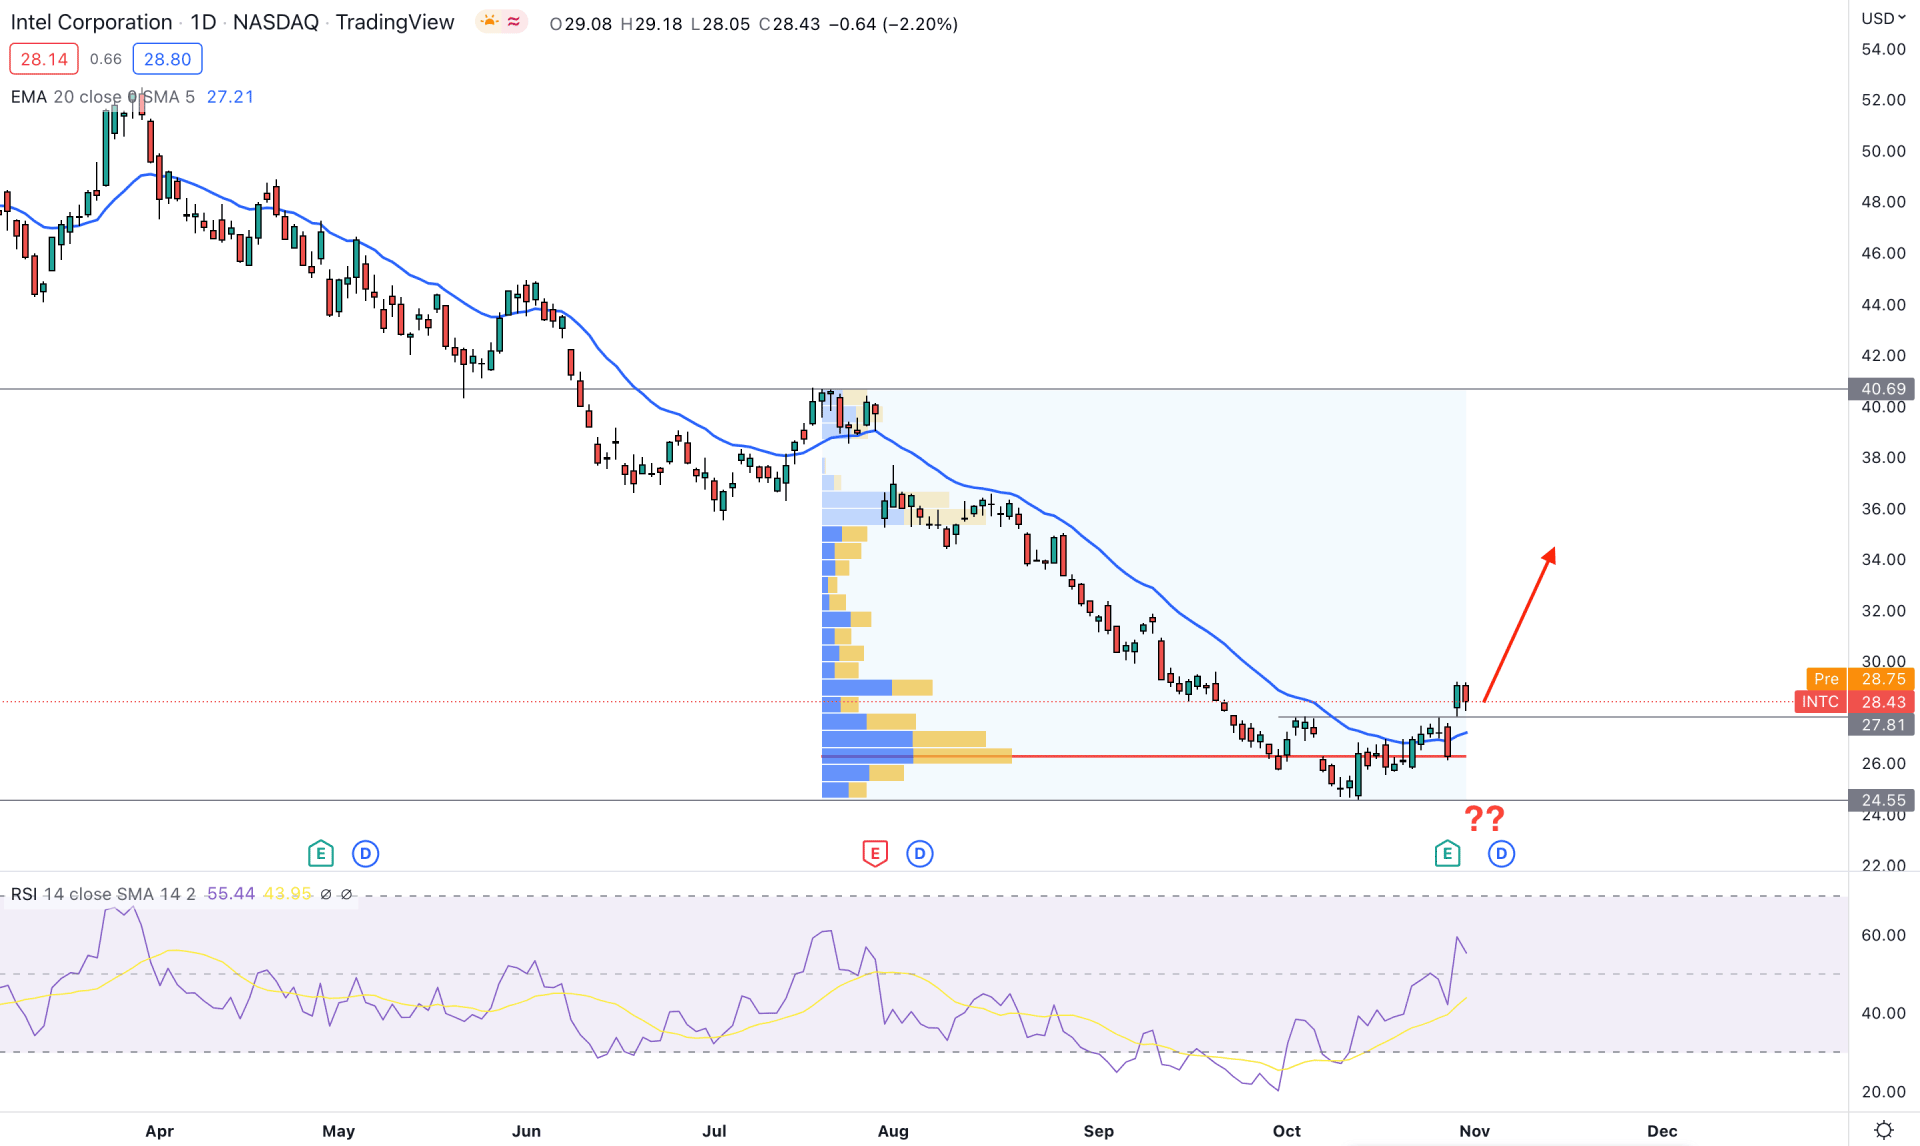
Intel Stock (INTC) showed a massive discount in the broader context, where the current stock price is trading 46% down from the yearly opening. However, the deep discount with the future potentiality would be a good combination to buy this stock. In that case, it is crucial to identify whether the price made a bottom.
In the most recent chart, buying pressure appeared in this instrument after the Q3 earnings report. Moreover, the bullish pressure is backed by a strong change in volume. As per the fixed range high volume indicator, the highest trading volume from July 2022 swing high to October 2022 swing slow is shifted to the 26.27 level, which is below the current price. It is a sign that bulls in this area are active and ready to take this price higher with a higher volume.
Besides, there is buying pressure from the 20 DMA indicator as the price made a bullish breakout for the first time in the last three months. The Relative Strength Index (RSI) is also towards the buyers’ side, while the current RSI level is above the neutral area.
Based on the daily outlook of INTC, a buying possibility is valid as long as the price trades above the high volume 26.27 level. In that case, the primary target level would be 36.00 level, before approaching the 40.69 area.
On the other hand, the bearish possibility will be potential if the daily candle closes below the 24.55 level. In that case, the primary target would be to reach the 20.00 psychological number.

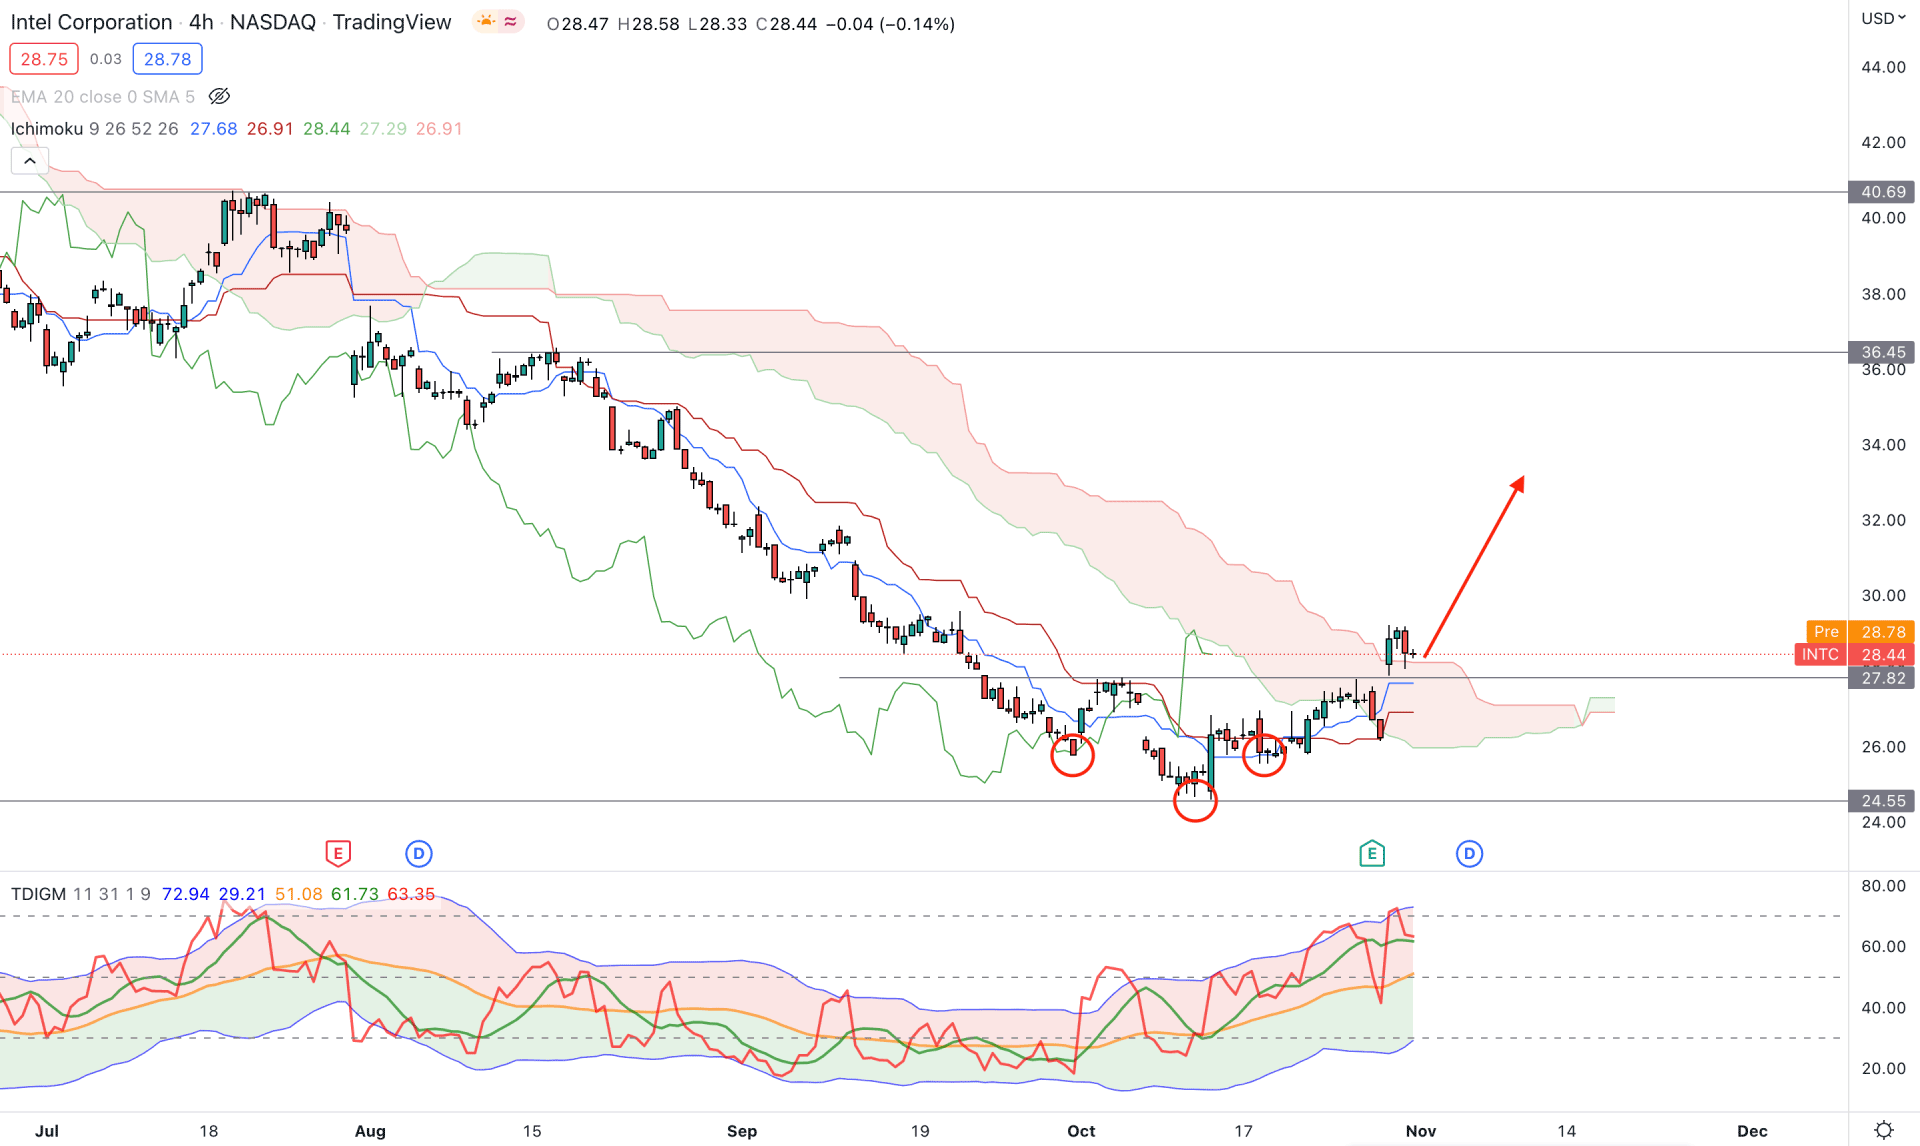
In the H4 timeframe, the price moved to the buyers’ zone for the first time since August 2022. Moreover, the buying pressure is backed by an Inverse Head and Shoulders formation and a neckline breakout.
In the future cloud, the Senkou Span A shifted its direction above the Senkou Span B, while the Lagging Span is above the price on that level. Meanwhile, the dynamic Tenkan Sen is above the Kijun Sen, while both of these lines are below the price.
In the indicator window, the Traders Dynamic Index is above the 50% zone, which is a sign of a buyer's presence in the market.
Based on the H4 price structure, the upside possibility is solid if the price shows any bullish rejection from the 26.00 to 27.80 area. In that case, an H4 close above the Tenkan Sen line would validate the buying possibility, targeting the 36.45 level.
The alternative trading approach is to find the price below the 24.65 level, which could extend the current selling pressure towards the 20.00 area.

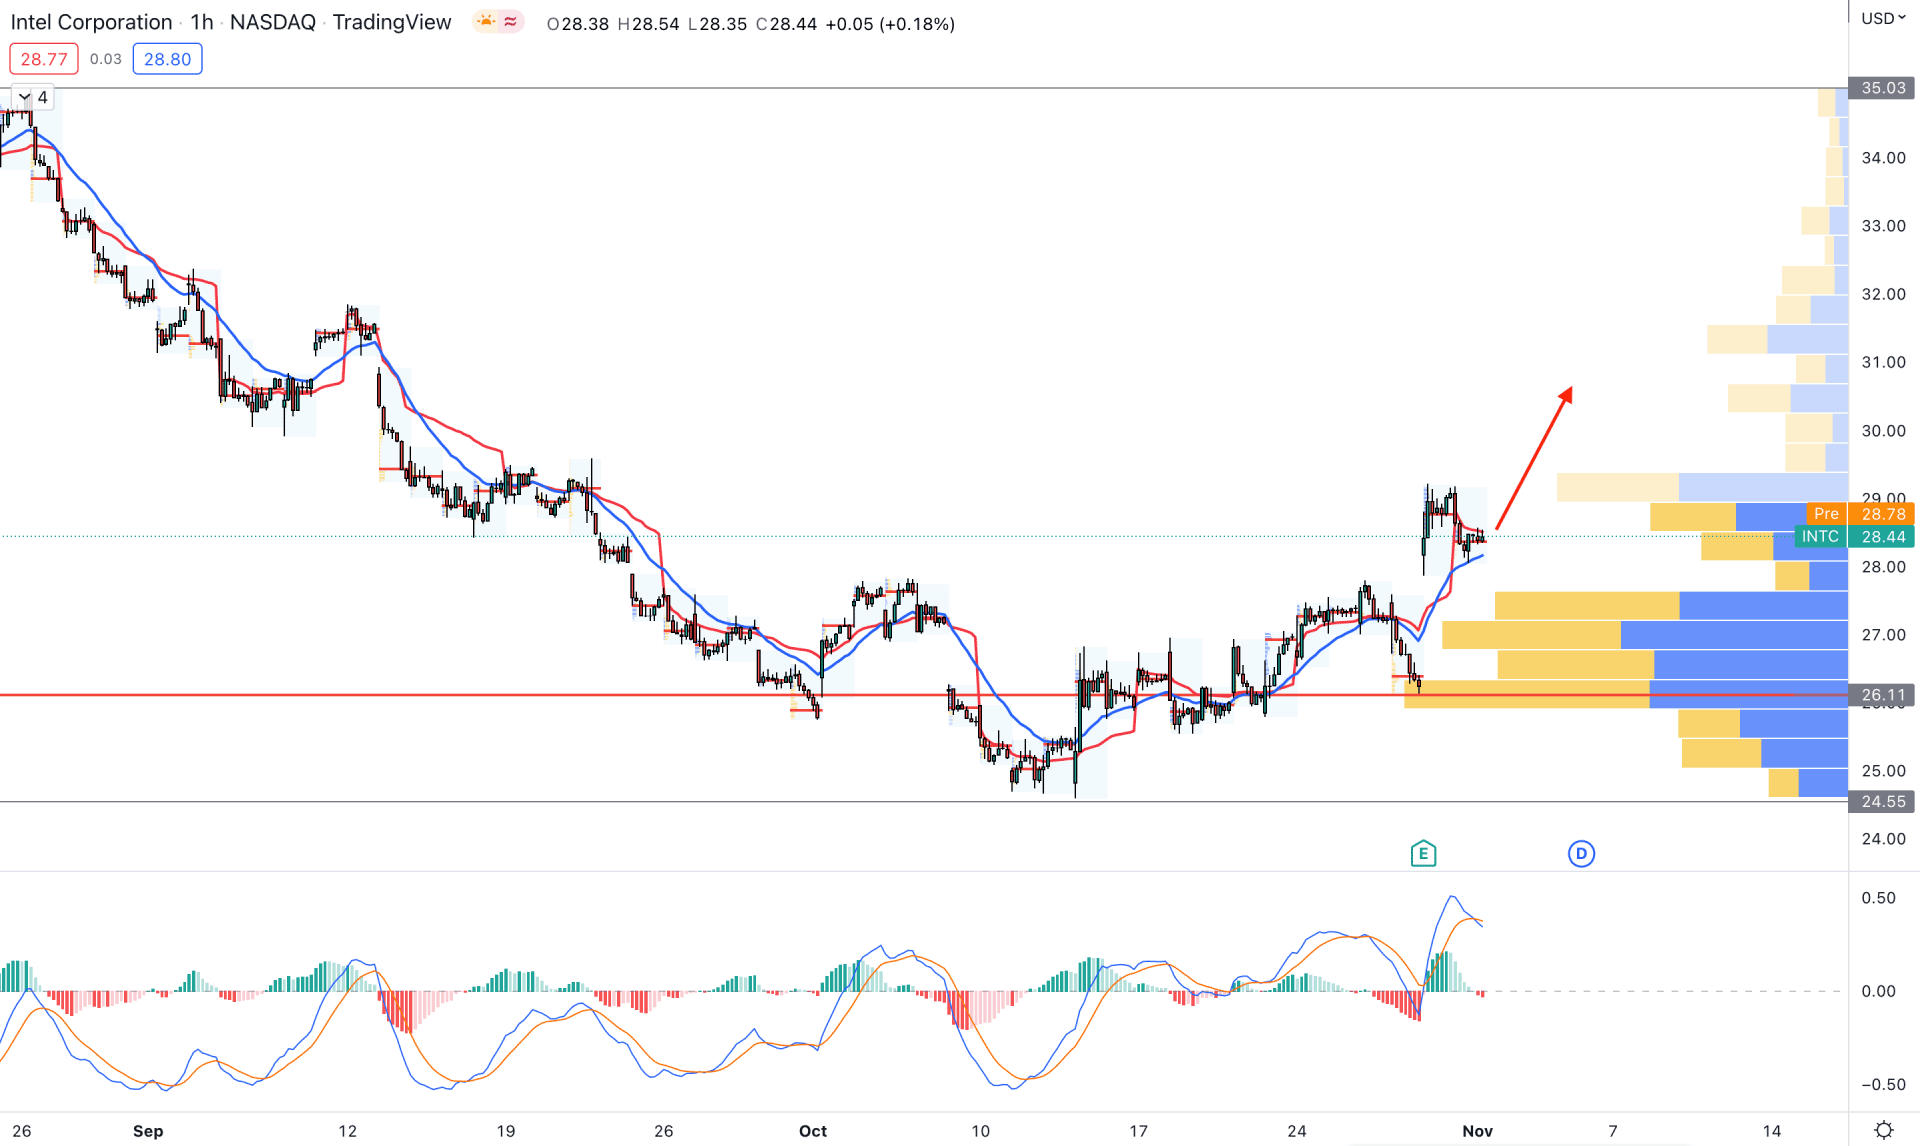
In the INTC H1 chart, bulls formed a U-shape recovery, where the recent price made a new higher high above the 28.00 level. The dynamic 20 EMA and weekly VWAP are below the current price, acting as a support level.
The visible range high volume indicator shows the highest volume level at 26.11 level, which is below the current price. The MACD Histogram is corrective at the neutral level, while MACD EMA’s formed a bearish crossover.
Based on the H1 outlook, a bullish trend continuation opportunity is valid in this instrument, where the ultimate target is the 35.05 level. However, breaking below the 26.00 level might alter the current market structure and extend the selling pressure.
Based on the current price behavior, Intel stock is more likely to show buying pressure in the coming days. However, investors should monitor the macro structure before considering the upside possibility valid.