Published: June 1st, 2022
Intel has underperformed its competitors like AMD and Nvidia in the last couple of years. However, the Intel stock is still 21% up over the previous five years. While Intel is underperforming, its peers somehow surprise the market with the business growth, both in R&D and capital expenditure.
Intel's research and development costs are three times higher than NVIDIA and five times higher than AMD. However, most of the research expense in Intel is on its growing production capabilities, which do not seem to be working as expected. In that case, investors should monitor how Intel manages its research and development expenses meaningfully to get rid of non-productive and underperforming areas.
Although Intel stock moved down following the recent increase in inflation, last week's weaker inflation result might relieve the stock market. On the other hand, semiconductor demand is increasing as people's lives are digitized daily. In that case, Intel stock would be a promising investment opportunity in the long run, but close attention to the near-term swing level is needed. Let’s see the future price direction from the Intel stock technical analysis.
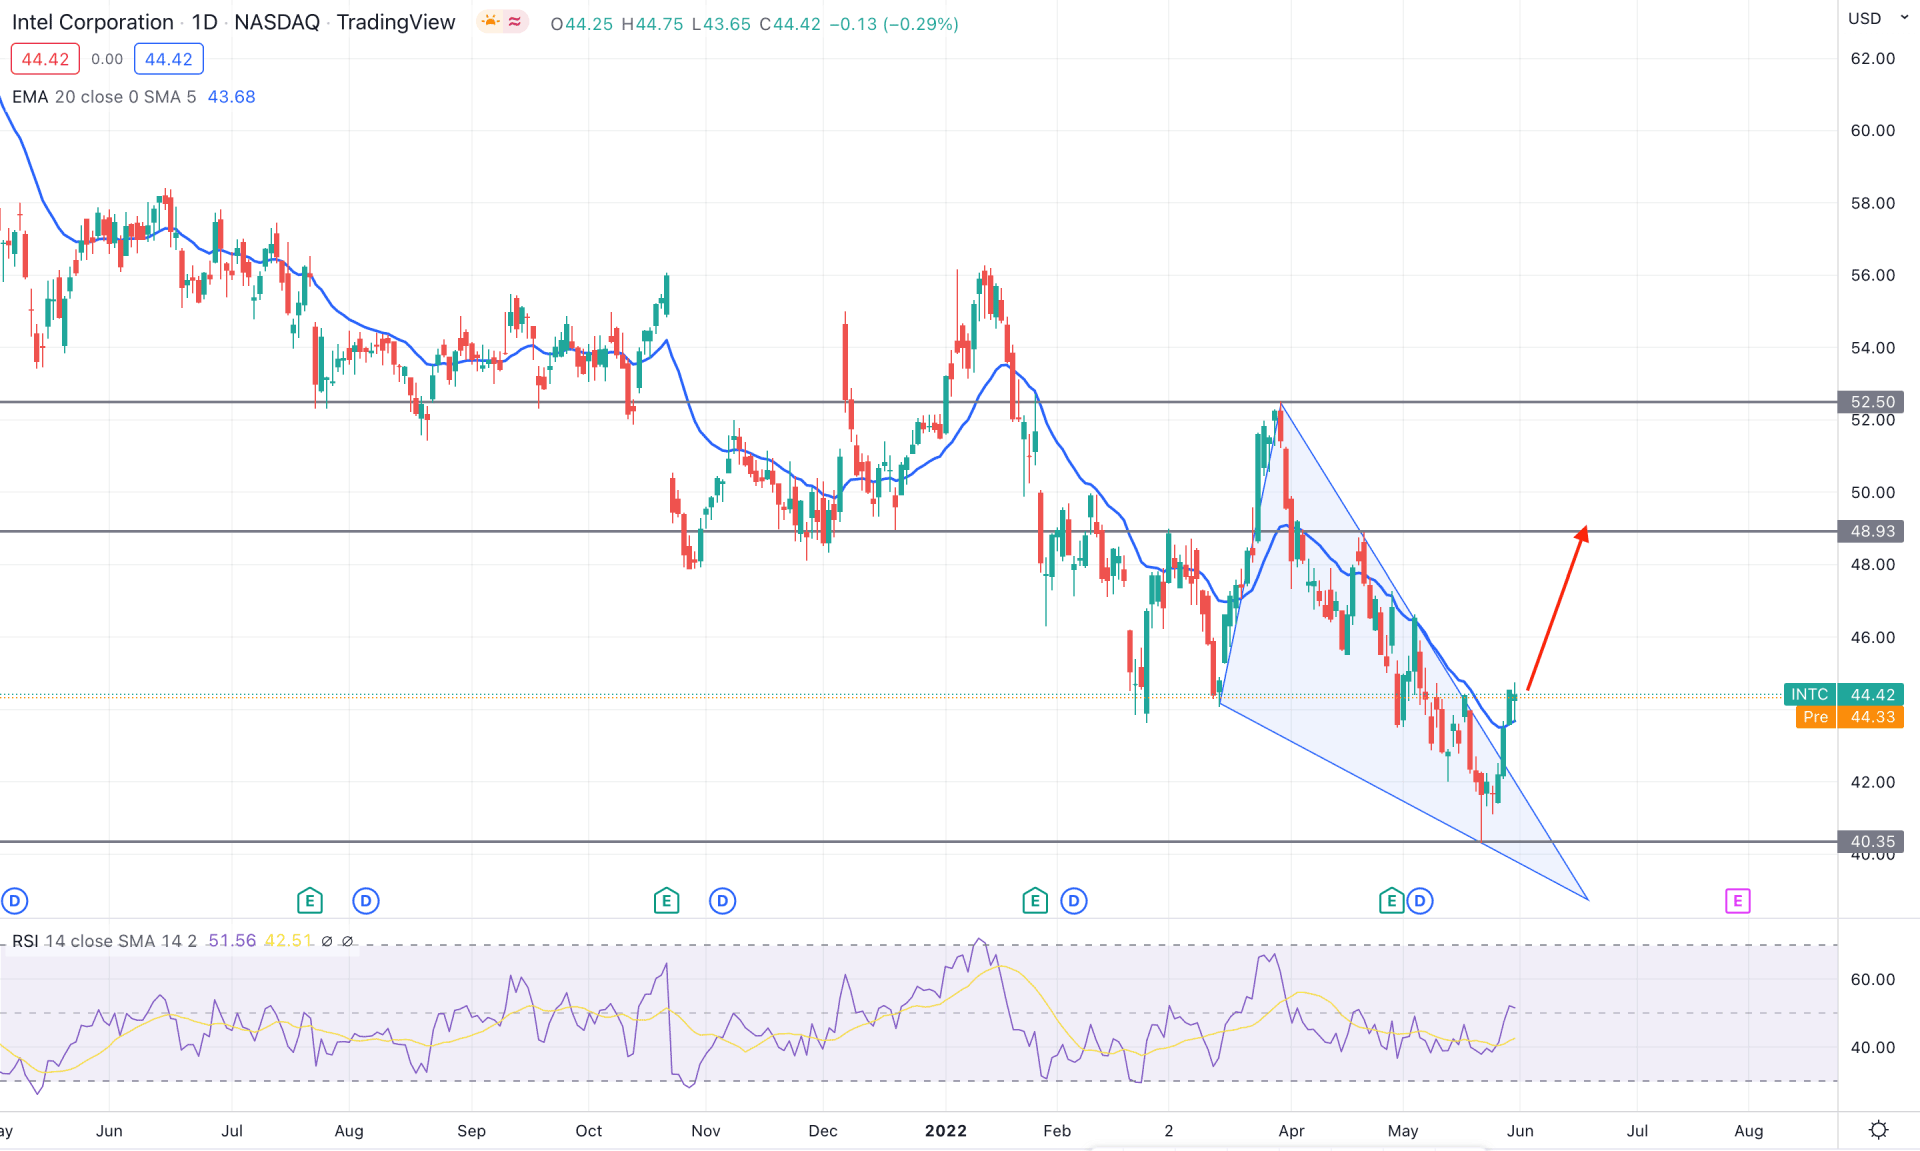
Intel stock (INTC) daily chart trades within a bearish momentum starting from 12 April 2021, extending to the recent swing low of 40.35. Although the bearish pressure made multiple swing lows within one year, the recent falling wedge formation and breakout above the dynamic 20 EMA are signs of a reversal momentum. Therefore, the 40.35 support level would be a significant area as the current momentum above this level is bullish for this instrument.
The above image shows the daily chart of Intel stock, where the recent bullish exhaustion from 40.45 resulted in a falling wedge breakout. Moreover, the Relative Strength Index (RSI) moved above the neutral 50 level after remaining corrective for more than a month in the indicator window.
Based on the daily structure, the recent bullish daily candle above the dynamic 20 EMA increased the possibility of an upside pressure towards the 48.93 swing level. However, the wedge breakout awaits a correction where further bullish rejection from 44.00 to 42.00 area would be a potential bullish opportunity for this stock.
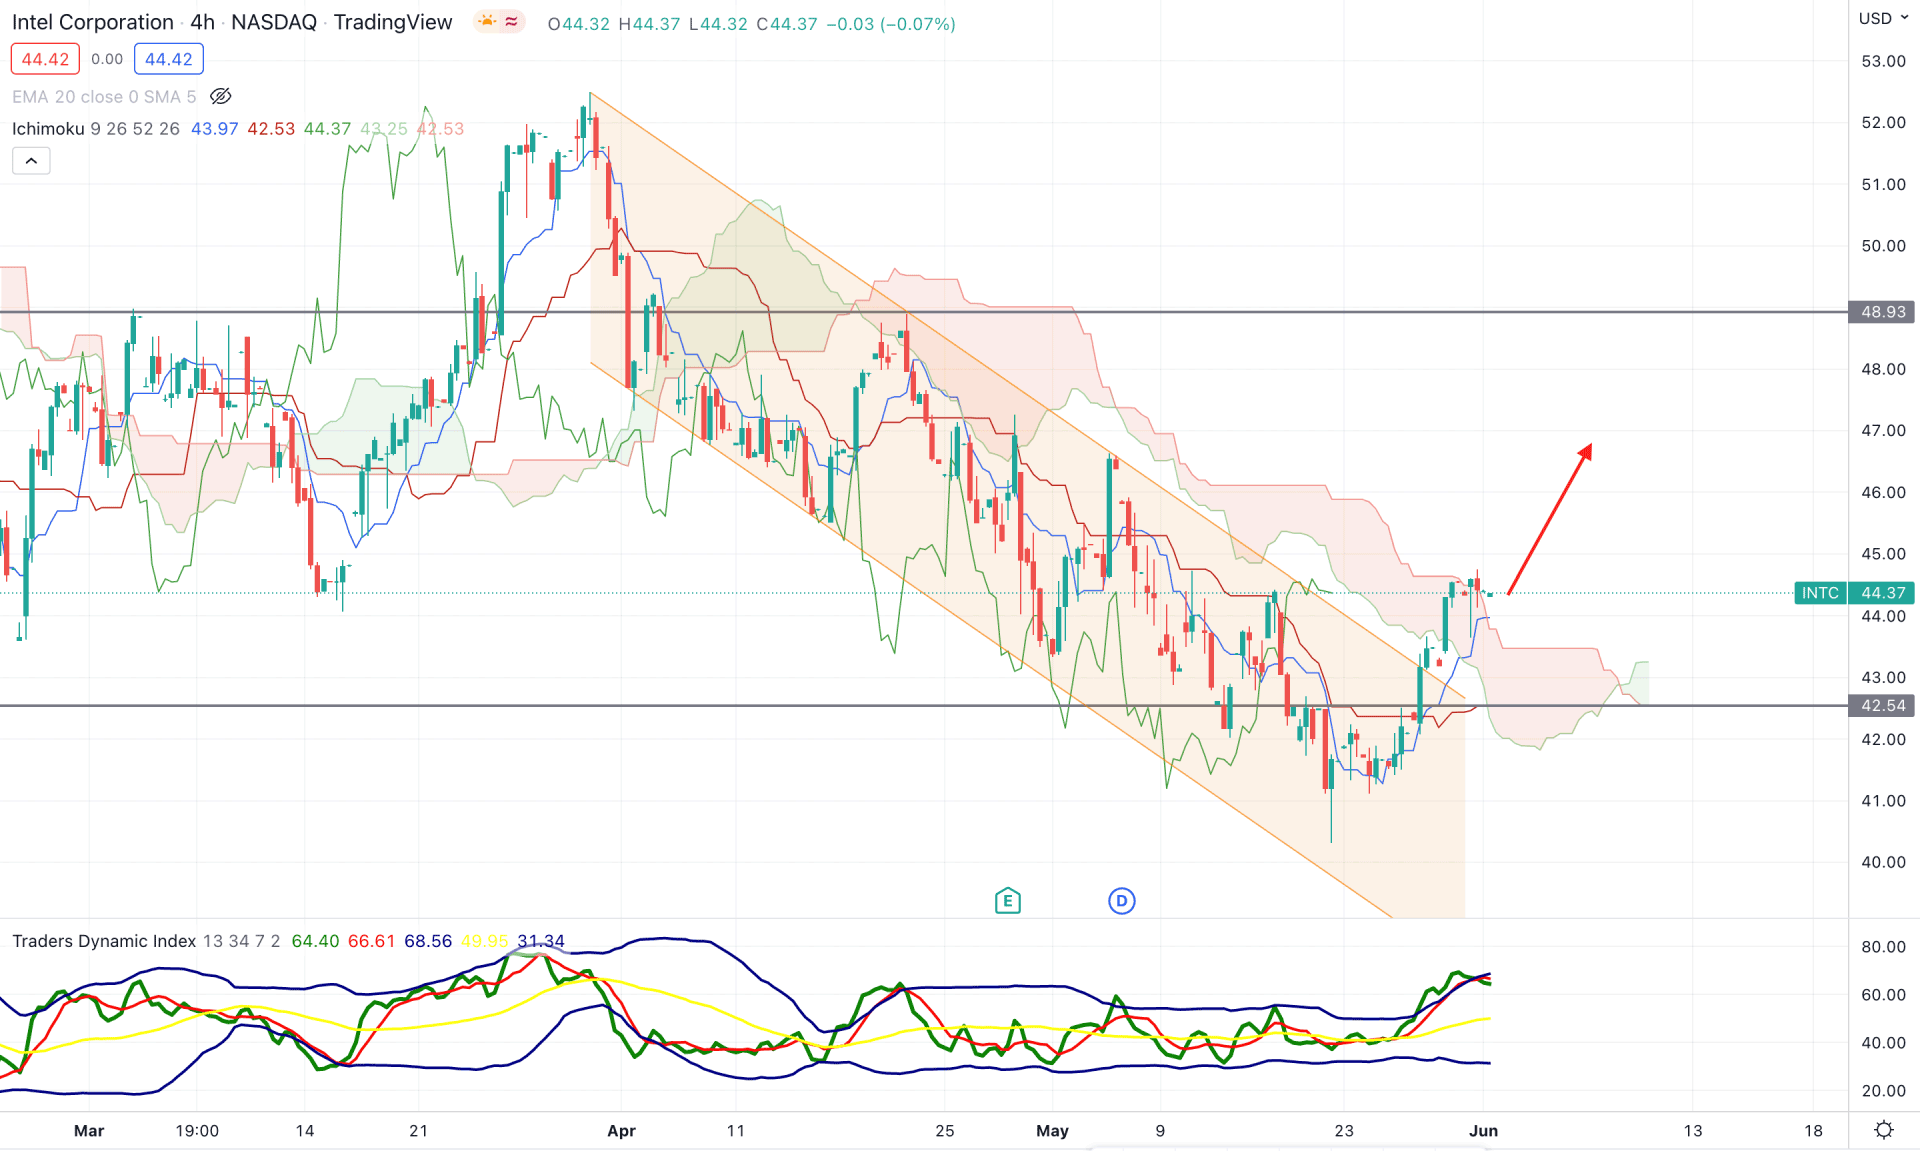
According to the Ichimoku Cloud analysis, the current price trades above the Kumo Cloud, followed by a descending channel breakout with an H4 close. Moreover, the price was stable above the dynamic Kijun Sen line, indicating additional buyers’ attempts. Meanwhile, in the future cloud, Senkou Span A turned above Senkou Span B, indicating a potential trend change from bearish to bullish.
The above image shows how the Traders dynamic index increased following massive buyers' attempts. However, the TDI line reached the upper band, representing an overextension of bullish sentiment. In that case, a bearish correction is pending in this instrument following the mean reversion towards the dynamic Kijun Sen line.
Based on the H4 context, investors may experience a bearish correction in this stock as the gap between dynamic Tenkan Sen and Kijun Sen has extended. However, any bullish rejection from the 44.00 to 42.00 area with an H4 candle above the Tenkan Sen line would be a bullish opportunity where the primary target would be the 48.93 level.
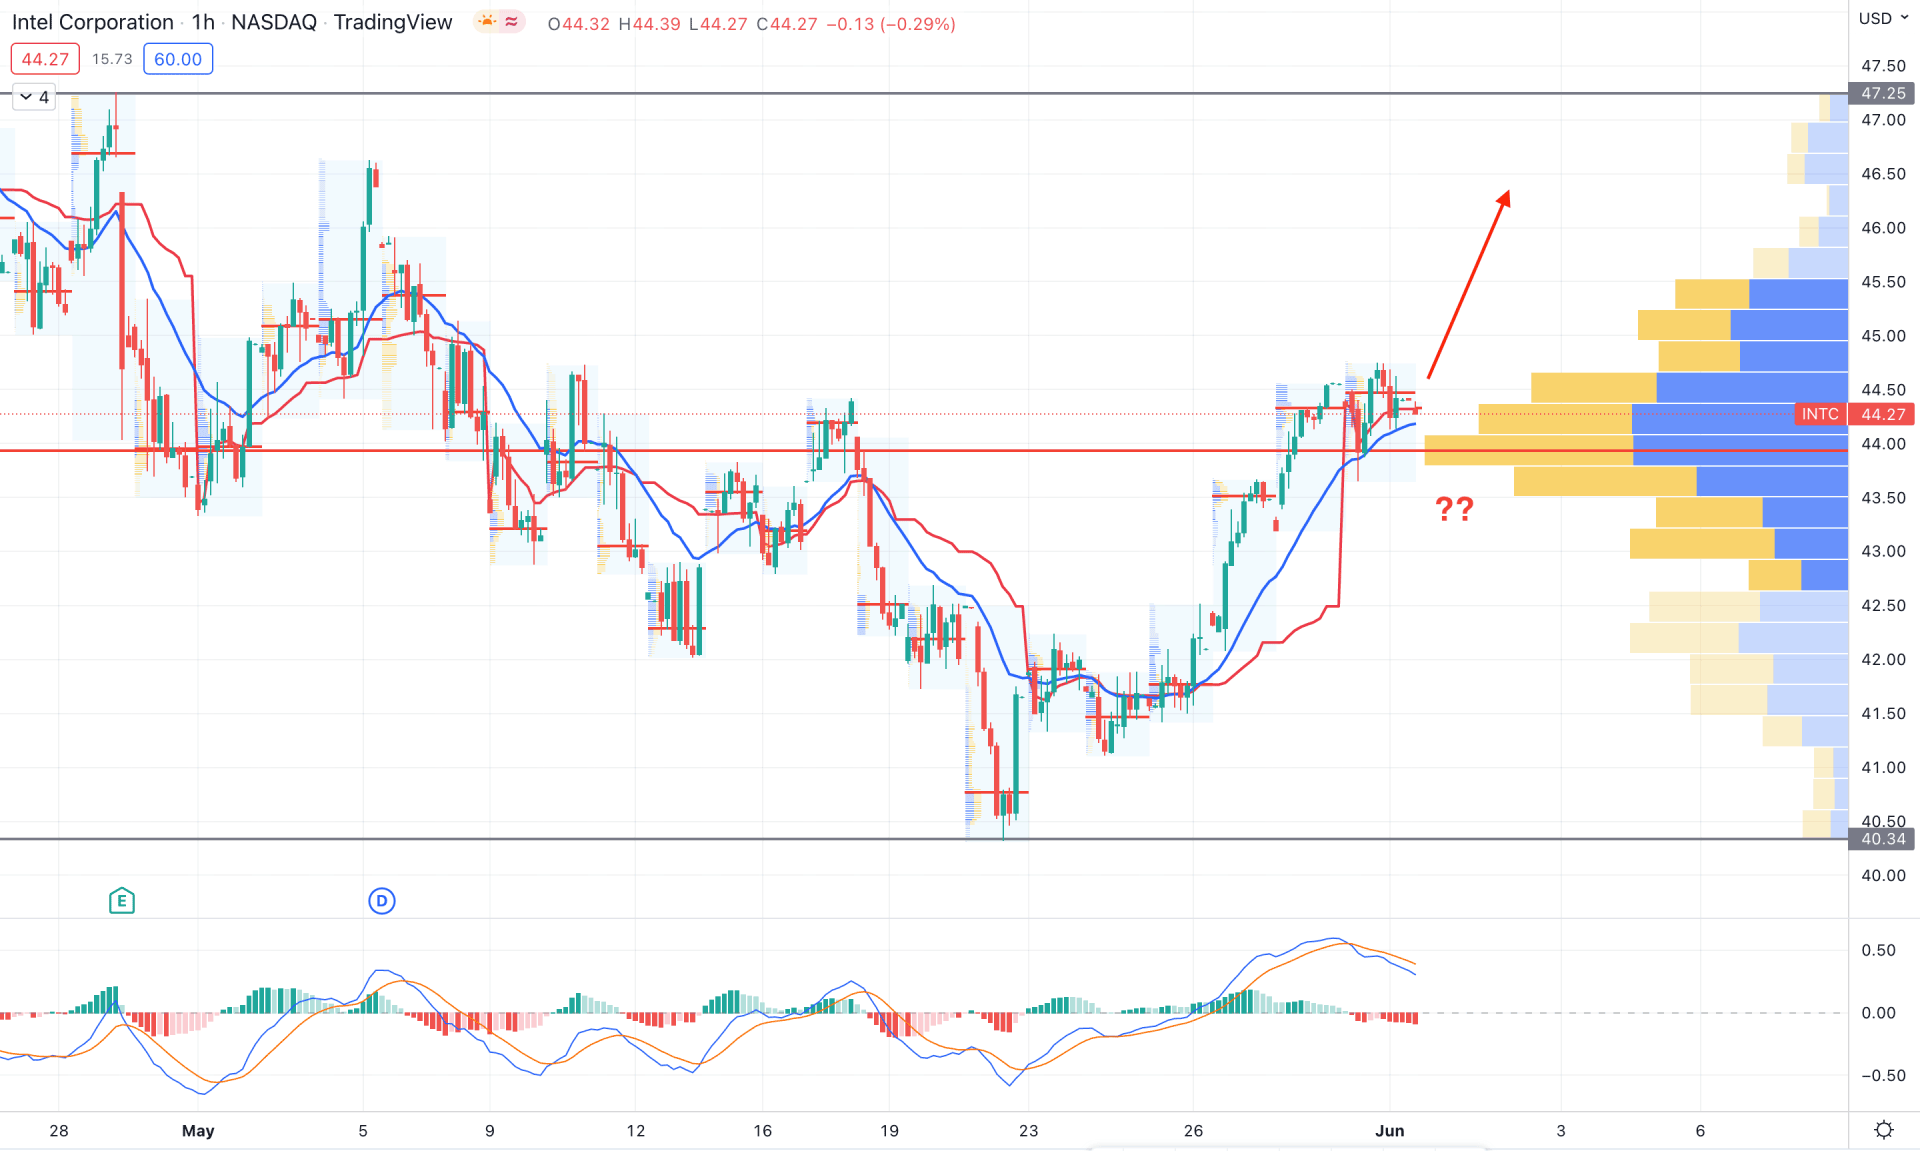
Intel stock is trading within a bullish pressure in the intraday chart as the current price is above the dynamic 20 EMA. Based on the volume profile analysis, the highest volume from the visible range is at 43.85 level, which is a substantial barrier for sellers. On the other hand, the intraday high volume levels are corrective, where the most recent intraday high volume level is above the current price. In that case, the corrective volume structure above the 43.85 level needs additional bullish rejections before showing an upside pressure.
The above image shows how the price remained corrective above the dynamic weekly VWAP while the MACD Histogram is strongly bearish. Moreover, the MACD line is above the Histogram with selling pressure. In that case, the corrective pressure above the 43.85 level would be challenging for bulls, whereas any bearish H1 candle below the 43.00 level would be a bearish opportunity.
As per the current market context, the Intel stock is more likely to show bullish pressure in the coming days, where a bearish correction is still pending. In that case, any bullish rejection from the dynamic Kijun Sen in the H4 chart would be a potential buying opportunity, followed by the descending channel breakout.


