Published: August 14th, 2024
Intapp posted impressive results for the fourth quarterly period and fiscal year 2024, demonstrating notable yearly increases in several important financial metrics.
While the overall revenue grew by 21% to $114.4 million, SaaS and support earnings climbed by 25% to $85.0 million. ARR (annual recurring revenue) for the cloud increased by 33% to $296.7 million.
The overall revenue jumped by 23% to $430.5 million, with SaaS and support revenue rising by 25% to $316.0 million. Compared to the $(69.3) million decrease in the fiscal year 2023, the company's GAAP functioning loss of $(32.2) million represents a notable improvement. Operating income not subject to GAAP increased to $38.7 million from $10.5 million in the prior year.
698 of the 2,550 clients that Intapp served until June 30, 2024, had contracts with an average annual revenue of more than $100,000. There are now 73 buyers with more than $1.0 million in annual revenue (ARR), up from 53 the year before.
The estimated range for SaaS revenue is $75.3 million to $76.3 million, while the estimated range for total revenue is $117.2 million to $118.2 million. Non-GAAP operating income is anticipated to range from $11.0 million to $12.0 million.
Total revenue is projected to vary from $493.0 million to $497.0 million, with SaaS revenue expected to be between $326.7 million and $330.7 million. Non-GAAP operating income is projected to range from $56.5 million to $60.5 million.
Let's see the further aspect of this stock from the INTA technical analysis:

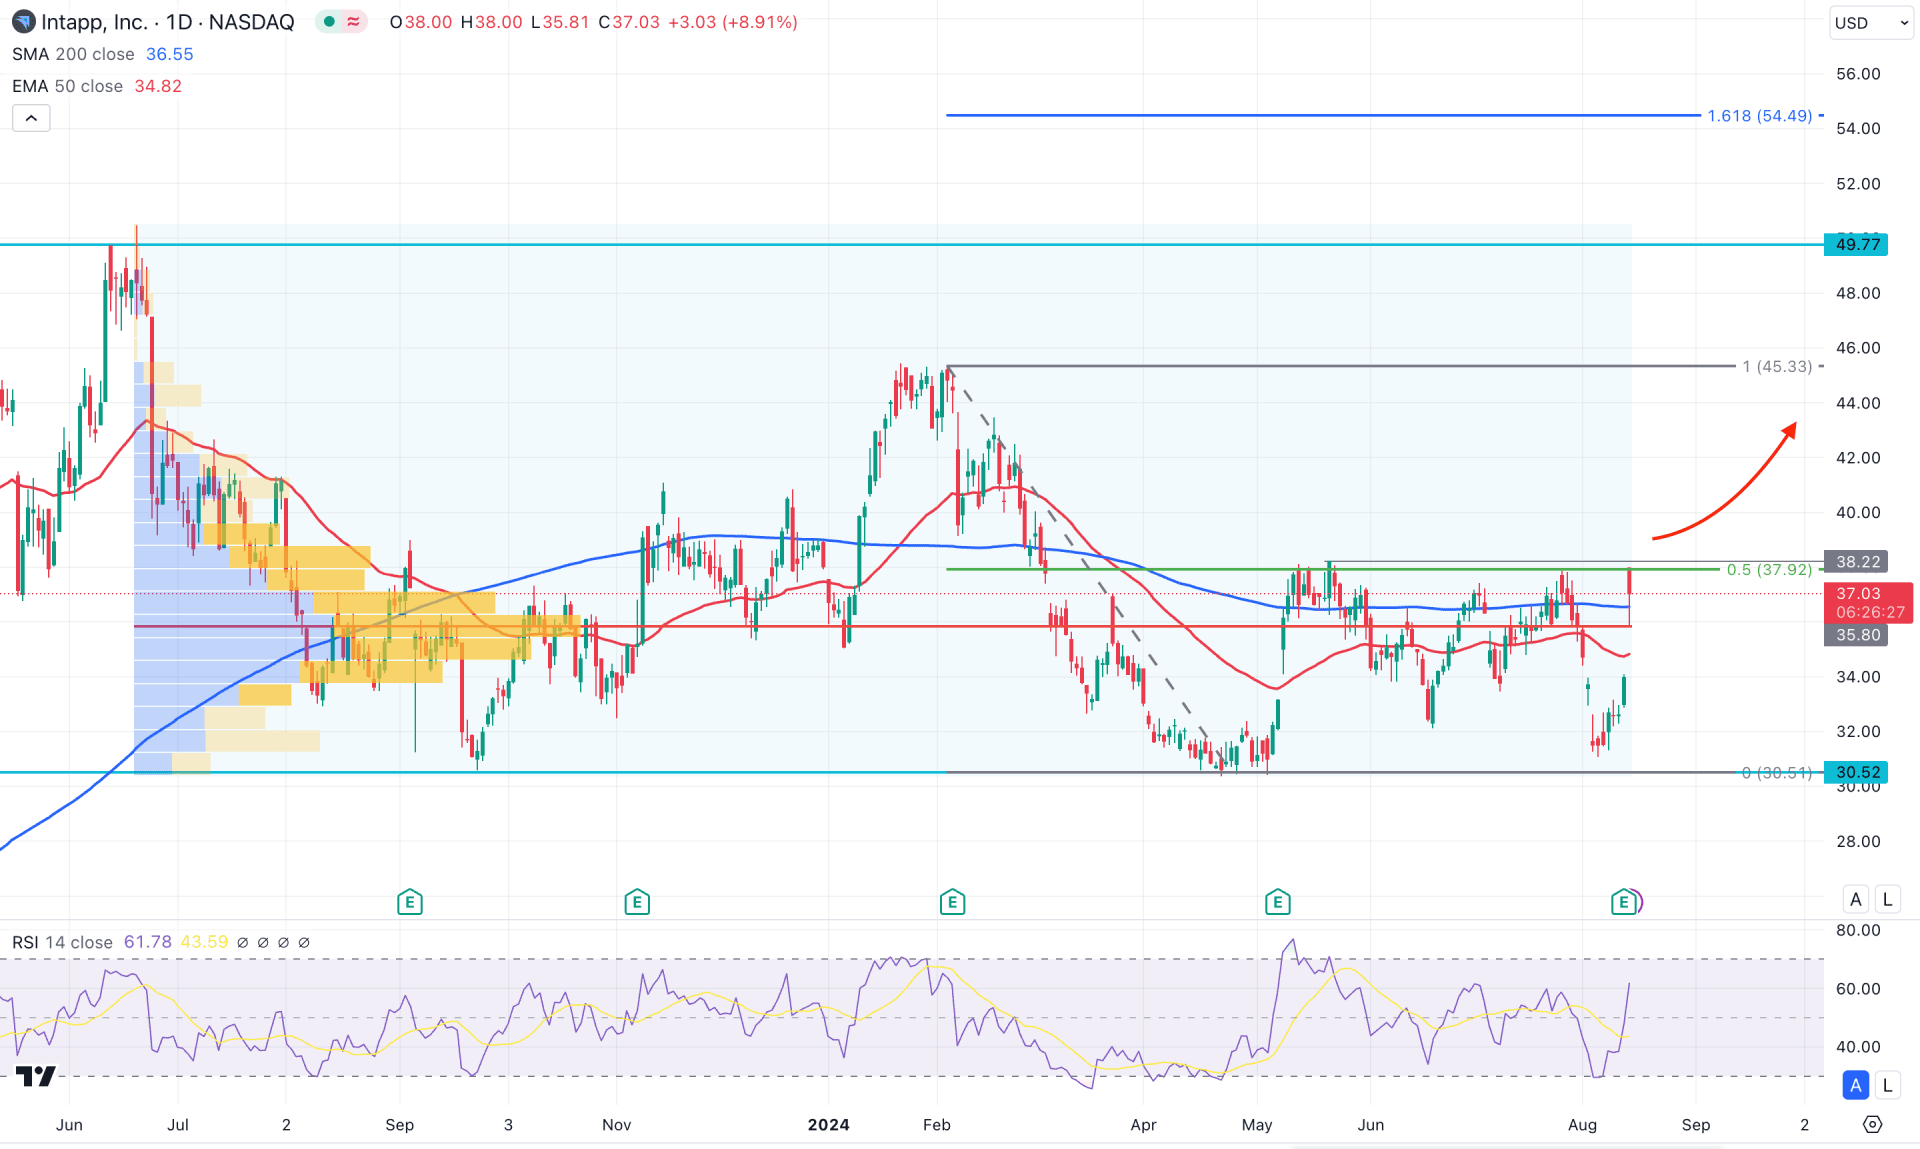
In the daily chart of INTA, the ongoing market momentum is corrective as the recent price trades within a rectangle pattern. In that case, the primary aim for this stock is to look for a valid breakout before anticipating impulsive pressure.
In the volume structure, a stable market above any high volume line usually represents buyers' presence in the market. For INTA, the most active level since July 2023 is just below the current price. It is a sign that institutions have started building orders, and the price is likely to soar after forming a valid price action. Also, the current high volume level is within the rectangle pattern, suggesting a prolonged order building.
The monthly candlestick pattern suggests a strong bullish continuation opportunity as it trades above the four-month high after a sufficient sell-side liquidity sweep.
Looking at the daily chart, the broader market outlook is bullish as the price formed a bullish V-shape recovery from the 200-day Simple Moving Average. However, the 50-day EMA is still below the 200-day SMA line, where the Golden Cross opportunity could come after having a valid breakout.
In the secondary window, the immediate upward pressure is supported by the RSI line above the 50.00 neutral point. Also, more upside pressure is pending in this stock until the RSI reaches the overbought zone.
Based on the daily market outlook, INTA has a higher possibility of moving up after having a valid breakout above the 38.22 resistance level. For the bullish limit, the current 161.8% Fibonacci Extension level from the near-term swing is at the 54.49 level. Moreover, a stable buying pressure above the 45.33 high might extend the gain above the 70.00 psychological level.
On the bearish side, the conservative long approach is to wait for a valid rectangle pattern breakout with a daily candle below the 30.52 low. In that case, the selling pressure might extend towards the 20.00 psychological line.

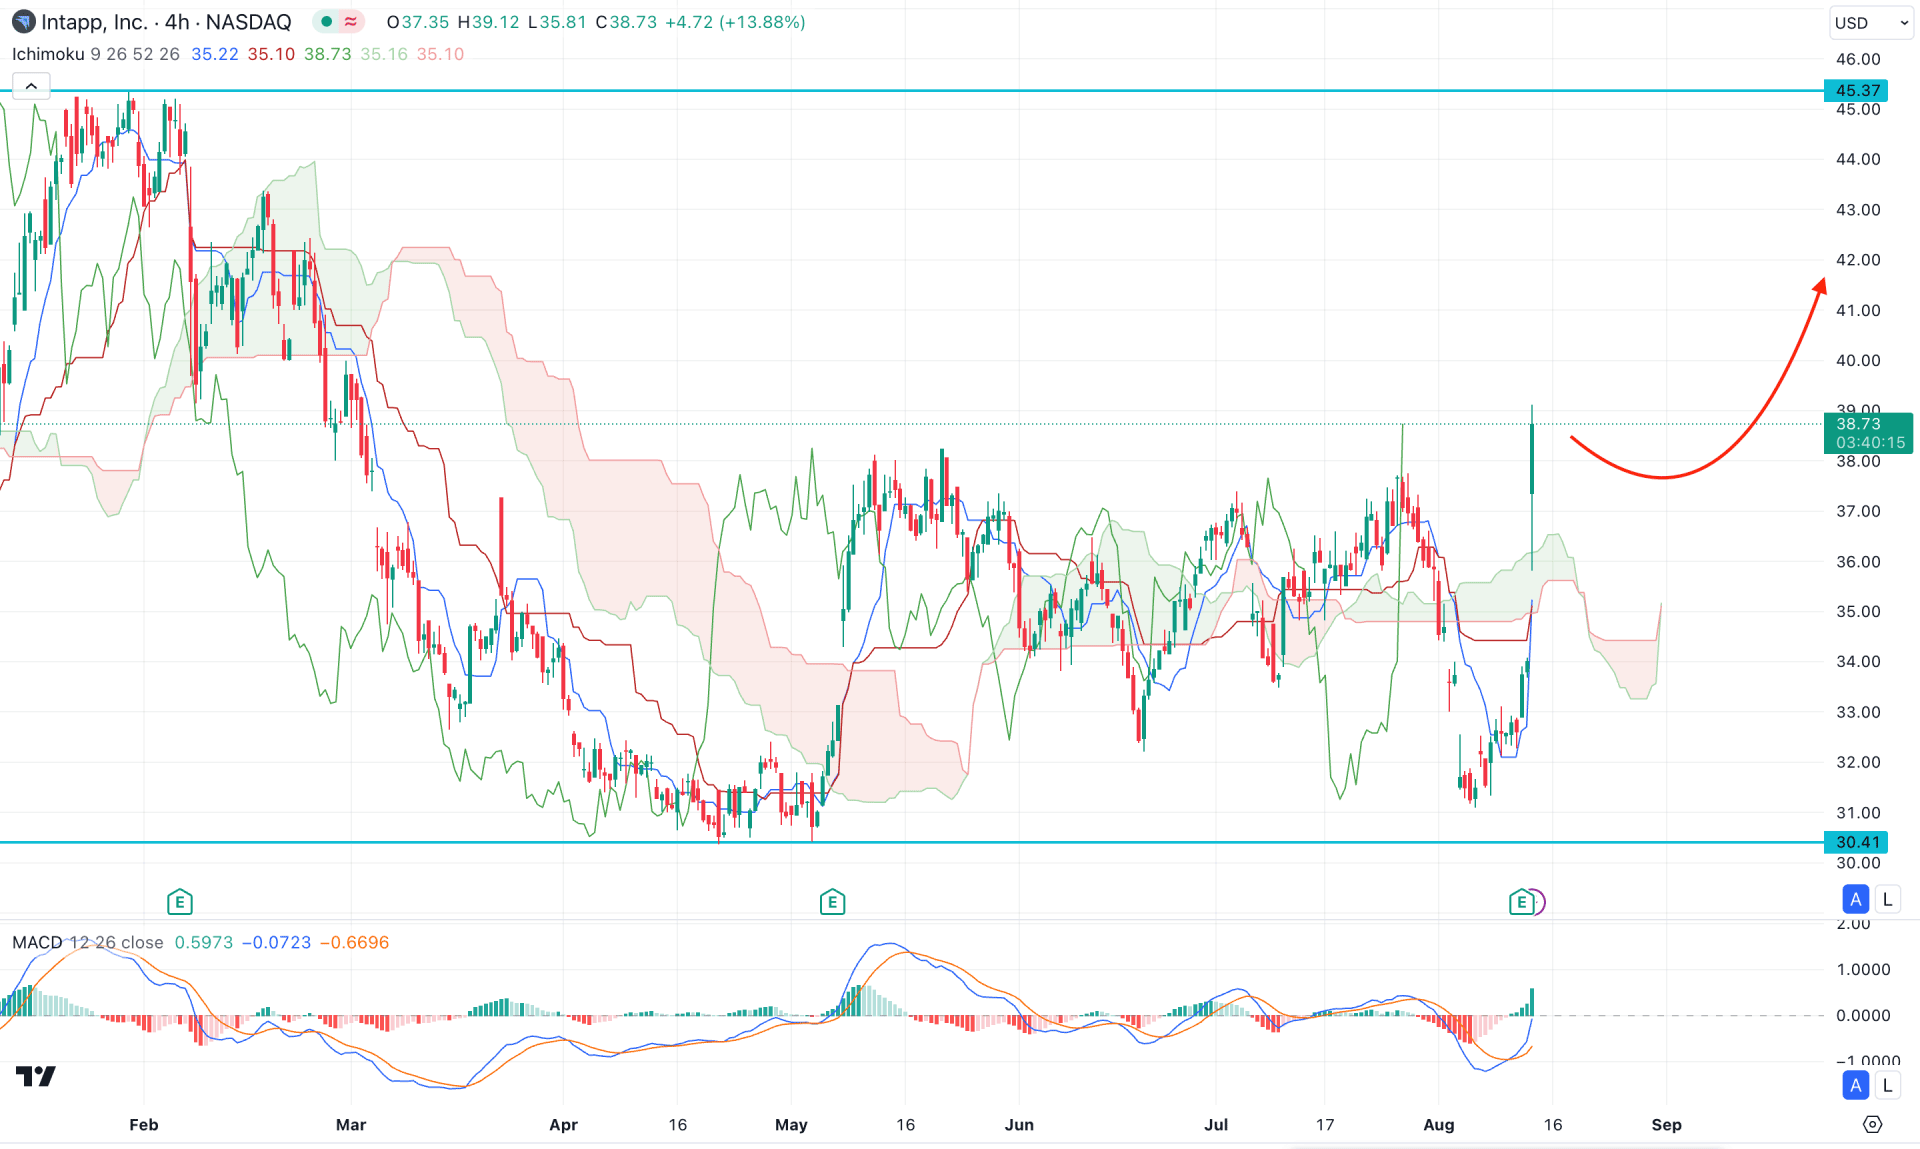
In the H4 chart, the INTA is trading higher, whereas the Ichimoku Cloud is working as an immediate support. Following the bullish breakout, investors might expect a strong trend continuation after a minor correction.
In the secondary window, the MACD Histogram has rebounded and moved above the neutral point. Moreover, the Signal line formed a bullish crossover, suggesting a confluence buying pressure.
Based on the H4 outlook, the buying possibility is valid as long as it hovers above the 34.50 flip point. In that case, any valid bullish reversal might extend the momentum above the 45.37 resistance level.
On the other hand, a failure to hold the price above the Ichimoku Kumo Cloud could be challenging for bulls, as a valid break below this line could test the 30.00 psychological point.

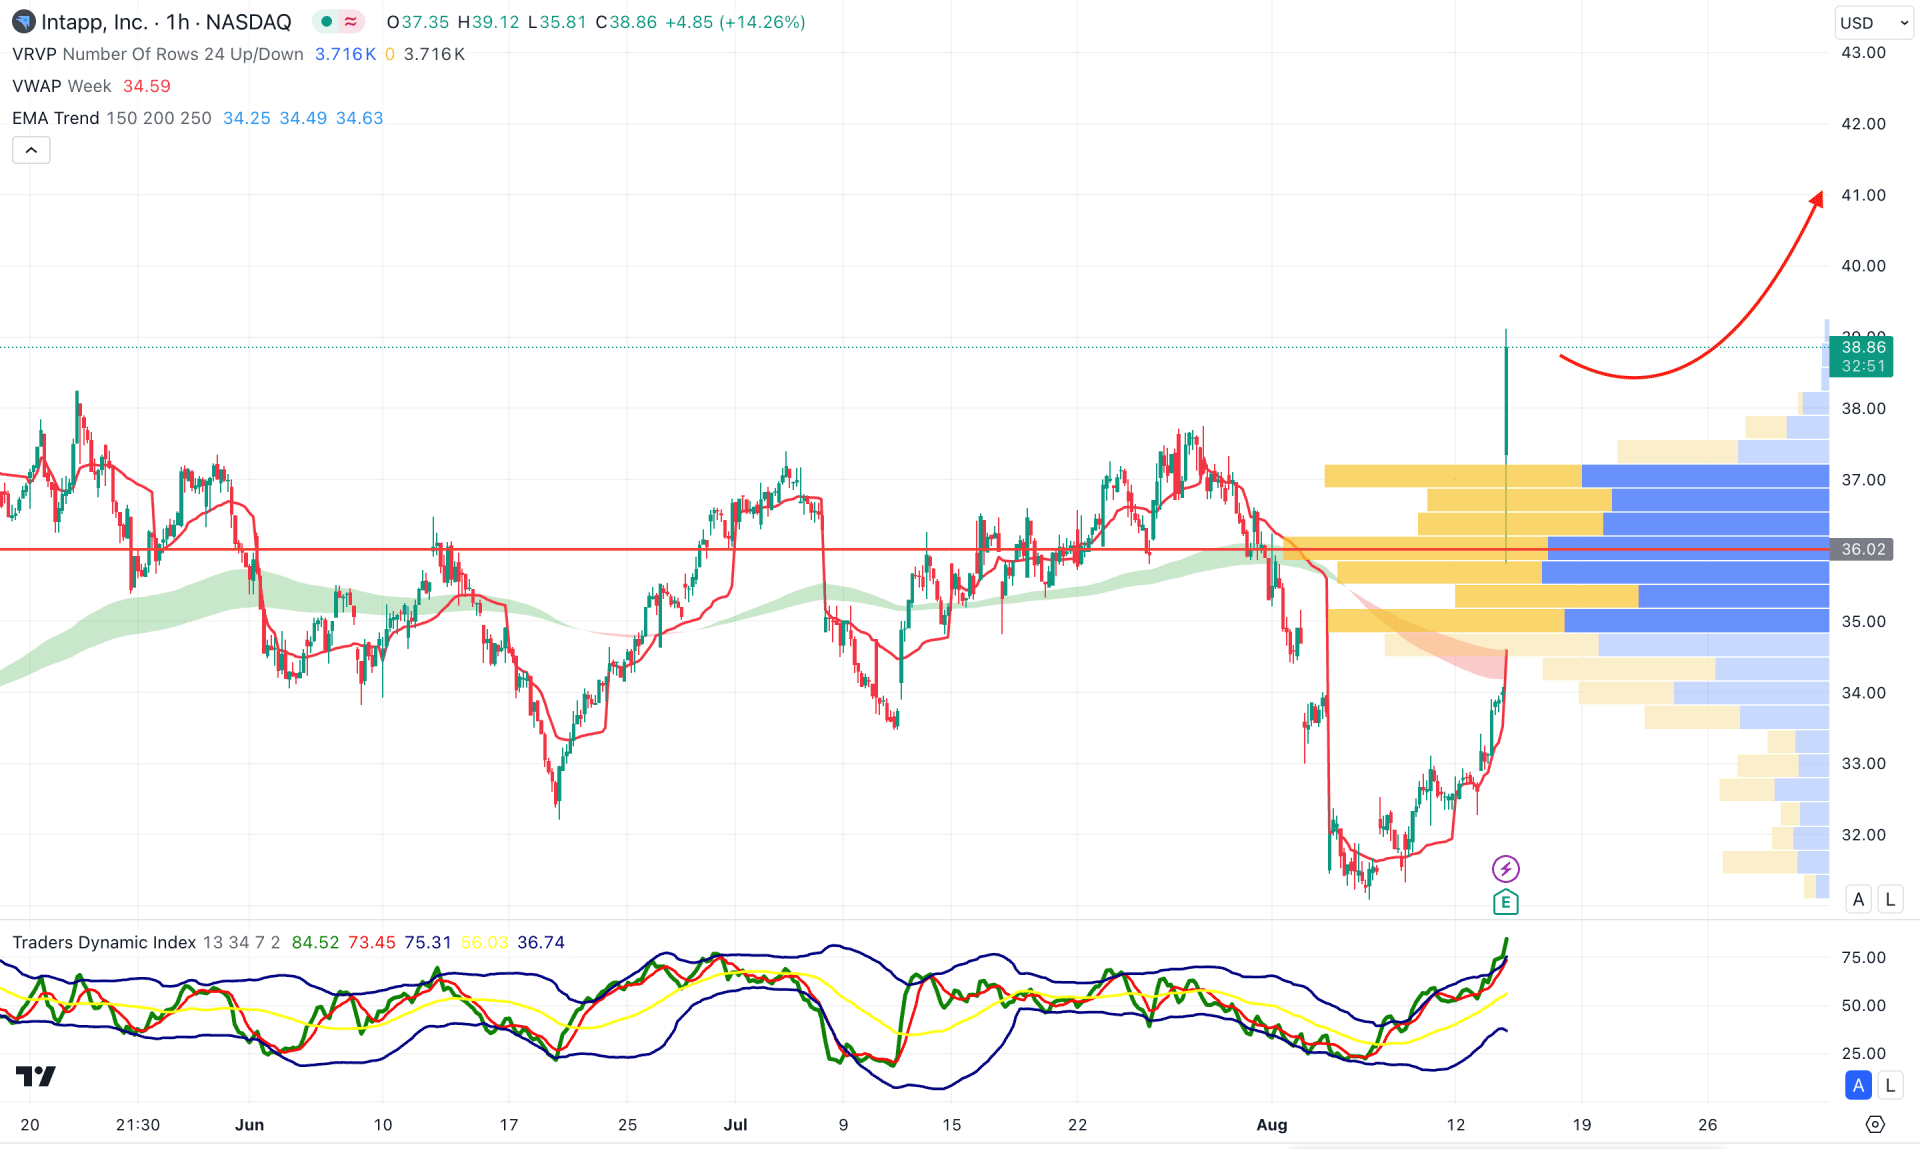
INTA trades higher in the hourly time frame, supported by the visible range high volume level formation at the 36.02 level. As long as the current price trades above this crucial line, we may expect the bullish pressure to extend.
In the indicator window, the Trades Dynamic Index maintained the upside pressure, reaching the highest level since June 2024. It is a sign that the intraday buying pressure is solid, and the price is ready to maintain the current momentum.
Based on this outlook, an ongoing bullish pressure might extend and find a resistance at the 43.00 level. However, a downside correction is possible, where the near-term support from the EMA could be at the 34.60 level.
In that case, a valid bearish daily close below the 34.00 level could be a bearish factor for this stock, aiming for the 28.00 area.
Based on the current market outlook, INTA is more likely to extend the bullish pressure and reach beyond the near-term resistance level. As the intraday price has signaled the bullish breakout, investors can join the rally after a valid daily close above the rectangle pattern.