Published: October 5th, 2023
INJ, which entered the market in October 2020 for approximately $0.75, reached an all-time peak of $25.01 in April 2021 during a bullish market. Despite the publication of the Injective mainnet, the price fell to $8.24 at the end of the year.
IN 2023, INJ's performance improved, momentarily surpassing $9 in April. On June 15, however, the news that the United States Securities and Exchange Commission (SEC) was suing Binance and Coinbase caused its value to decline to $5.46. Subsequently, the coin experienced recovery, trading above $9 in mid-July but later declining to about $8 on August 3, 2023.
At that time, 83.7 million INJ were in circulation out of a total supply of 100 million, giving it a market value of approximately $668.8 million and ranking it as the 58th-largest cryptocurrency by market cap.
Injective is a blockchain designed specifically for the DeFi industry, allowing users to create decentralized applications (dApps) and their own cryptocurrency tokens. In addition to functioning as a DeFi blockchain, Injective is a cryptocurrency exchange that facilitates the purchasing, selling, and trading of cryptocurrencies as well as participation in the trading of crypto derivatives.
In the following section, we will see the complete INJ/USDT market outlook from the INJ technical analysis:

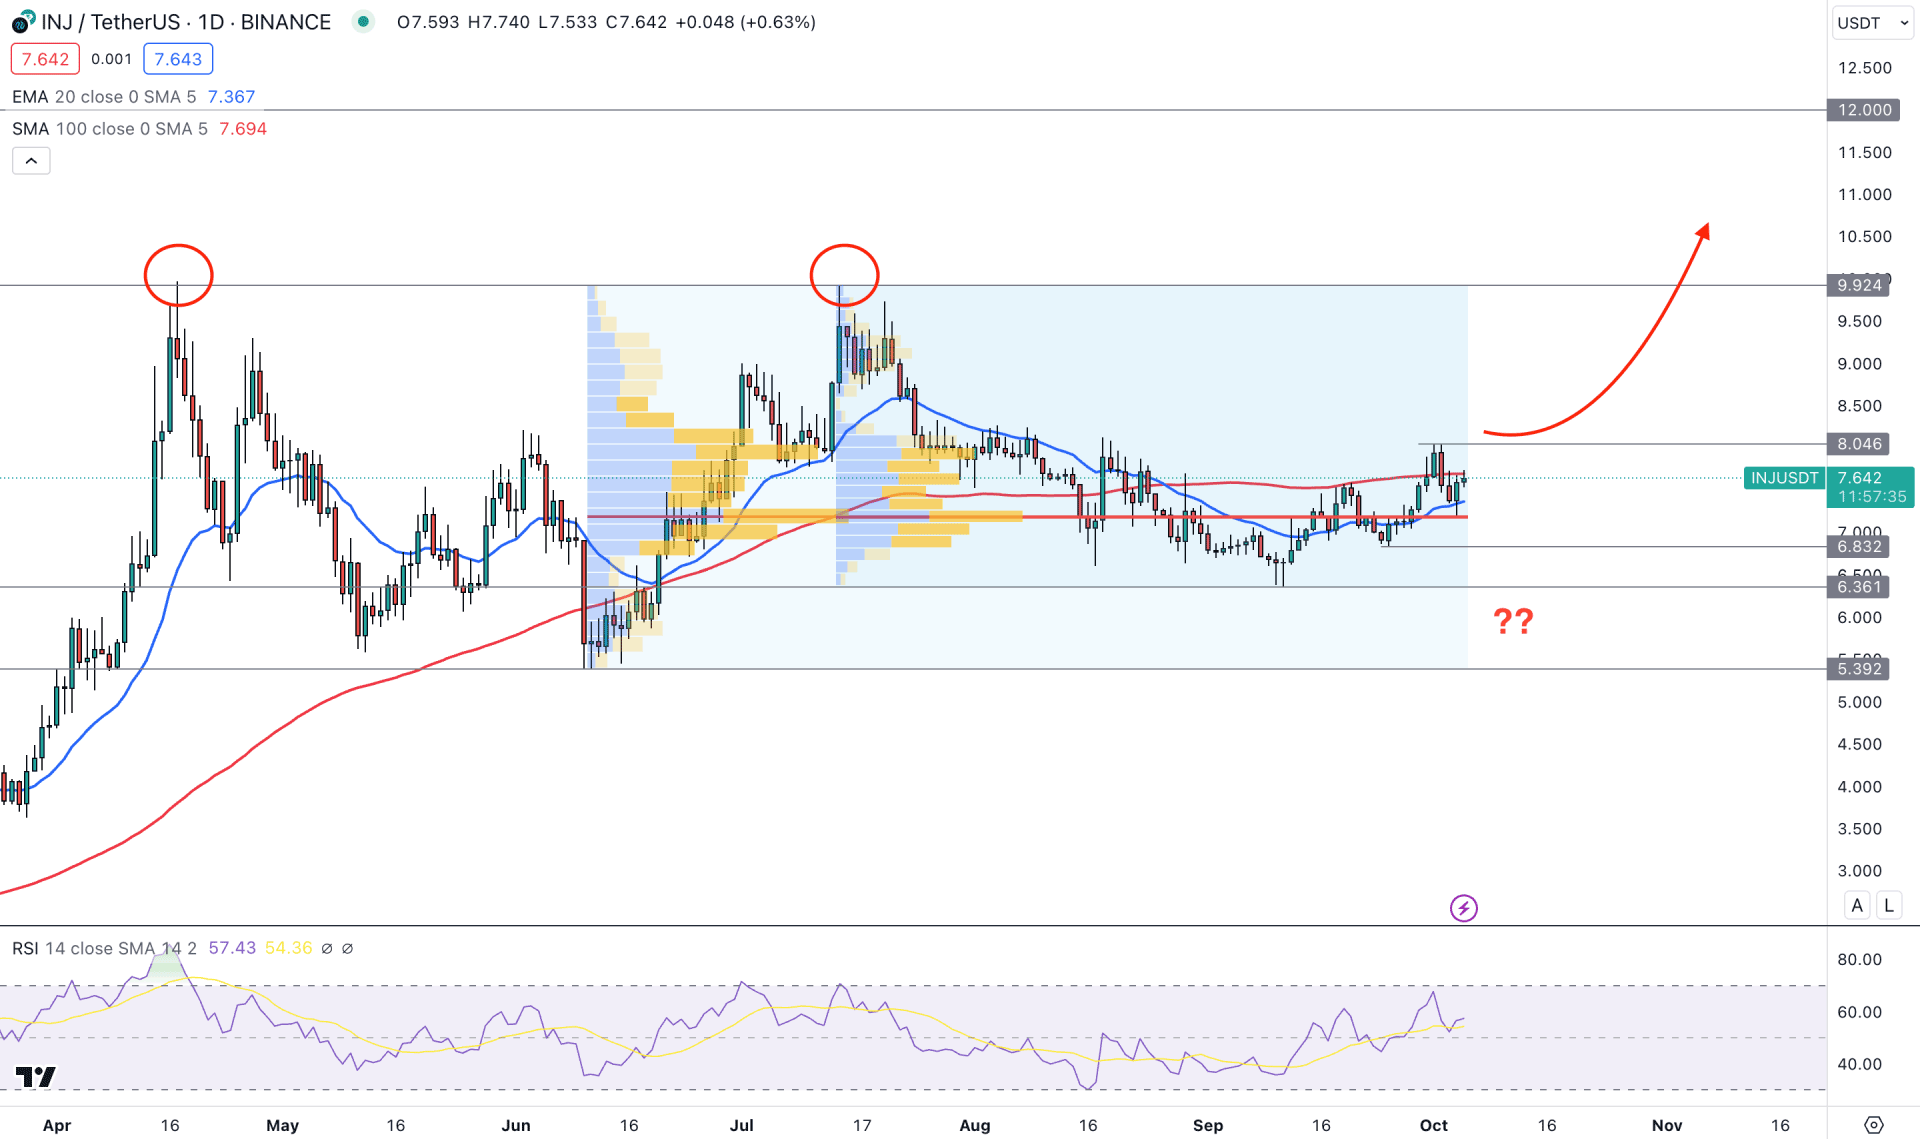
In the daily chart of INJ/USDT, the overall market momentum is bullish, as the current high volume level indicates a strong buyers’ presence in the market.
Based on the current visible range high volume level, the most active level since June 2023 bottom is at 7.16 level, which is below the current price. Another high volume level since the July 2023 peak is also at the 7.16 level, increasing this area's importance. As the current price is trading above this critical price level, we may expect the broader outlook to remain bullish.
However, taking a trade in the daily chart often needs additional confirmation from the higher timeframe. For INJ/USDT, the monthly price action, a corrective price behavior, has been seen for the last five months, backed by a solid bullish trend. Moreover, the current weekly candle is backed by a strong bullish Morubozu candle, from where a bullish break above the latest candle’s high could be a long signal.
In the daily chart, the dynamic 20-day Exponential Moving Average works as an immediate support level, while the flat 100-day SMA is above the current price. On the other hand, the bullish momentum from the 6.361 support level came with two consecutive lower high formations.
In the indicator window, a bullish rebound is seen from the 50.00 neutral level, which could result in a bullish continuation towards the 70.00 overbought level.
Based on the daily price behavior, a strong bullish continuation opportunity might come after having a daily candle above the 8.046 swing high. The primary target area of this buying pressure could be 9.921 static double top level.
On the other hand, a deeper bearish correction might come from the 6.832 to 6.361 area, from where a bullish D1 candle above the 20 DMA could be another long opportunity.
On the bearish side, a sharp downside pressure and a daily close below the 6.00 psychological level could be a short opportunity, targeting the 5.391 support level.

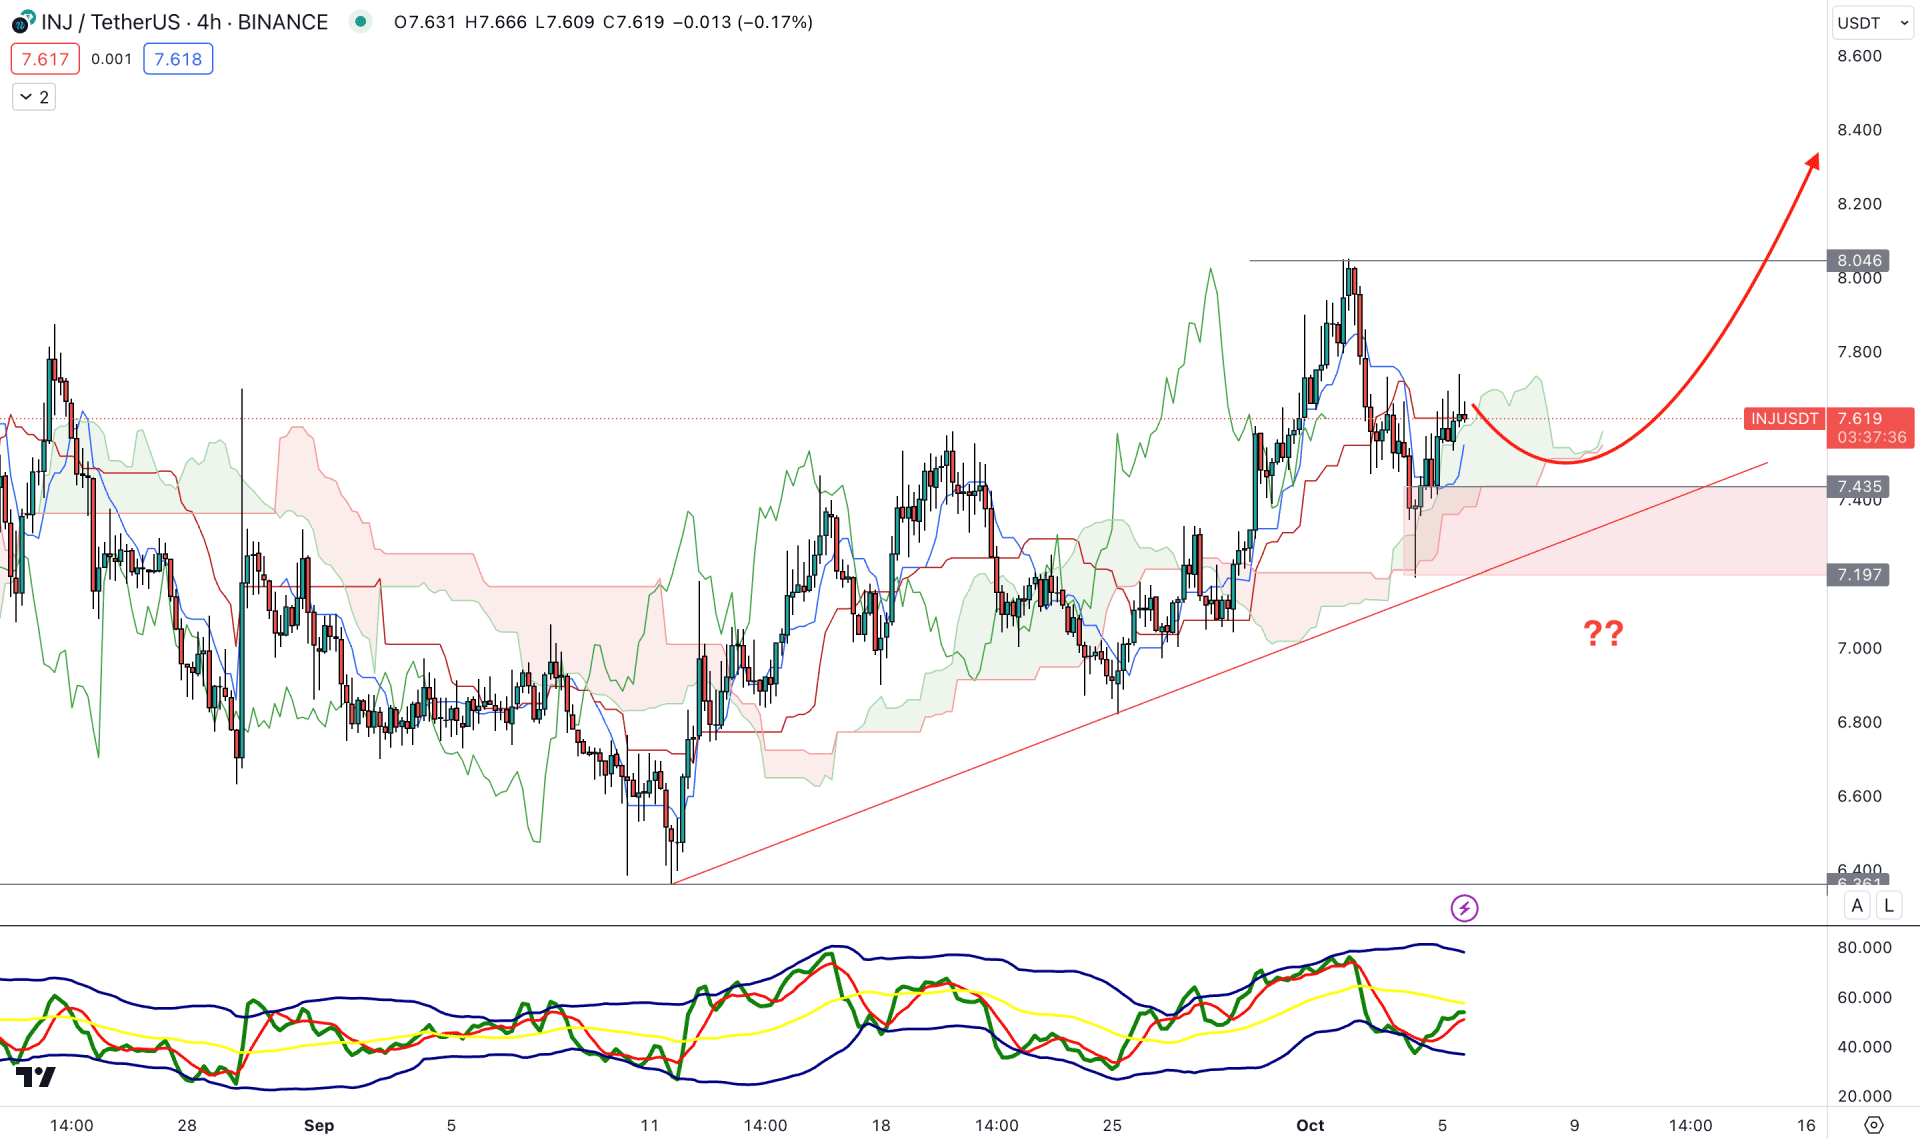
In the H4 timeframe, the current bullish continuation is supported by a rising trendline, while the current Future could show a bullish trend trading opportunity. Moreover, the current price is facing support from the Ichimoku Cloud area, from which an upside continuation is possible.
In the indicator window, the current Traders Dynamic Index shows a rebound from the oversold area, which is a bullish reversal possibility.
Based on this outlook, a bullish rebound is possible as long as the price trades above the 7.197 static level. In that case, an H4 close above the 8.046 swing high could extend the bullish momentum toward the 9.924 level.
On the bearish side, a strong bearish H4 close below the trend line support could lower the price towards the 5.392 level.

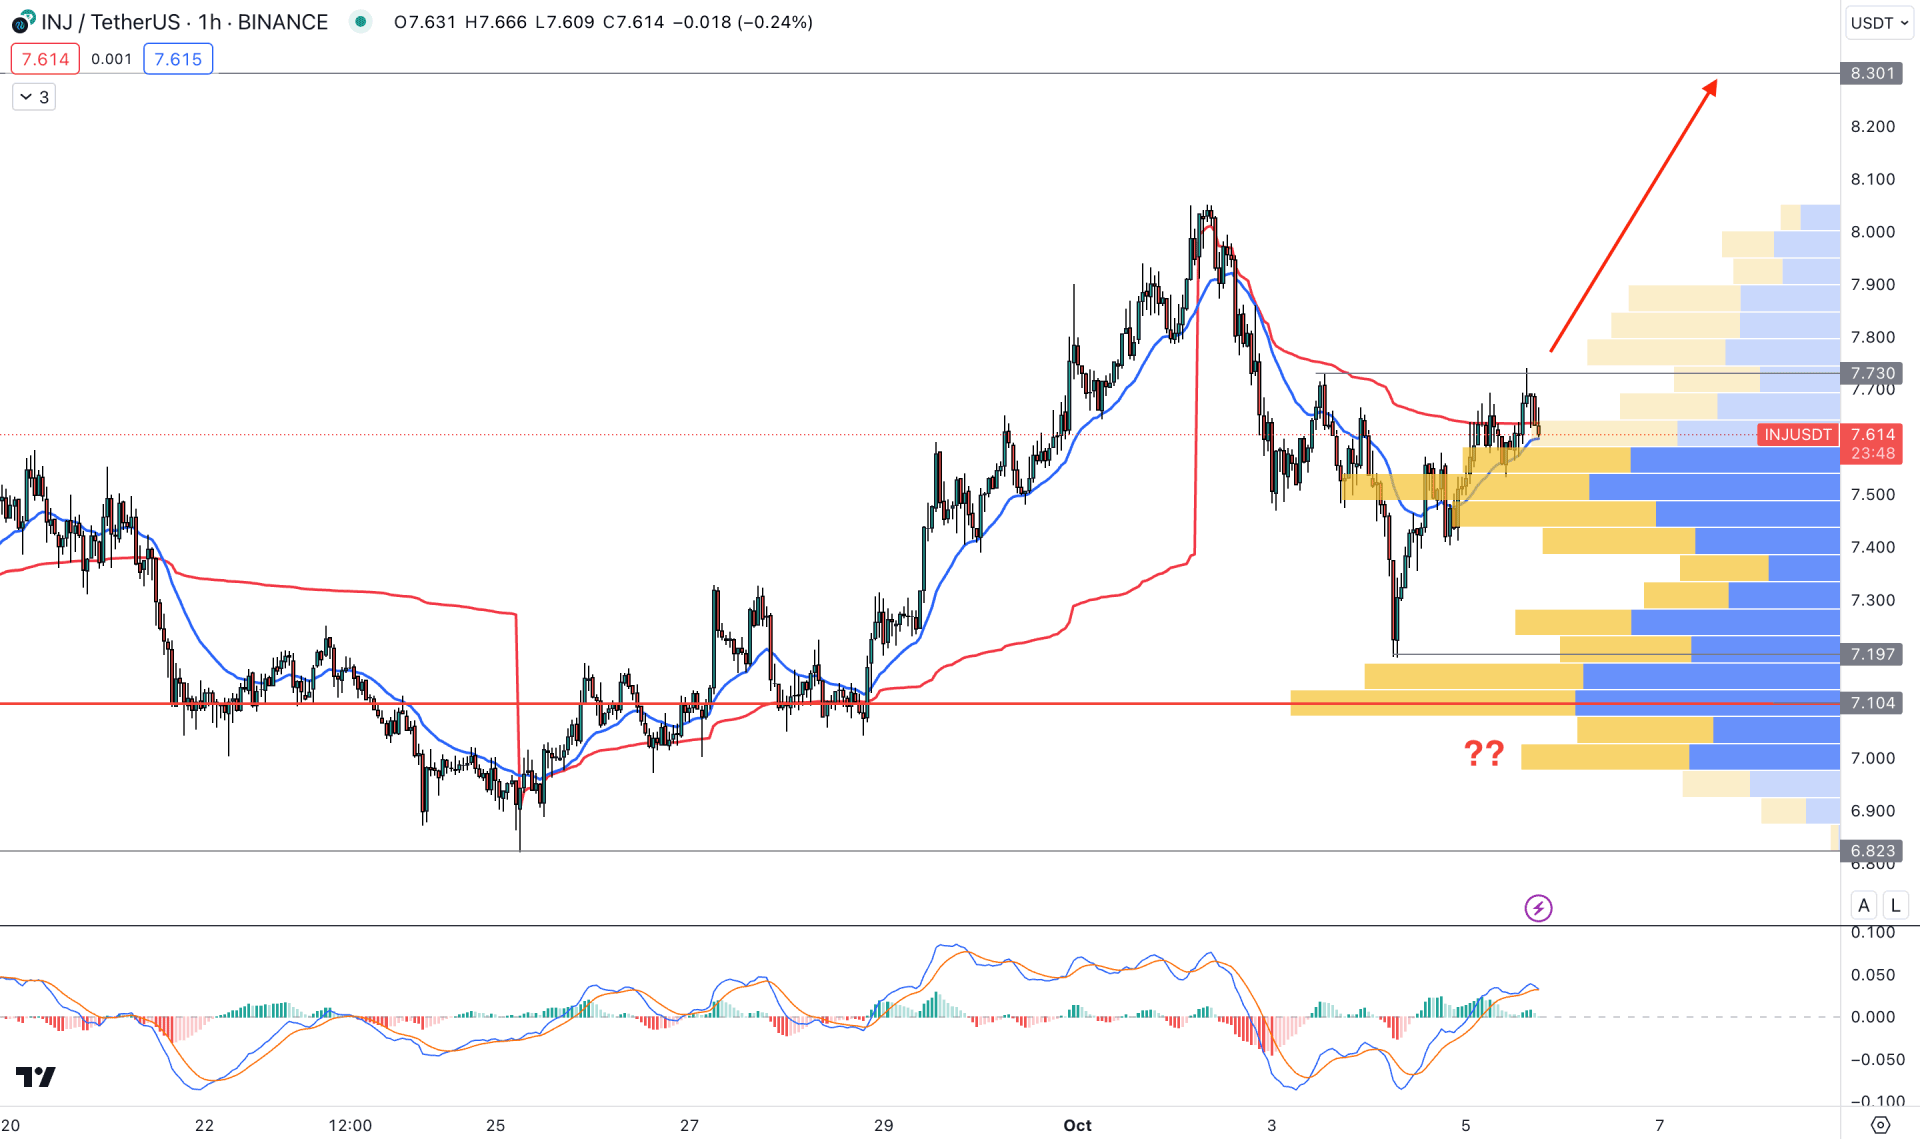
In the H1 chart, the overall market momentum is bullish as the current visible range high volume level is the strong support level. Moreover, the buying momentum took the price above the dynamic 20 EMA level, indicating a buyers’ presence in the market.
In the MACD indicator, the current Histogram shows a bullish possibility, where signal lines are at a positive zone.
Based on this outlook, a bullish H1 candle above the 7.730 level could be a long signal, where the primary aim is to test the 8.301 level. However, a sharp downside pressure with an H1 candle below the 7.000 level could be a short opportunity for the coming hours.
Based on the current market outlook, INJ/USDT could soar after breaching the 100-day Simple Moving Average level. However, an early bullish opportunity might come from the intraday chart, but investors should wait for a valid bullish reversal from the H4 demand zone.