
Published: April 22nd, 2025
With 70% of the market share in the past few weeks, Hyper Liquid has established itself as a major force in the on-chain eternal futures market. By mid-April, the protocol had logged $83 billion in trading activity, having handled $175 billion in March. The amount of hyper liquid, which currently accounts for about 10% of the total volume of the controlled exchange, suggests a move toward autonomous derivatives platforms.
According to the DeFiLlama data, Hyper Liquid alone is responsible for $4.765 billion of the total 24-hour amount of perpetual futures, which is above $7.8 billion. Jupiter, a decentralized exchange situated in Solana, comes in second with $579.02 million. With smaller but significant shares, Vertex Edge, ApeX Protocol, RabbitX Fusion, and GMX come in second.
Smaller rivals have been forced into steady but inferior positions by Hyperliquid's ascent. Top platforms typically gain from more liquidity and retention of users in maturing sectors, which is reflected in the overall market dominance. Hyper Liquid has continued to rise since April 2024. Platforms with more dependability and improved risk controls are gaining popularity as more traders switch to on-chain solutions.
Recent trade activity and coin price results have established Hyper Liquid as a prominent protocol in autonomous derivatives trading. Numerous data sources, such as DeFiLlama and The Block, are monitoring its development.
Let's see the future price direction from the HYPE/USDT technical analysis:
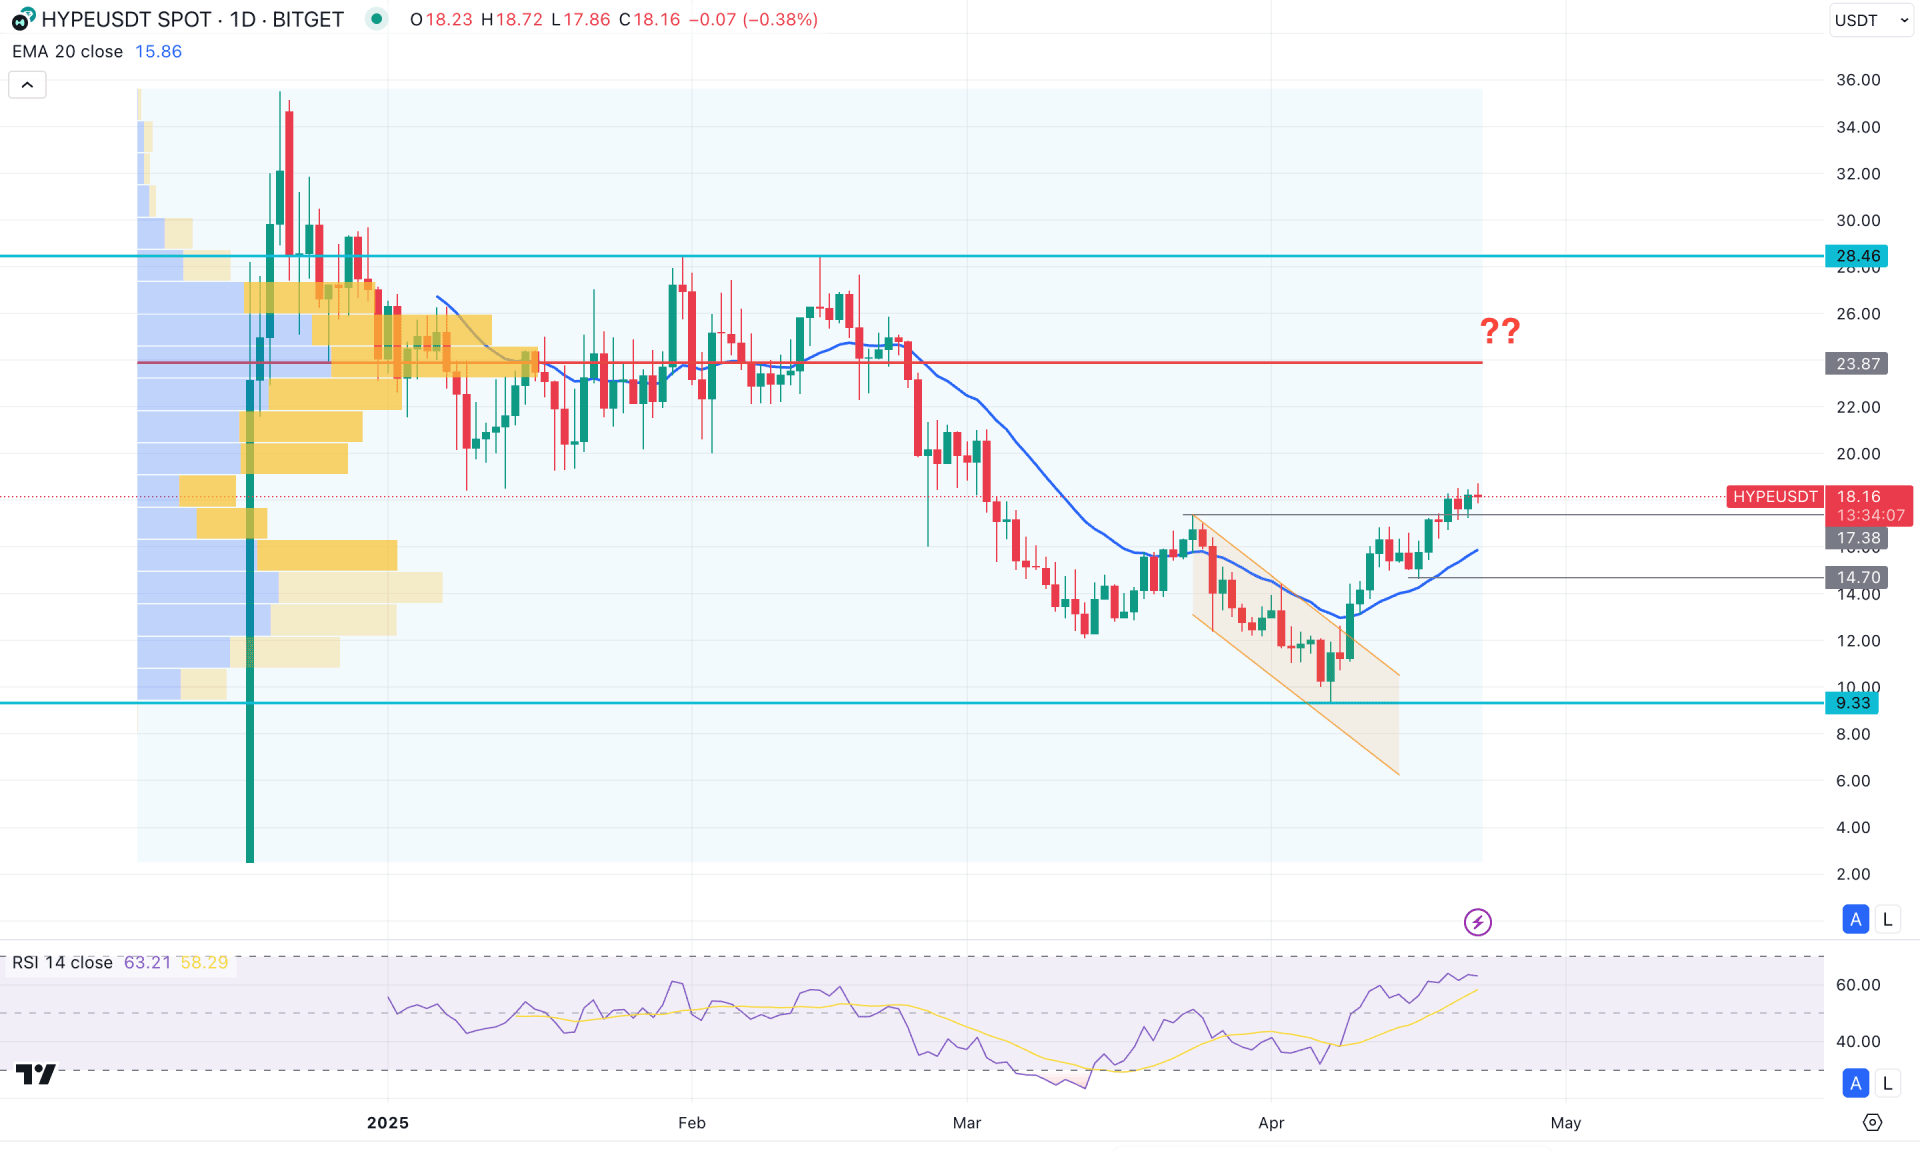
In the daily chart of HYPE/USDT, the broader market trend is bearish as the recent price showed a decent movement from a range breakout. However, a potential bottom is visible from where a recovery can come.
In the higher timeframe, the upward recovery is visible as the price rebounded from the March 2025 low. However, the immediate monthly resistance is at the 21.07 level, which could be a crucial barrier for the bull run. Meanwhile, the weekly price shows a valid upward pressure as three consecutive bullish weekly candles are present.
In the volume structure, the highest activity level since its inception is at 23.87, which is above the current price. As long as the high volume level is protected, the downside pressure might extend.
In the main price chart, a bullish V-shape recovery is visible with a stable market above the 20 day Exponential Moving Average. Moreover, a descending channel breakout could be another factor to consider. As long as the 20 day EMA is below the current price, the upward momentum might extend.
In the Indicator Window, the Relative Strength Index (RSI) hovers above the 50.00 neutral line, which signals buyers' presence in the market.
Based on the current market outlook, the most recent bullish recovery above the 17.38 level signals a new swing high formation, which validates the break of structure. However, a decent bearish recovery is still pending before anticipating a trend change.
In that case, any bullish reversal from the 20-day EMA or 14.70 static line could be a minor long opportunity, aiming for the 23.87 high volume line. Moreover, overcoming the 24.00 level could be a strong bullish factor for this instrument, opening the room for moving beyond the 30.00 mark.
On the other hand, the price is already trading at the premium zone, while the major market trend is bearish. In that case, any immediate recovery with a daily close below the 14.70 level could be a bearish continuation towards the 3.00 level.
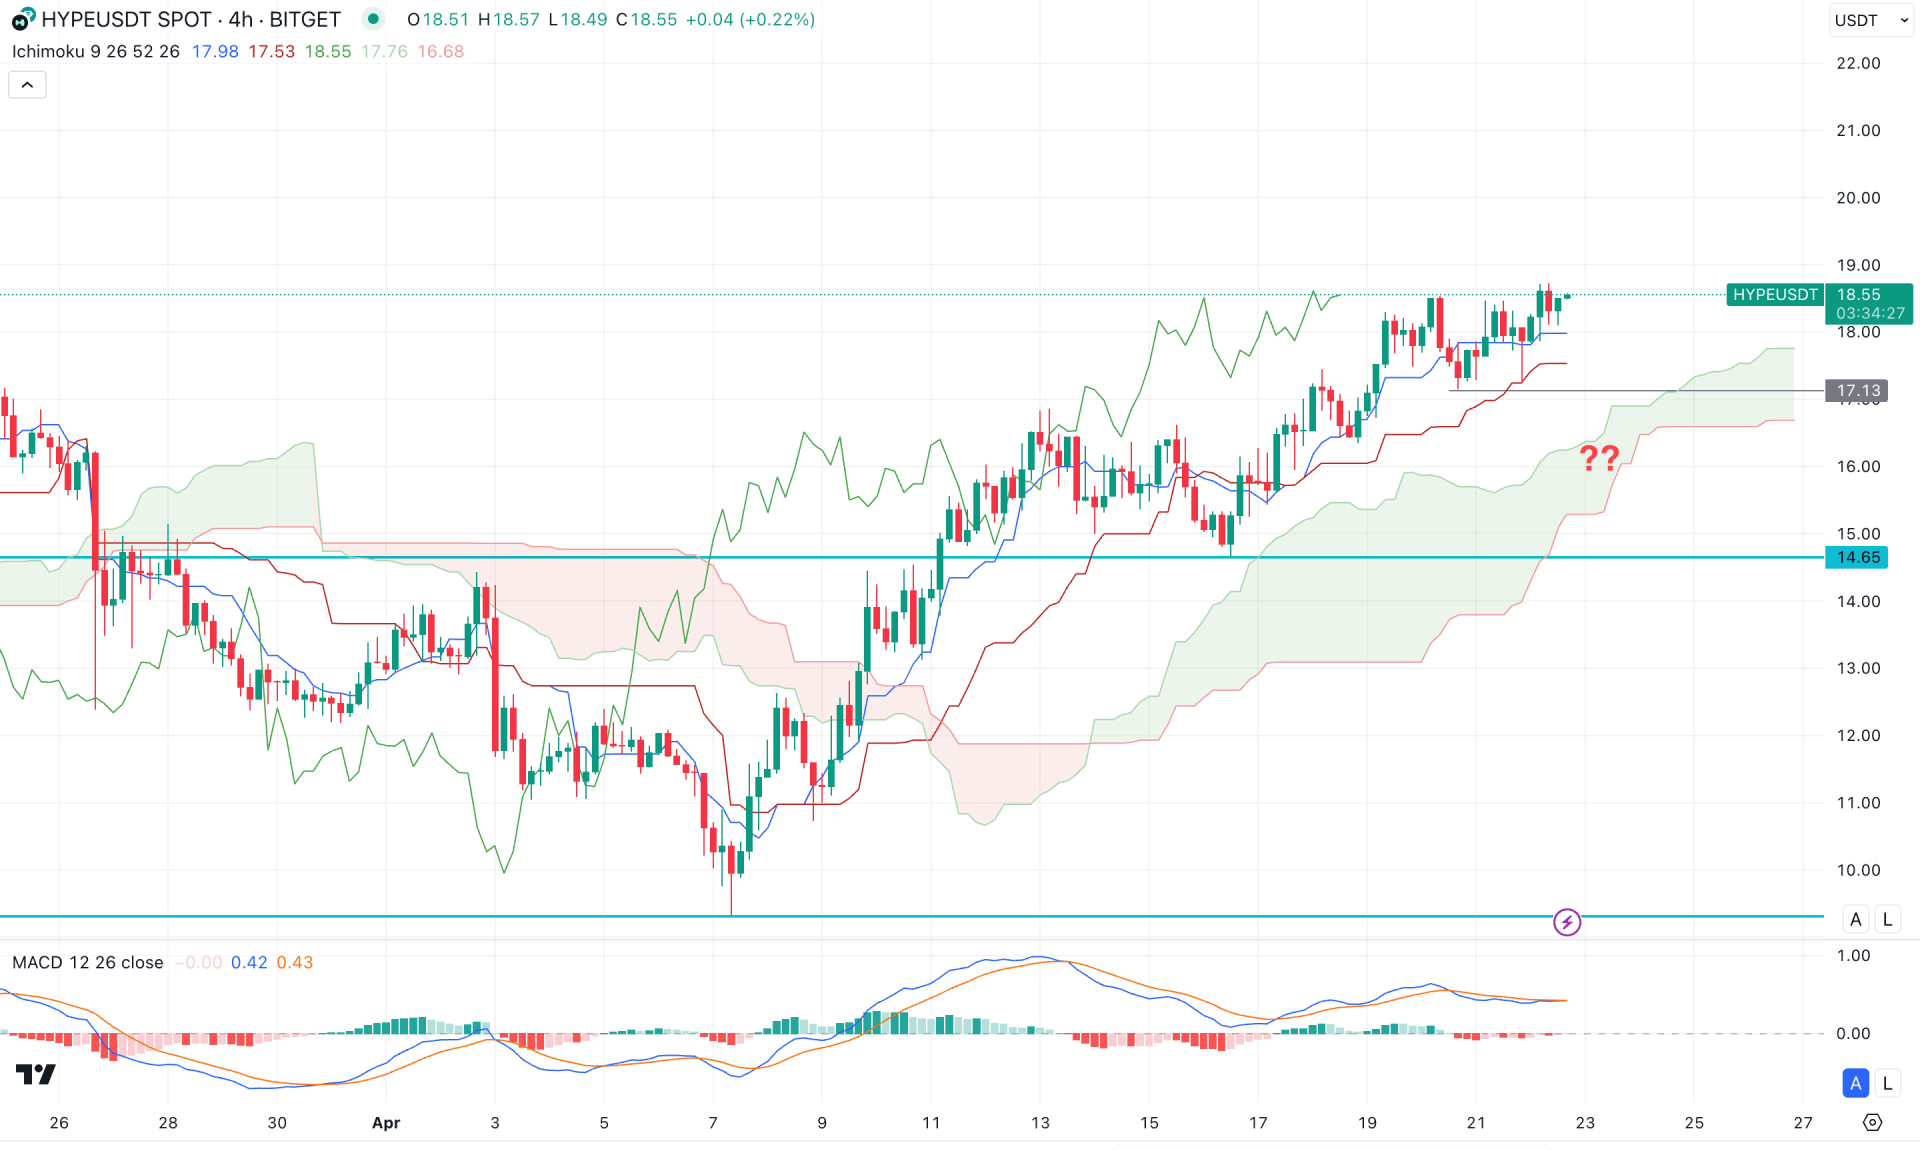
In the H4 timeframe, the recent price is trading higher after forming a recovery from the bearish territory. As a result, an upward continuation is visible above the cloud support, forming a trend change.
Based on the Ichimoku Cloud structure, the dynamic Tenkan Sen and Kijun Sen are below the current price and are working as immediate supports. Moreover, the Senkou Span A and Senkou Span B are below the current price and remain flat.
In the secondary window, the MACD Histogram lost the selling pressure and reached the neutral point. Moreover, the MACD Signal line holds the upward pressure by remaining above the neutral point with a bullish crossover formation.
Based on the current market outlook, the intraday market momentum is bullish for HYPE/USDT, which is supported by rising dynamic support. As long as the 17.13 support level is protected, the upward pressure could extend beyond the 22.00 level.
On the other hand, there are multiple barriers below the current price, where the strongest support zone is the Ichimoku Cloud. Breaking below the Ichimoku Cloud zone, with a redistribution, could be a continuation opportunity, targeting the 9.31 level.
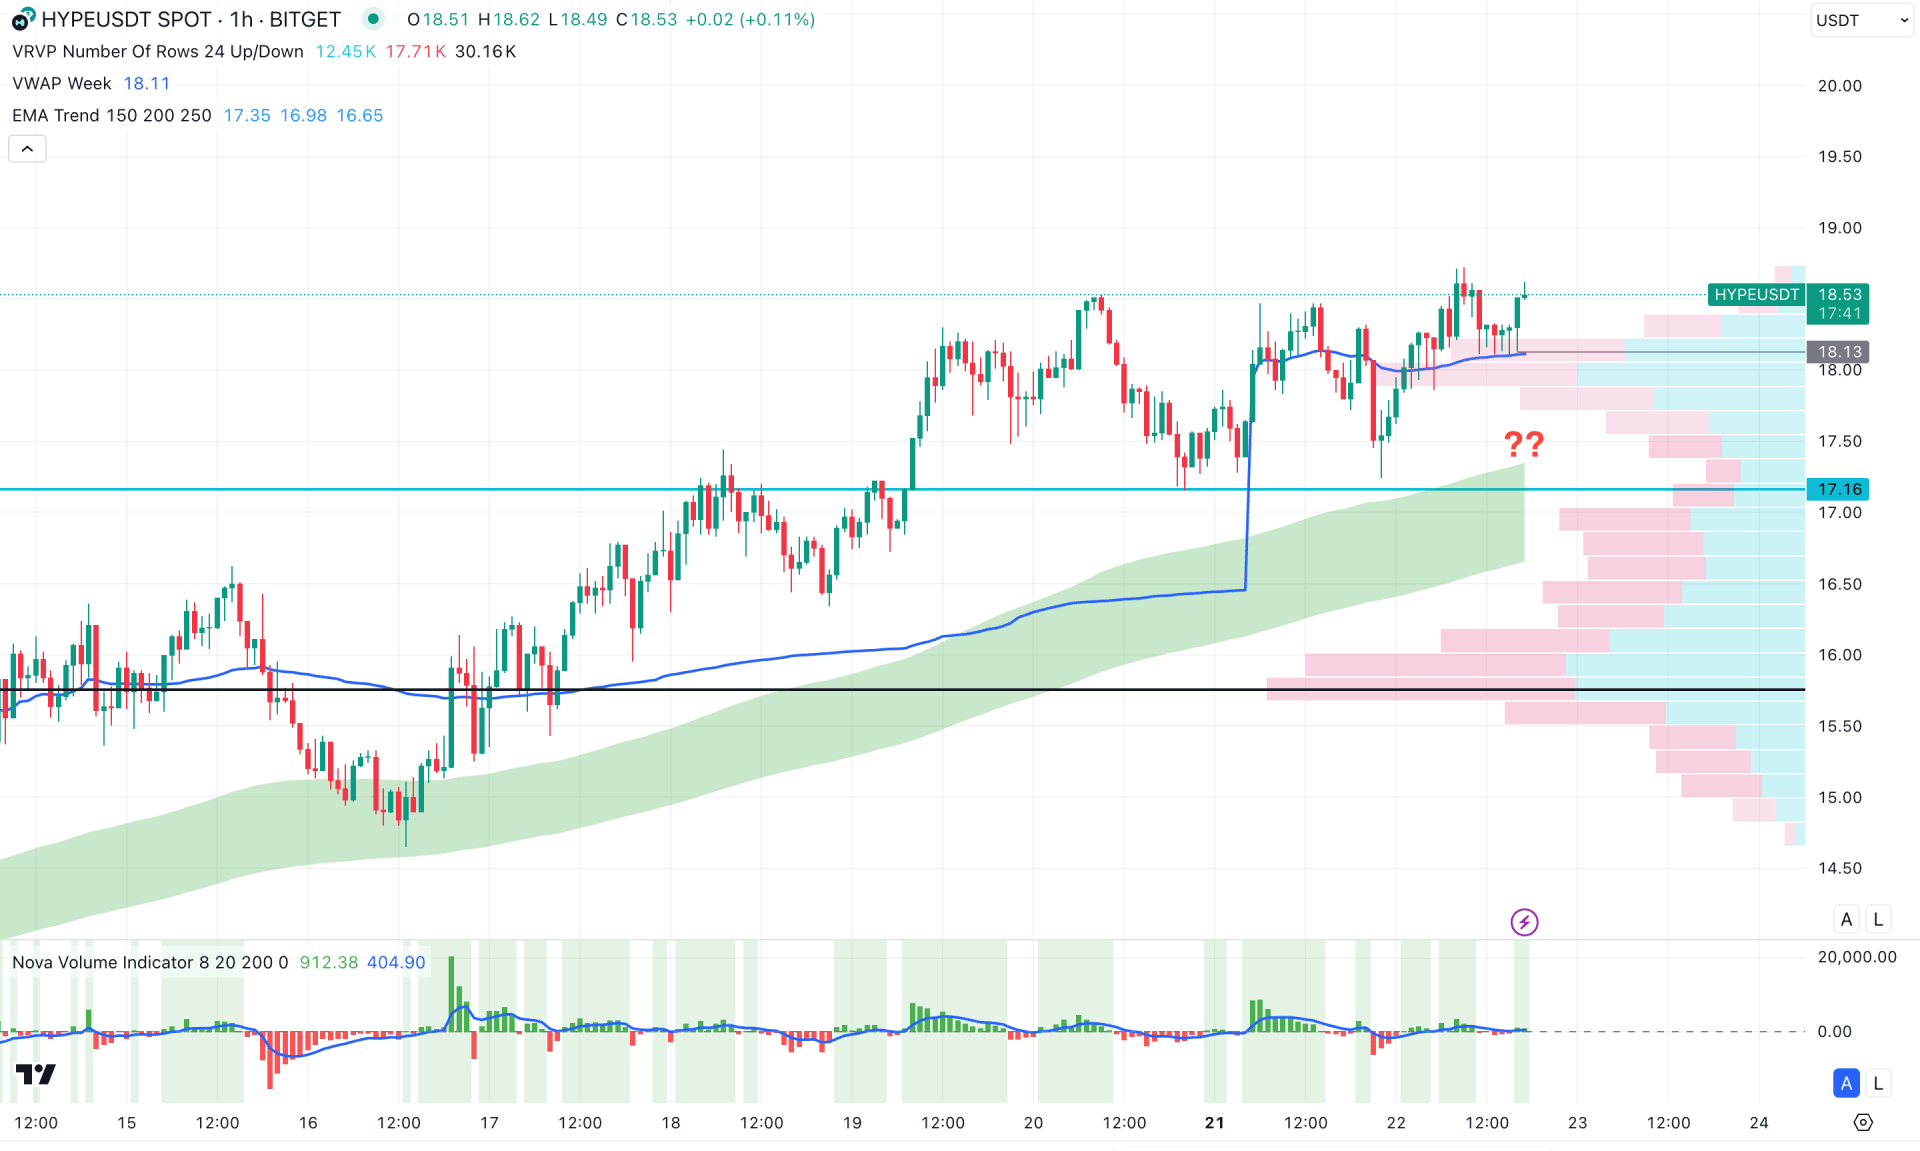
On the hourly time frame, the price is trading bullishly, as recent price action shows a continuous formation of higher highs, supported by the moving average wave. Additionally, the weekly VWAP level is positioned below the current price and aligns with the static support level at 18.13.
In the secondary indicator panel, the volume structure suggests sideways momentum, as no noticeable fluctuations are visible in the histogram.
Based on this outlook, market momentum is expected to remain bullish as long as the 17.16 support level holds. However, a decent recovery above the 18.13 level could present a long opportunity, especially after a rebound around the VWAP line.
On the other hand, extended selling pressure below 17.00 could lead to a decline toward the 15.75 high-volume node, with the potential for further movement toward the 10.00 area.
Considering the ongoing market momentum, the price remains bullish in the short term due to prevailing hype. A short-term long opportunity in the HYPE/USDT may arise from the aforementioned swing low. However, a major bullish continuation will require confirmation on the higher timeframe, as sufficient selling pressure is still pending.


