

Published: October 13th, 2026
Hyperliquid experienced massive buying pressure following recent AQAv2 activation. Under AQAv2, approximately 90% of the yield generated from reserves, after accounting for costs, goes to the protocol's Assistance Fund, which uses the revenue to purchase HYPE tokens.
This development adds a revenue stream for Hyperliquid's HYPE buyback programme. Through AQAv2, the protocol can earn returns on USDC reserves even when those assets aren't used for active trading.
Users can transfer USDC into HyperEVM, with Circle supporting USDC issuance infrastructure and Coinbase serving as the treasury deployer. The reserves are then deployed to generate yield, with part of it returned to Hyperliquid.
If the initial payment of $14.58 million were repeated every 30 days, it would equate to approximately $193 million in annualised revenue. However, this figure represents a projection based on the first payment, not a confirmed annual income level.
Can HYPE continue the gain? Let's see the overall price projection from the HYPE/USDT technical analysis:
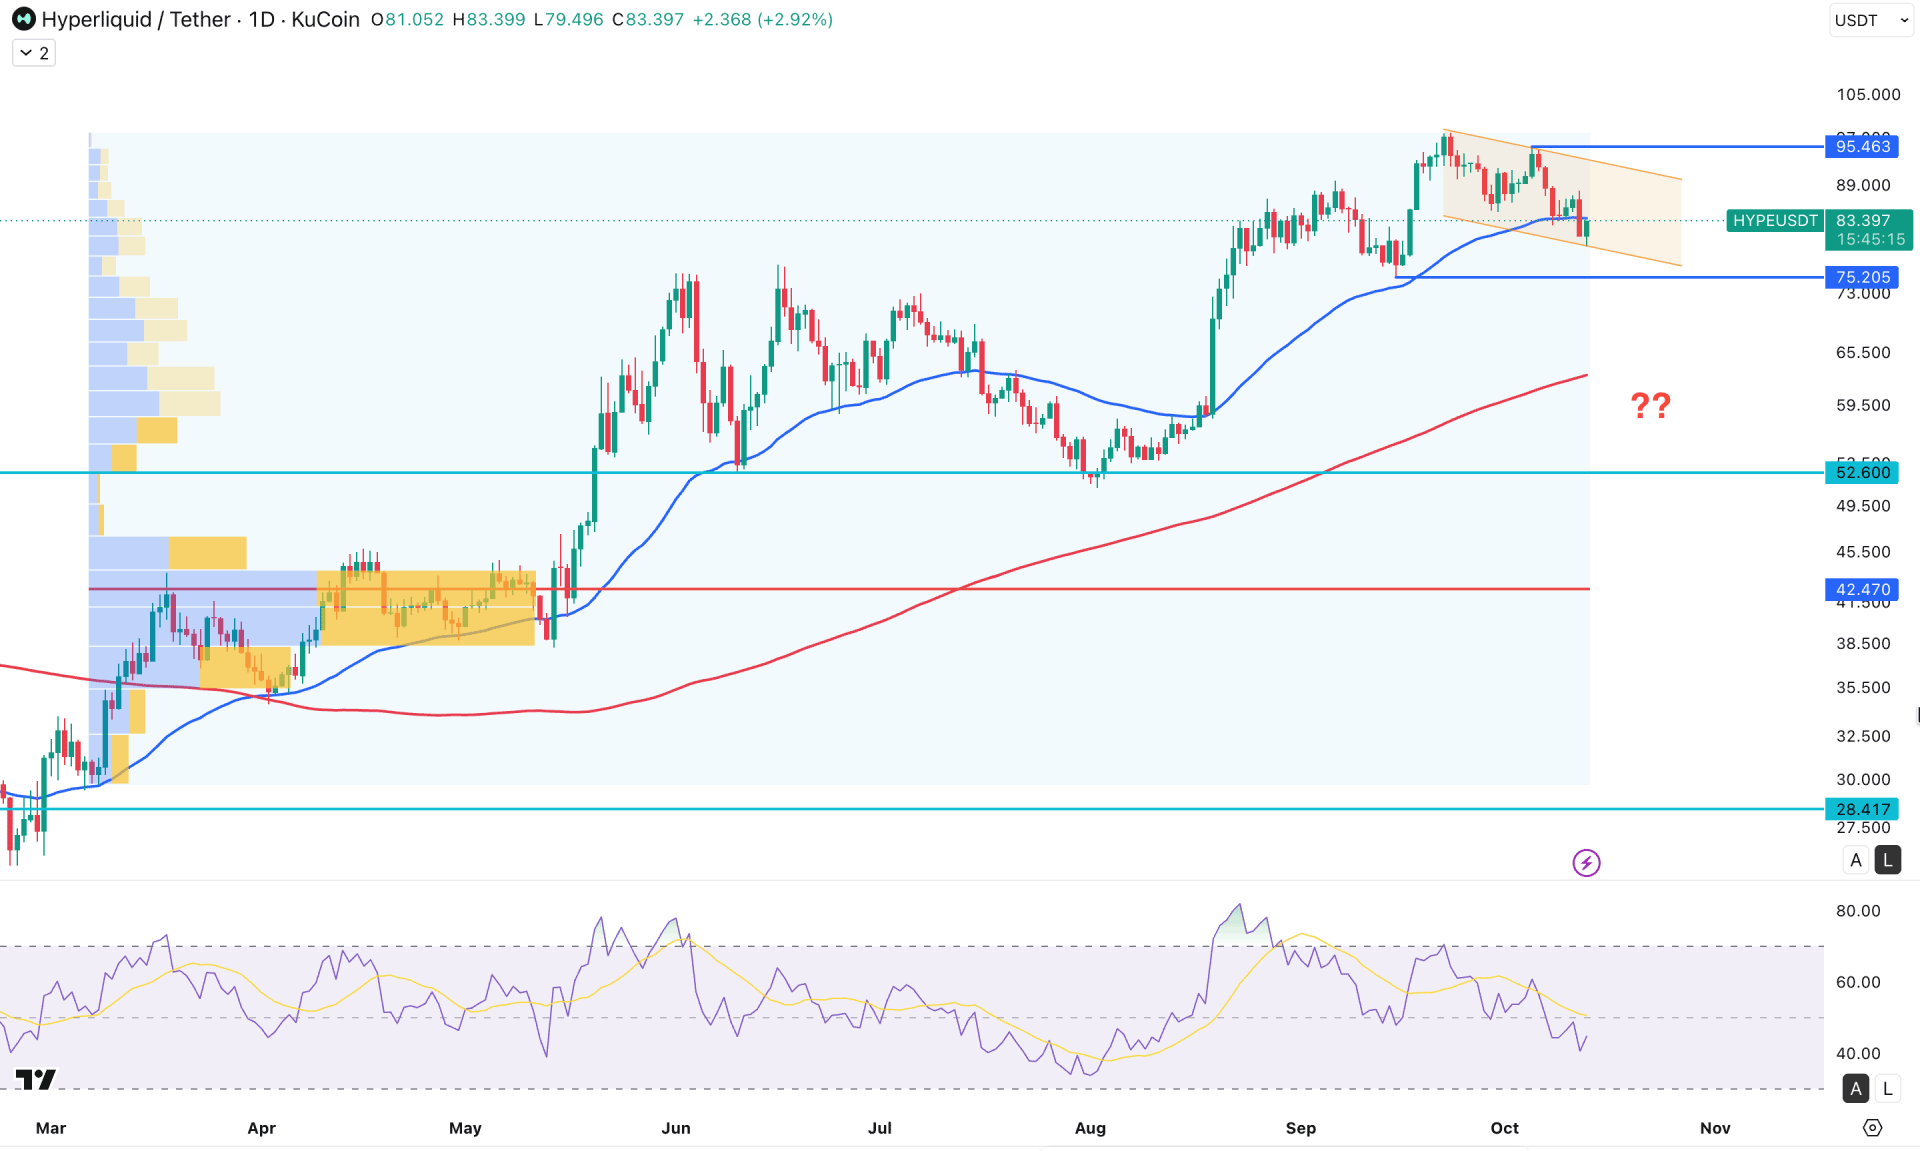
On the HYPE/USDT daily chart, an ongoing bullish trend is visible as the price has kept rising since the beginning of 2026. With no sign of a bearish rebound at the top, we may expect a bullish continuation after valid confirmation.
On the higher timeframe, a bullish trend continuation is visible as price is trading correctively after forming a bullish engulfing pattern on the monthly chart of 2026. The weekly chart shows bearish corrective momentum, as price formed four consecutive bearish candles with corrective market momentum.
In terms of volume, the largest activity level since March 2026 is 42.47, which is well below the current price. Primarily, no significant high-volume activity is seen in the bullish area, suggesting less sellers' activity in the market. In this context, a bearish correction is possible as the gap between the current price and the high-volume line has widened, with no sign of a bearish trend reversal.
In the main price chart, the 50-day EMA is the crucial level to look at as the price has rebounded from this area multiple times since January 2026. Currently, the price is trading below this line, signaling minor sellers' activity in the market, which needs to be overcome before a bullish continuation.
On the other hand, the 200-day SMA is working as a major bullish indicator as it remains below the 75.20 support level with a bullish structure.
In the oscillator, the Relative Strength Index shows sideways momentum, as the current line is slightly below the 50.00 neutral level.
Based on this market outlook, the bullish trend is still valid as the price formed no sign of bearish activity at the top. In that case, a bullish descending channel breakout with a recovery above the 95.46 level could be a highly probable long opportunity.
The alternative trading activity is to monitor the price action at the 75.20 support area. A failure to hold the momentum above this line could signal a decent downside correction towards the 52.60 level at any time.
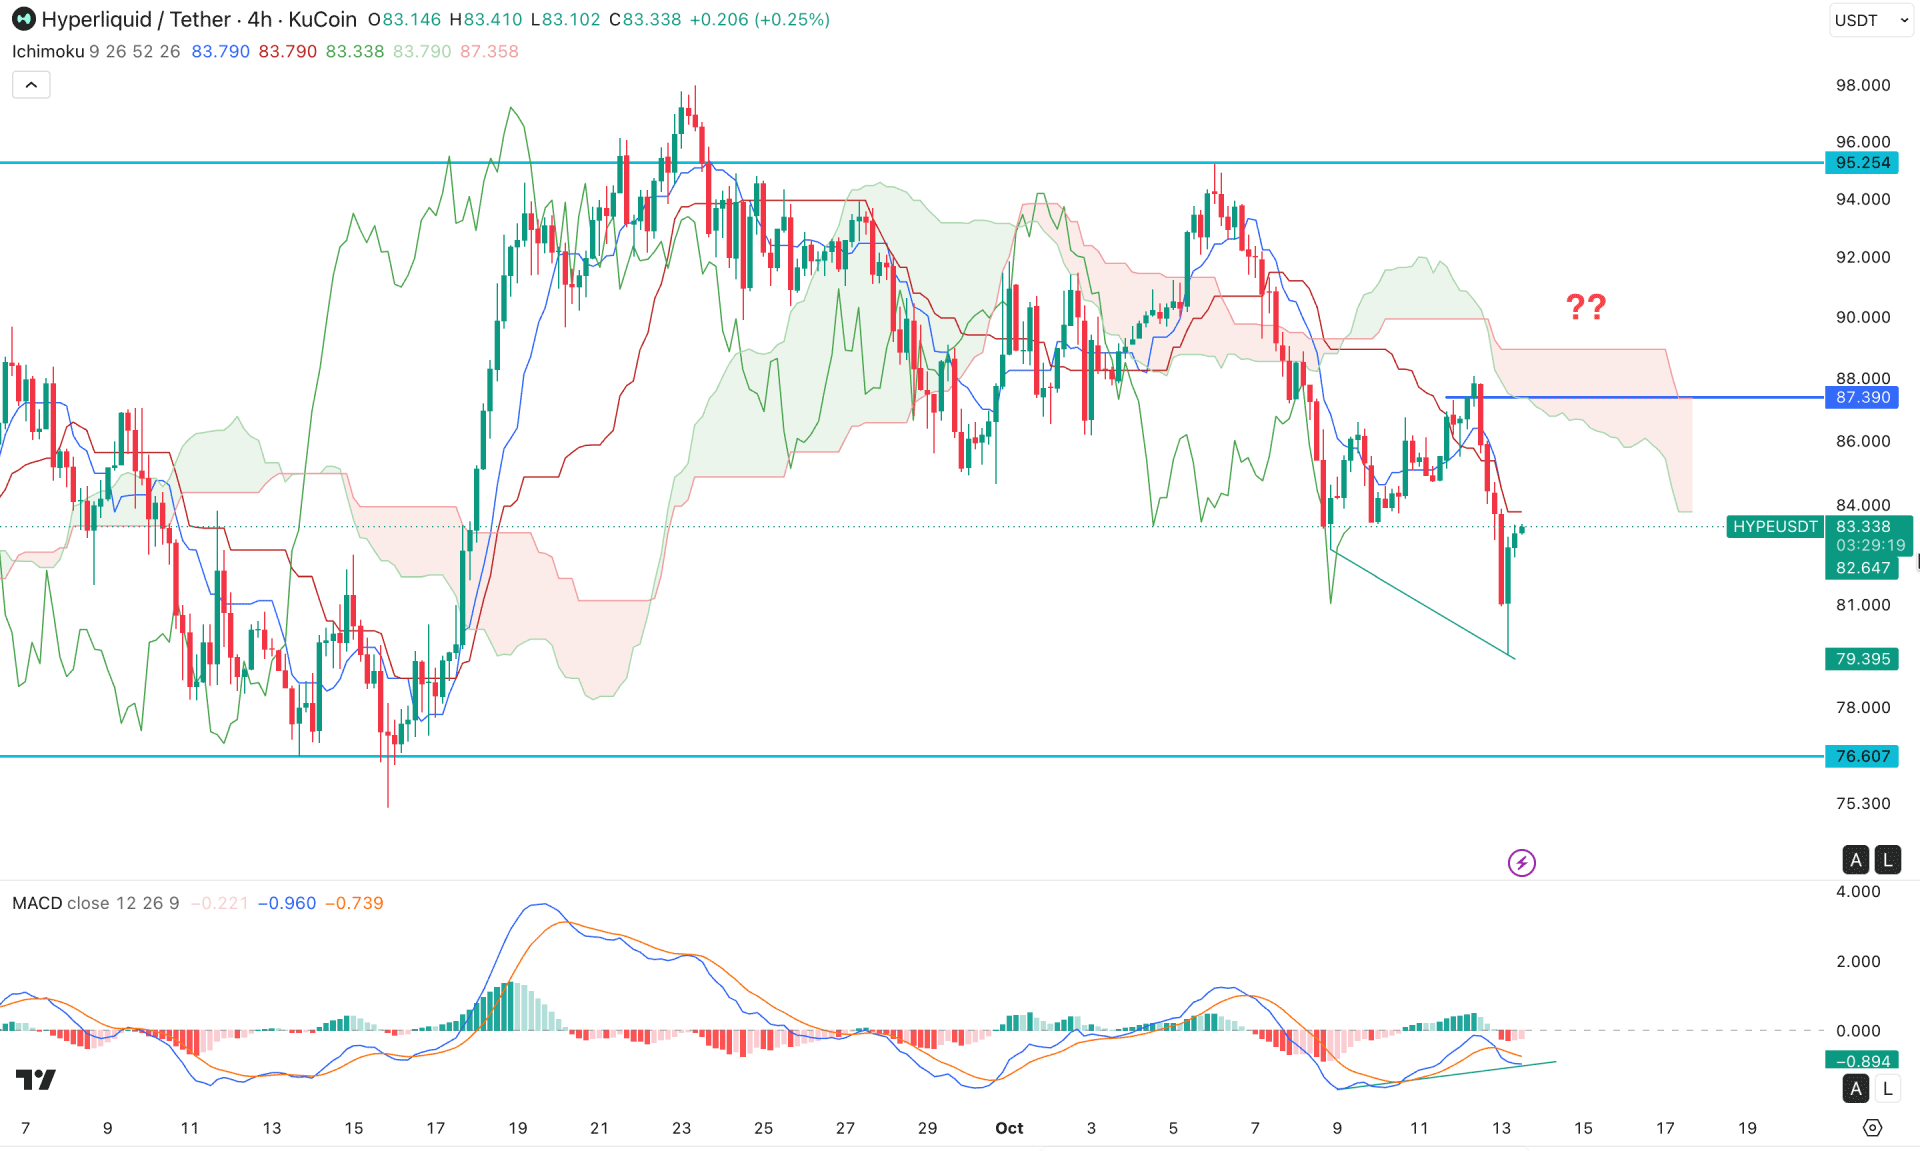
In the four-hour timeframe, HYPE/USDT is trading bearishly as multiple lower lows are visible below the Kumo cloud resistance. Moreover, the future cloud has shifted its position to the sellers' side as both lines are heading lower.
On the other hand, divergence is visible on the MACD signal line, as price formed a new swing that the signal line failed to follow. In that case, a possible base formation is pending before considering a bullish continuation.
Based on this outlook, the key resistance level to watch is 87.39. As long as the price remains below this line, the bearish trend continuation is possible, targeting the 76.60 level. On the other hand, a recovery above the Kijun-sen line, with a four-hour bullish candle above 87.39, could increase the chance of moving beyond 95.25 and testing the 100.00 psychological level.
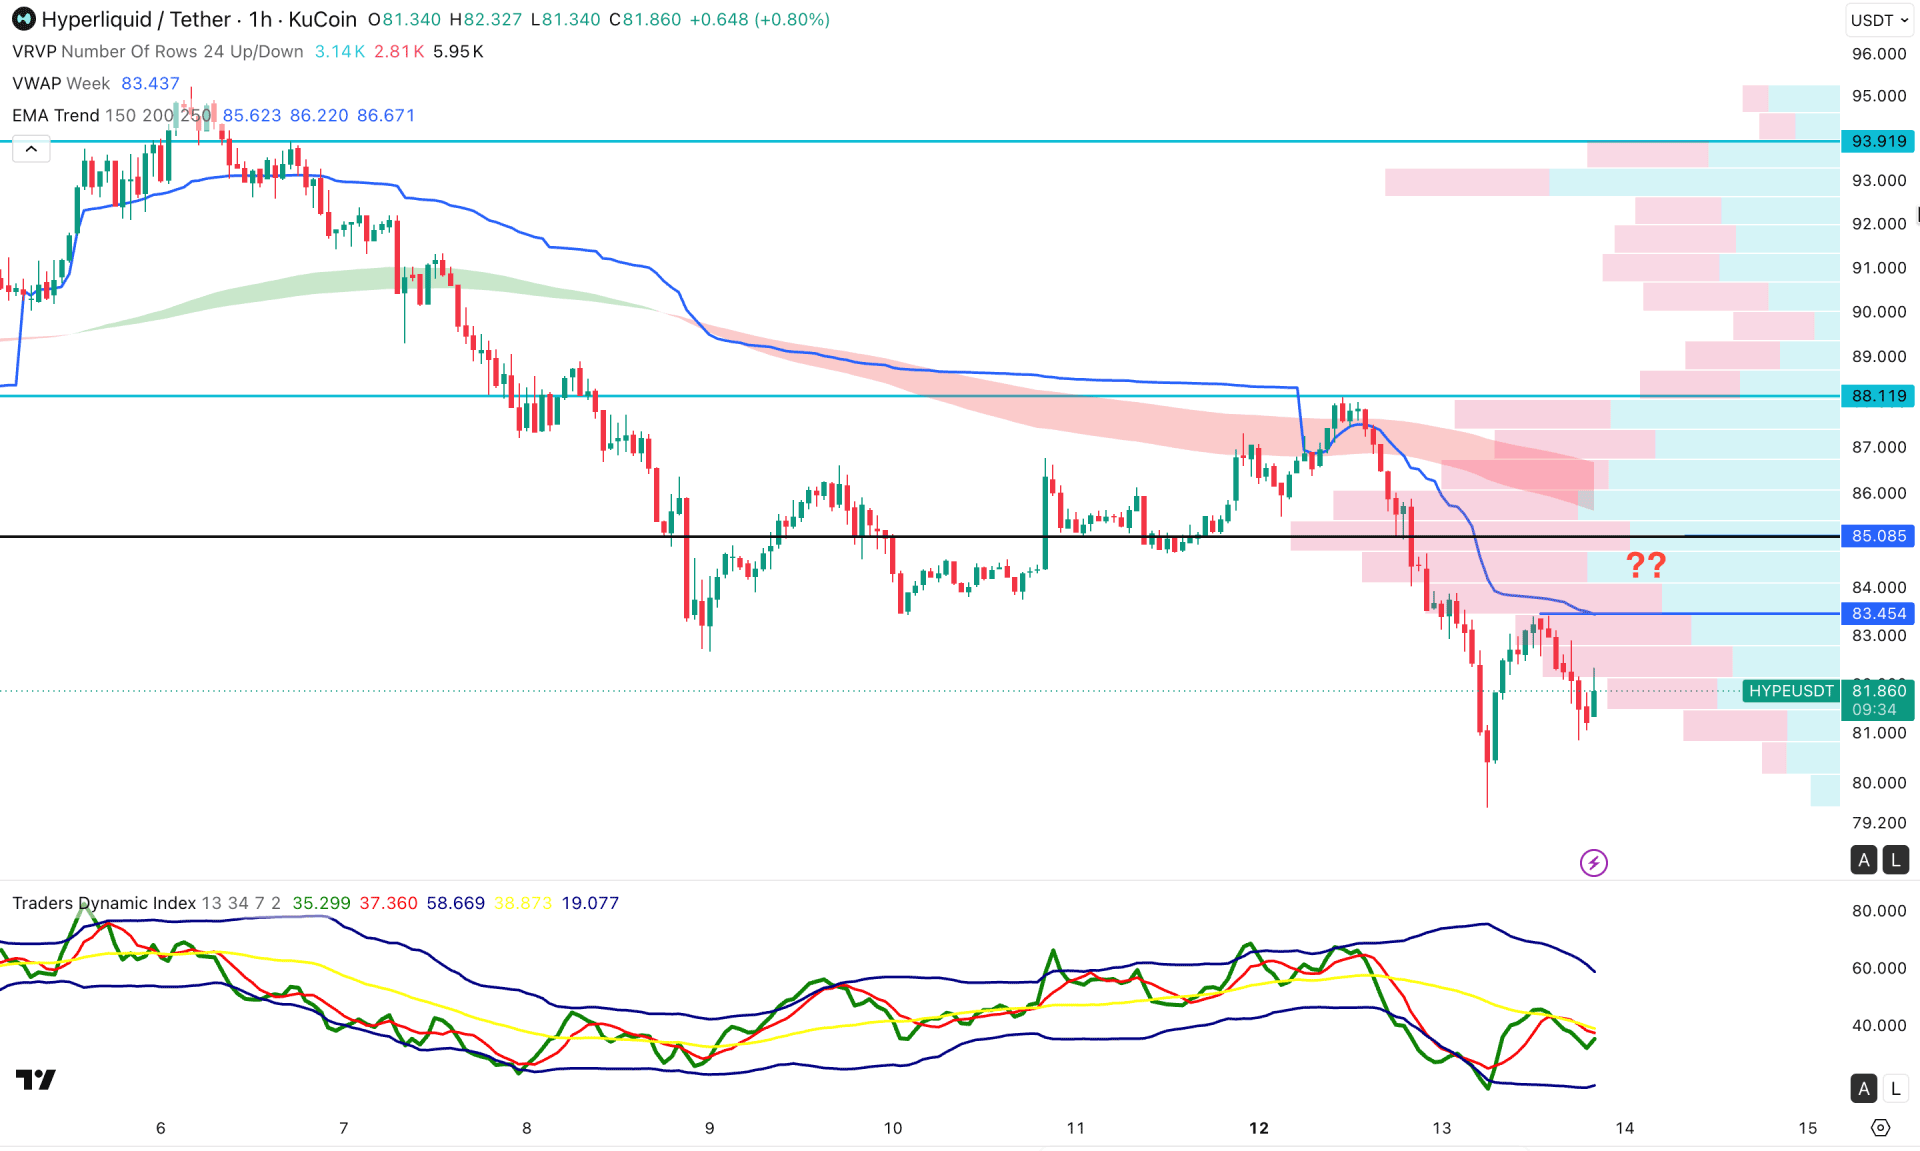
On the HYPE/USDT hourly chart, market momentum is bearish as price remains below key dynamic resistance. Downside pressure could extend as long as price hovers below these lines.
In the secondary indicator window, the Traders Dynamic Index (TDI) shows selling pressure as the current line is below the 50.00 level.
Based on the hourly market outlook, the price is trading with a bearish structure, with no sign of a bullish rejection at the bottom.
In this structure, the ongoing downside momentum remains valid as long as price stays below the dynamic VWAP resistance level.
A massive bullish recovery above the dynamic VWAP level could be the first sign of a bullish recovery. However, a stable price above the 85.08 level could increase the bullish possibility, targeting the 92.00 area.
Based on the overall market structure, HYPE/USDT is trading in a bullish trend, while intraday momentum is bearish. In that case, a bullish recovery that fails to hold intraday selling pressure could be the first sign of a bullish continuation.


