
Published: May 4th, 2022
Houbi Token (HT) is the native cryptocurrency of the global crypto exchange Houbi Global that runs through the Ethereum blockchain under ERC-20 complaints. The main reason for the price change of this token is the reputation of the Houbi Global exchange, besides some other factors.
Houbi Global is juvenile compared to other major cryptocurrency exchanges launched in January 2018. The native token allows investors to trade a wide range of assets while growing the platform itself. If investors use this native token in their regular trading, they would have to pay less commission besides other opportunities like monthly VIP status. Besides, token holders can vote on exchange decisions, receive crypto rewards and participate in special events.
Overall, the future price of this token depends on the number of active users through the Houbi Global platform and their transaction volume. As more people join the platform, the use of the token will be increased, which will work as a price driving factor. Let’s see the future price direction from the HT/USDT technical analysis:
HT/USDT price showed a 221% gain in the mid of 2021 and reached the 39.90 all-time high level before showing an immediate rebound. Later on, the price tried to move up but failed to breach the 17.71 level before moving to the consolidation. In the weekly chart, the price remained corrective from the beginning of 2022, which needs a strong breakout. The weekly RSI is also supportive for bulls, where any sign of a positive RSI above the 50 level would increase the buying pressure on the price.
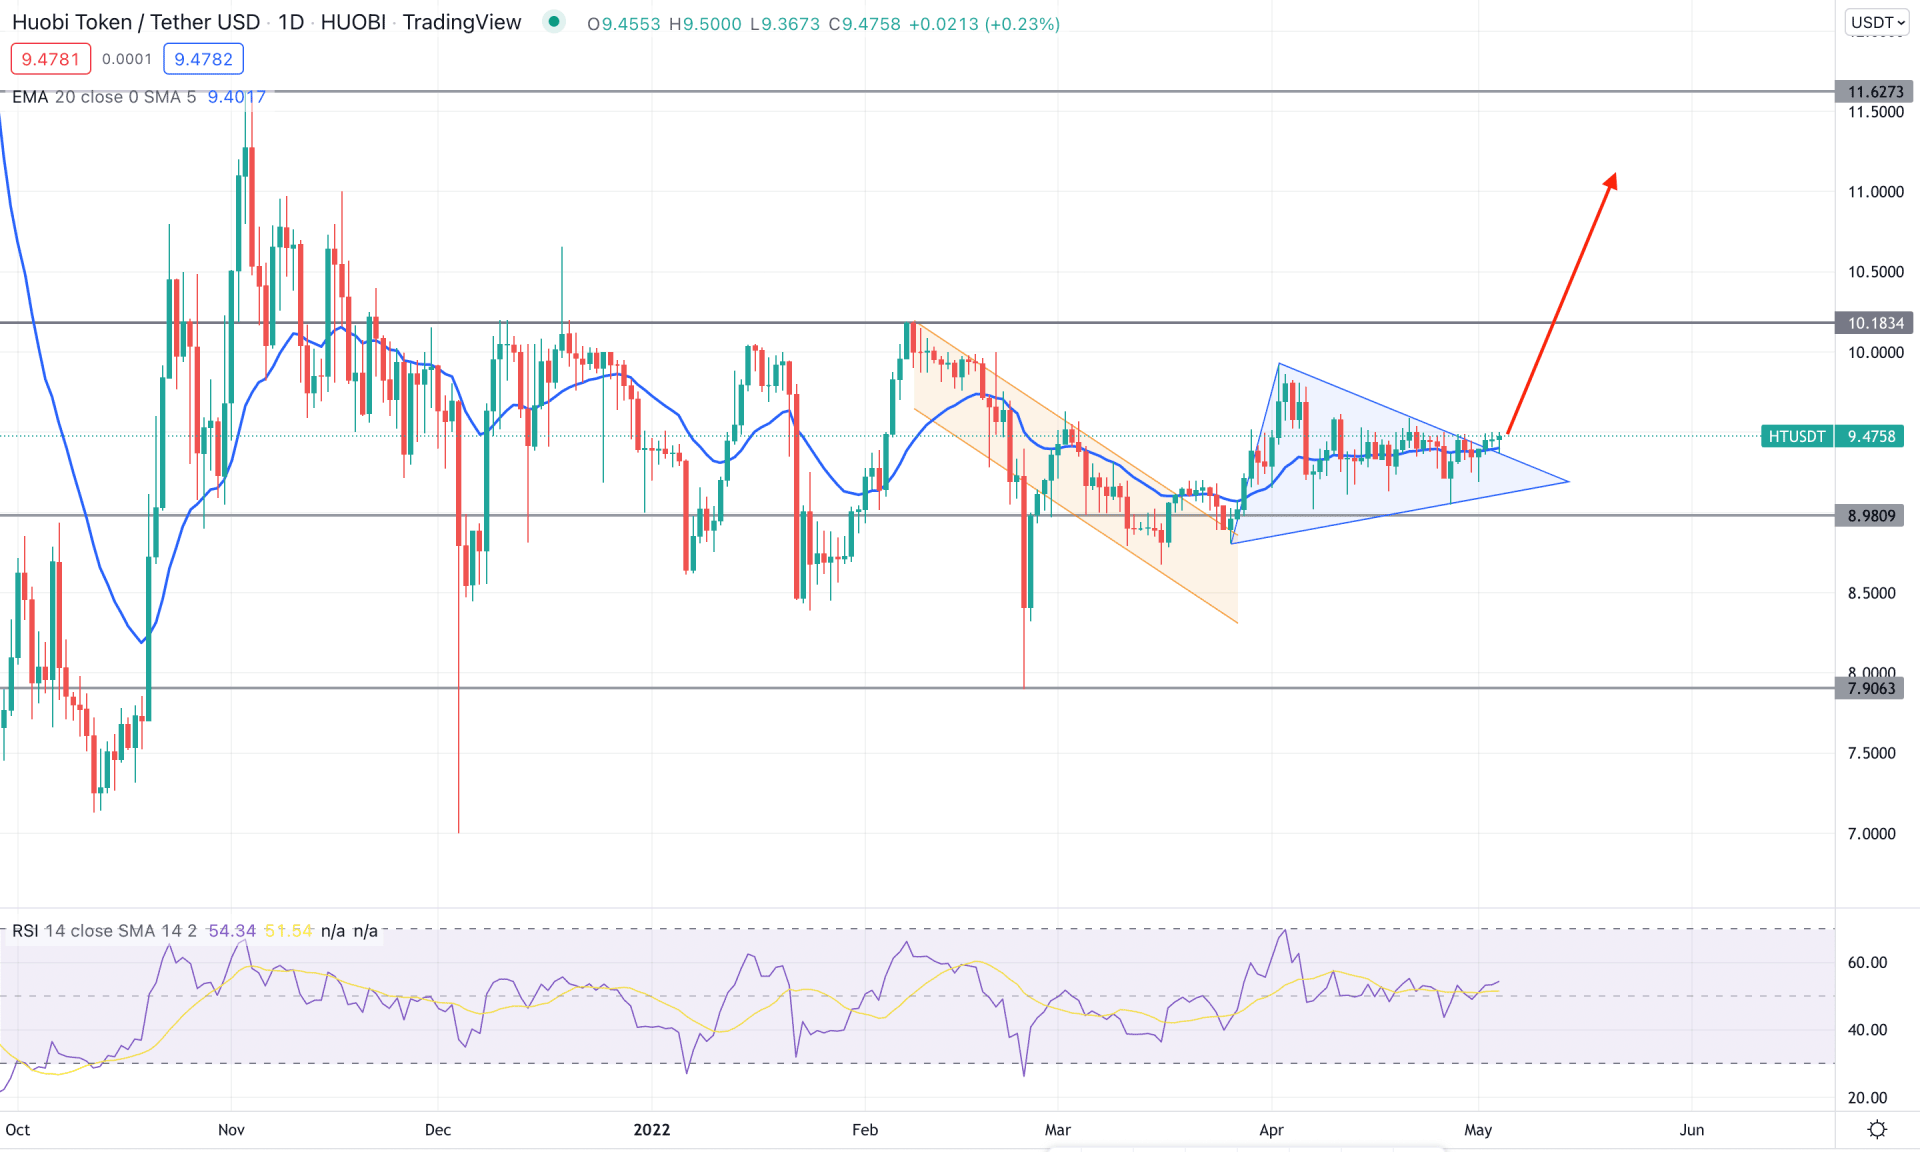
The above image shows the daily chart of HT/USDT, where the recent violation of swing high and low indicates the perfect formation of Wyckoff accumulation. In this scenario, the most recent symmetrical breakout came from the 8.98 spring level from where the big surge is possible. In the indicator window, the RSI remained steady above the 50 level, where any upside pressure in RSI towards the overbought 70 level would increase bullishness to the price.
Based on the daily structure, risk-takers can open long positions from the 9.59 to 9.10 zone based on the daily structure as it trades above the dynamic 20 EMA. In that case, the buying pressure is valid as long as it trades above the 8.98 level that may extend to the 15.17 level. On the other hand, the alternative approach is to wait for a bearish breakout below the 8.70 level to open a short position towards the target of the 7.90 support level.
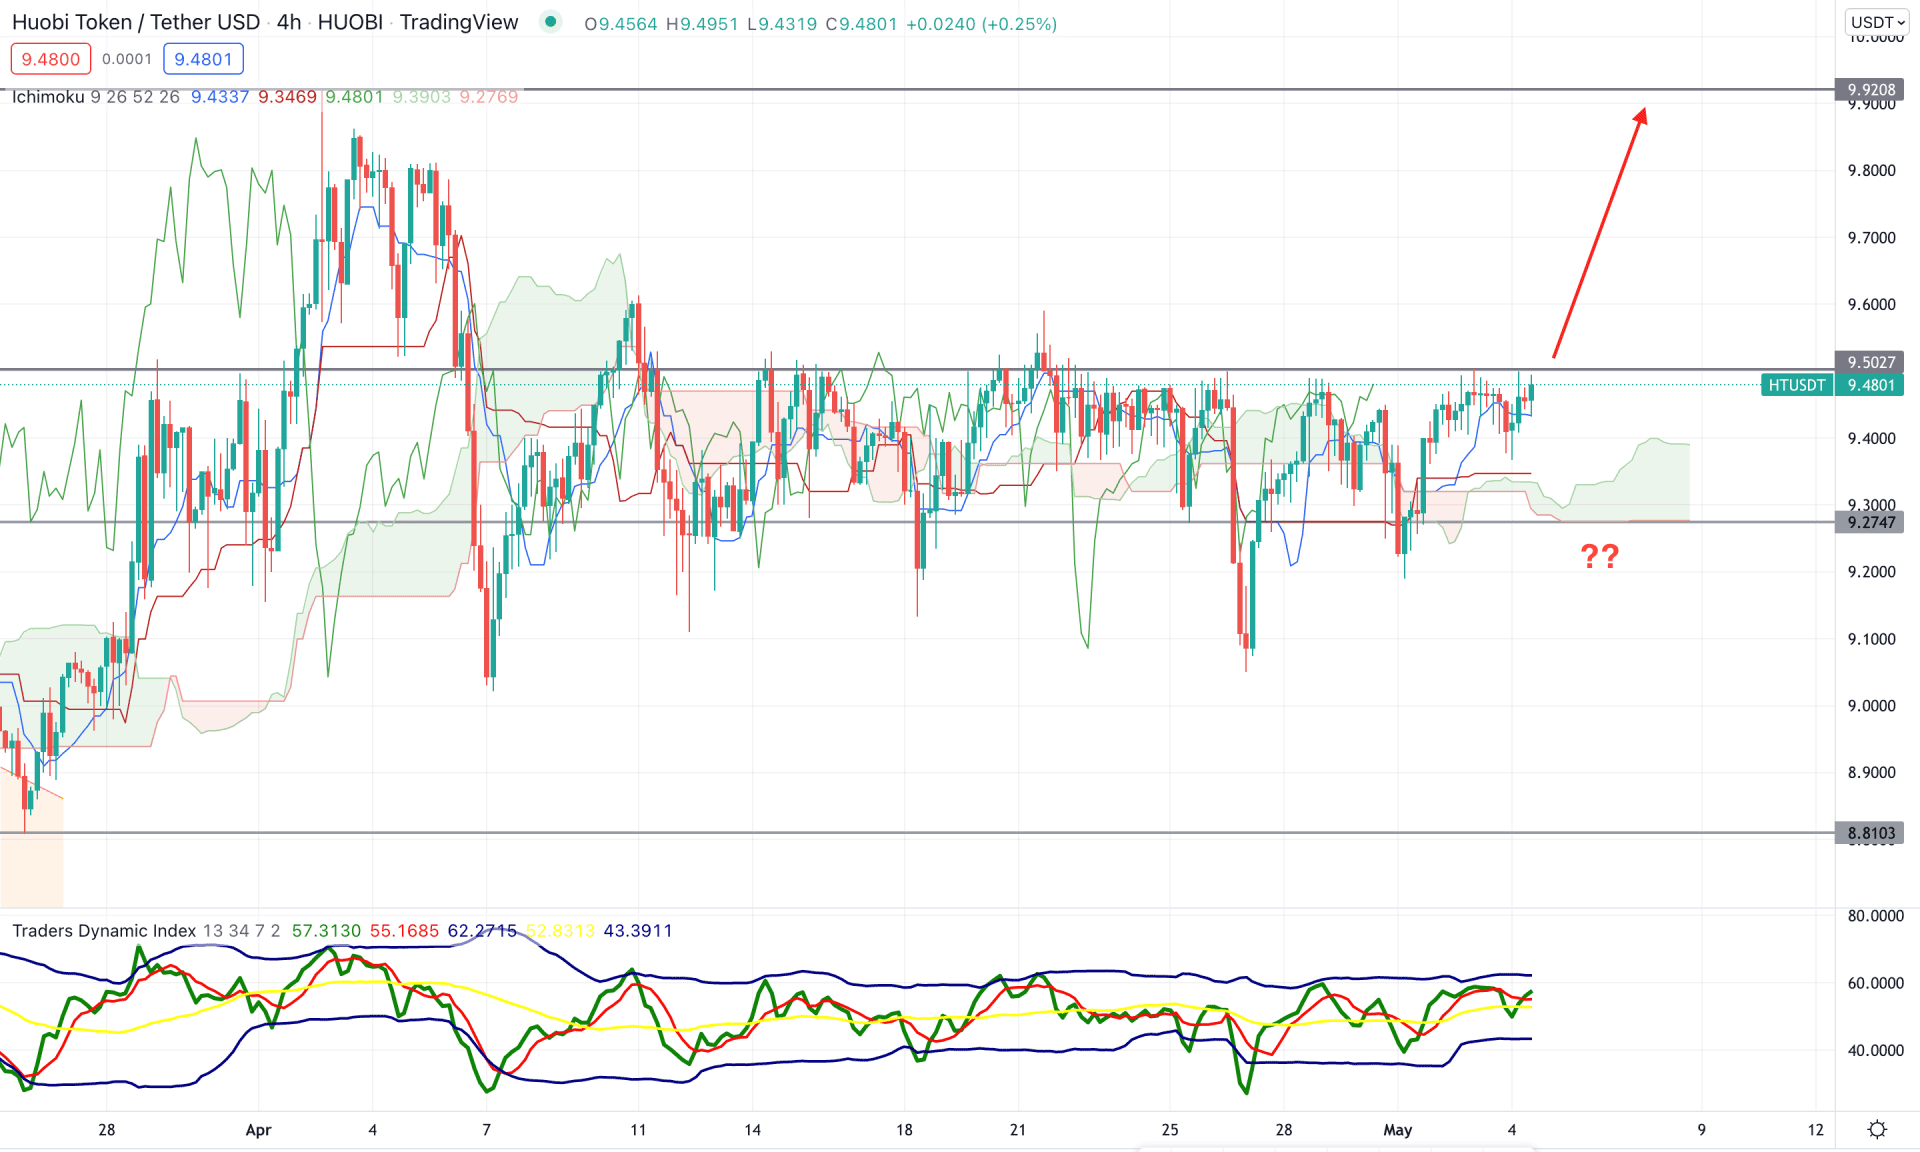
According to the Ichimoku Cloud analysis, HT/USDT consolidates above the Kumo Cloud, while the gap between Senkou Span A and Senkou Span B is higher in the future cloud. Any bullish H4 close above the 9.50 near-term resistance level would increase the price towards the 9.920 swing high.
The indicator window shows buyers' and sellers' strengths where the dynamic green TDI line is stable above the 50 level. Therefore, it is a clear sign that bulls are aggressive in the market where the test of the upper band line is still pending. Meanwhile, the dynamic Kijun Sen remained flat below the price, indicating a corrective momentum, while the Tenkan Sen is working as an immediate support level.
Based on the H4 structure, investors should wait for the price to break above the 9.50 swing high with a bullish H4 close that may extend the buying pressure towards the 9.92 area. On the other hand, bears should wait for the price to move below the 9.27 level before aiming toward the 8.81 level.
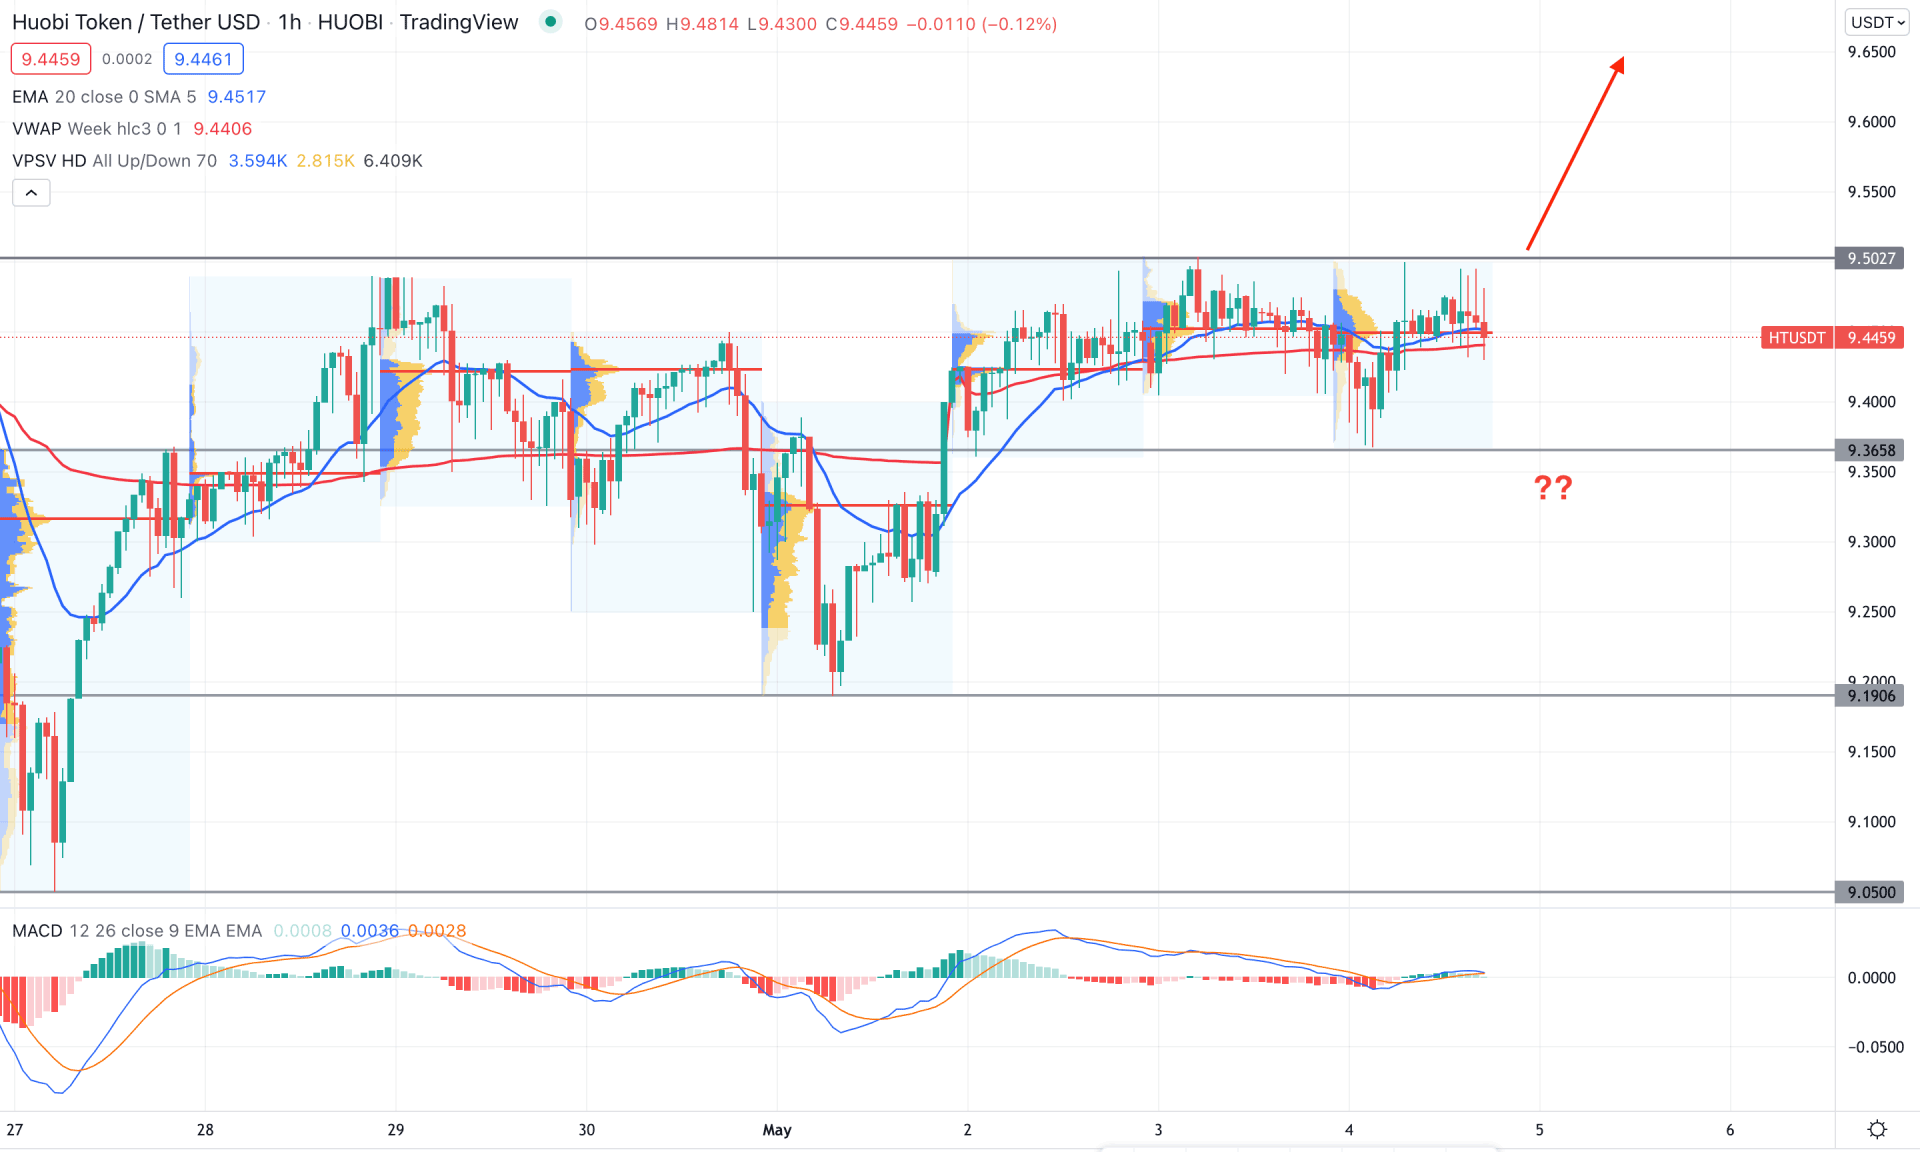
According to the HT/USDT intraday chart, the current price remained within a consolidation between 9.50 to 9.36, whereas the previous price was bullish. A bullish breakout above the 9.52 resistance level has a higher possibility of extending the buying pressure towards the 10.18 resistance level. On the other hand, the dynamic 20 EMA is corrective at the current price, while the gap between the price and intraday high volume level is not high.
The above image shows how the MACD Histogram is corrective at the neutral level while the dynamic weekly VWAP is closer to the price. As the broader market waits for a bullish breakout, an H1 close above the 9.60 level would create early access to the bull run. However, the break below the 9.35 level with an H1 close would increase the bearish correction towards the 9.00 area.
As per the current market context, the bullish pressure in the HTUSD awaits a strong breakout in the intraday H4 chart. However, the broader altcoin market is still bearish and needs closer attention to the trade management while buying an asset. Therefore, the bearish opportunity in this pair is also valid and requires selling signs from the Kumo Cloud breakout.


