Published: November 17th, 2022
Home Depot Inc. is the largest global home improvement speciality retailer based on net sales. As of the end of fiscal 2021, the company has 2,317 retail stores worldwide. It offers a diverse range of proprietary and branded home improvement items, garden and lawn products, building materials, décor products, and related services.
Home Depot Inc. (HD) became noticeable after trading at $120.27 per share on Oct 15, 2015. Since then, shares have reached $314.94, increasing 161.86%.
Some prominent analysts revised their estimated earnings upwards in the last 60 days for fiscal 2023, and the Zacks Consensus Estimate has reached $16.64, increasing by $0.08. Moreover, analysts expect HD earnings to increase by 7.2% for the current fiscal year.
Buying stocks with increasing earnings estimates can be very profitable as stock prices respond to revisions. There is a great chance you'll get into a company whose future earnings estimates will be raised by adding a Focus List stock like HD, which can lead to price momentum.
Let’s have a close look at the complete price projection from the Home Depot Inc (HD) technical analysis:
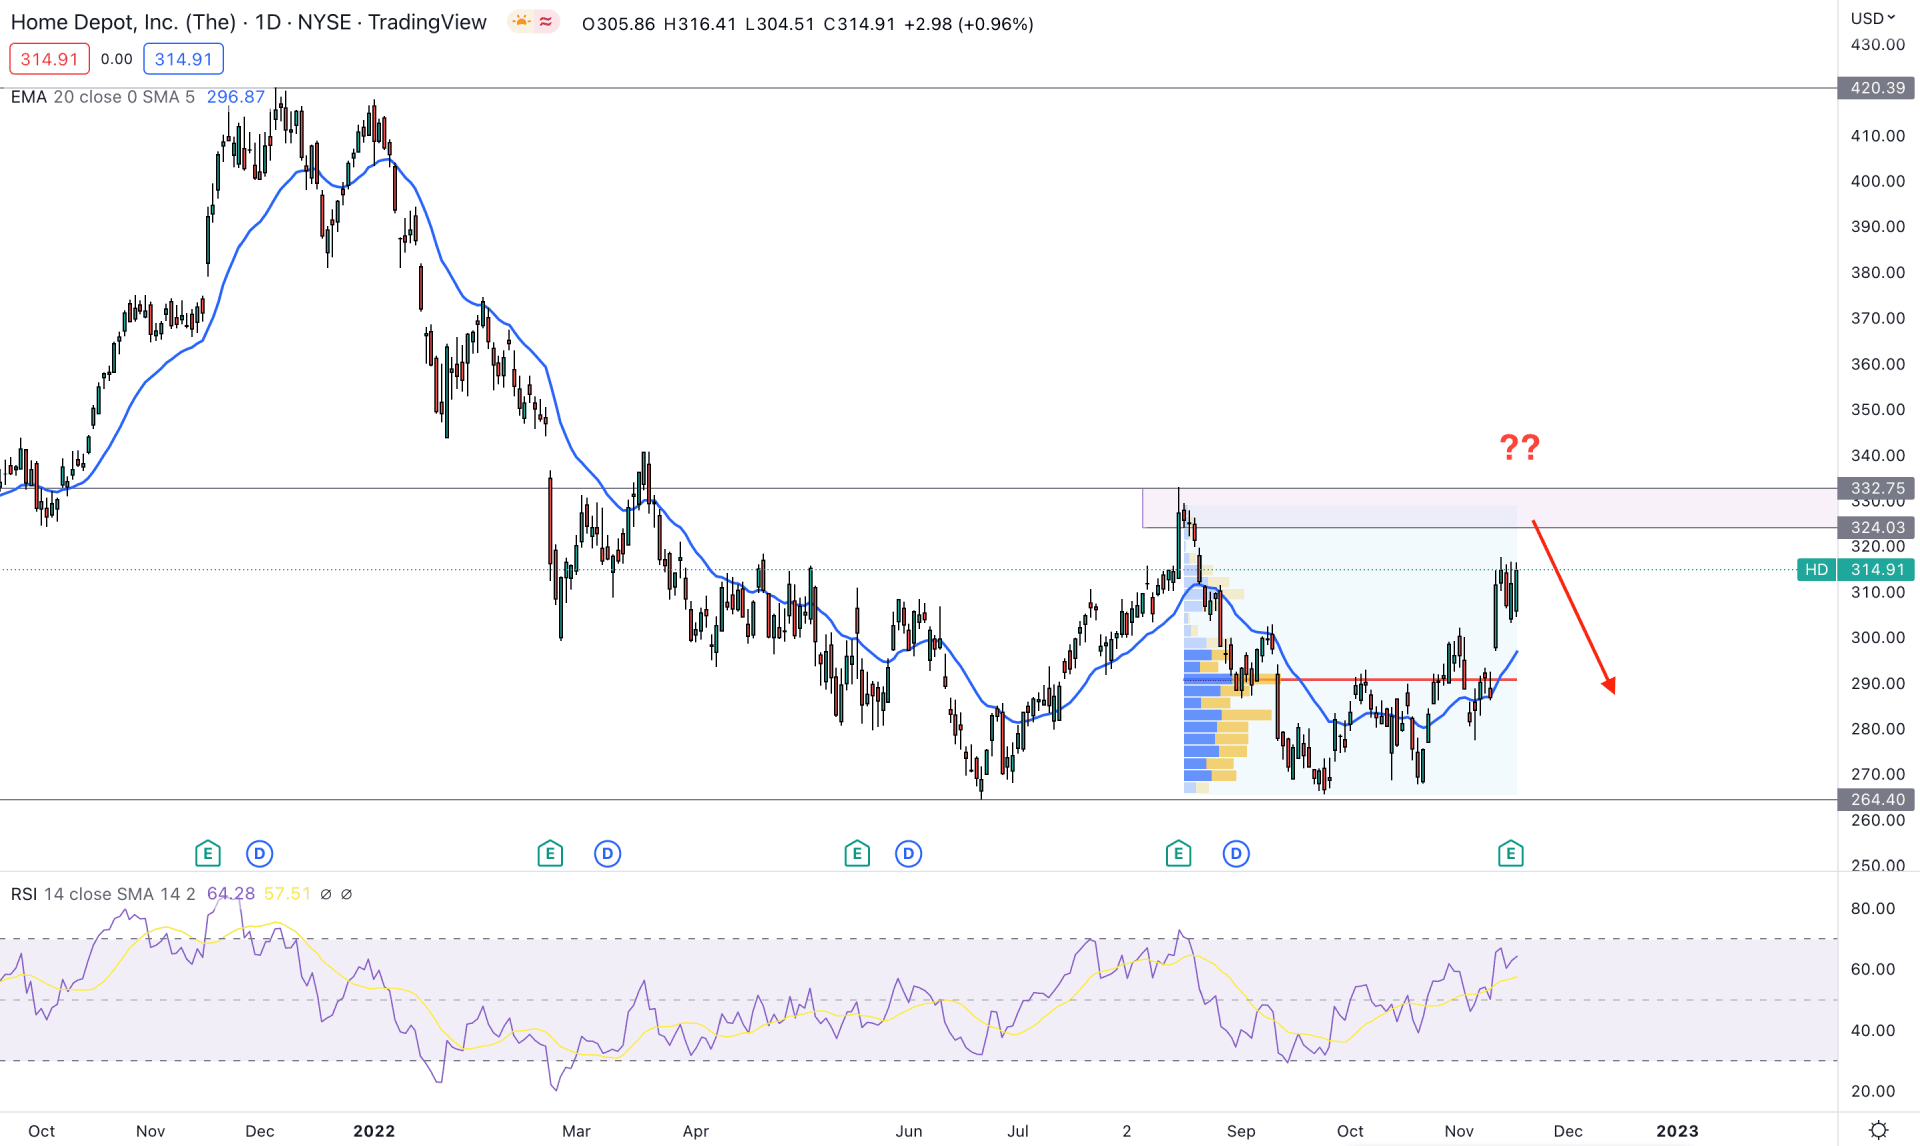
The daily chart shows the Home Depot Stock (HD) trades below the critical supply zone of 332.75 to 324.04. The primary idea of this trading instrument is to look for bearish opportunities until there is a strong bullish breakout. However, the highest trading volume from July high to the September low is recorded at 290.85, which could be a strong support level.
The indicator window shows a buying pressure where the current RSI level remained stable above the 50% area. On the other hand, the dynamic 20 EMA is below the price, while the gap between the EMA and price is higher. In that case, this instrument's minor bearish correction is pending, but any major pullback from the near-term levels could resume the buying pressure.
Based on the current daily price structure, bears should wait for the price to reach the near-term supply zone and form a bearish daily candlestick. In that case, the selling pressure could bring the price down towards the 264.40 key support level.
On the other hand, the alternative trading approach is to wait for the price to complete the minor bearish correction and form bullish candlesticks at the 20 DMA area. In that case, bulls may extend the pressure towards the 400.00 area.
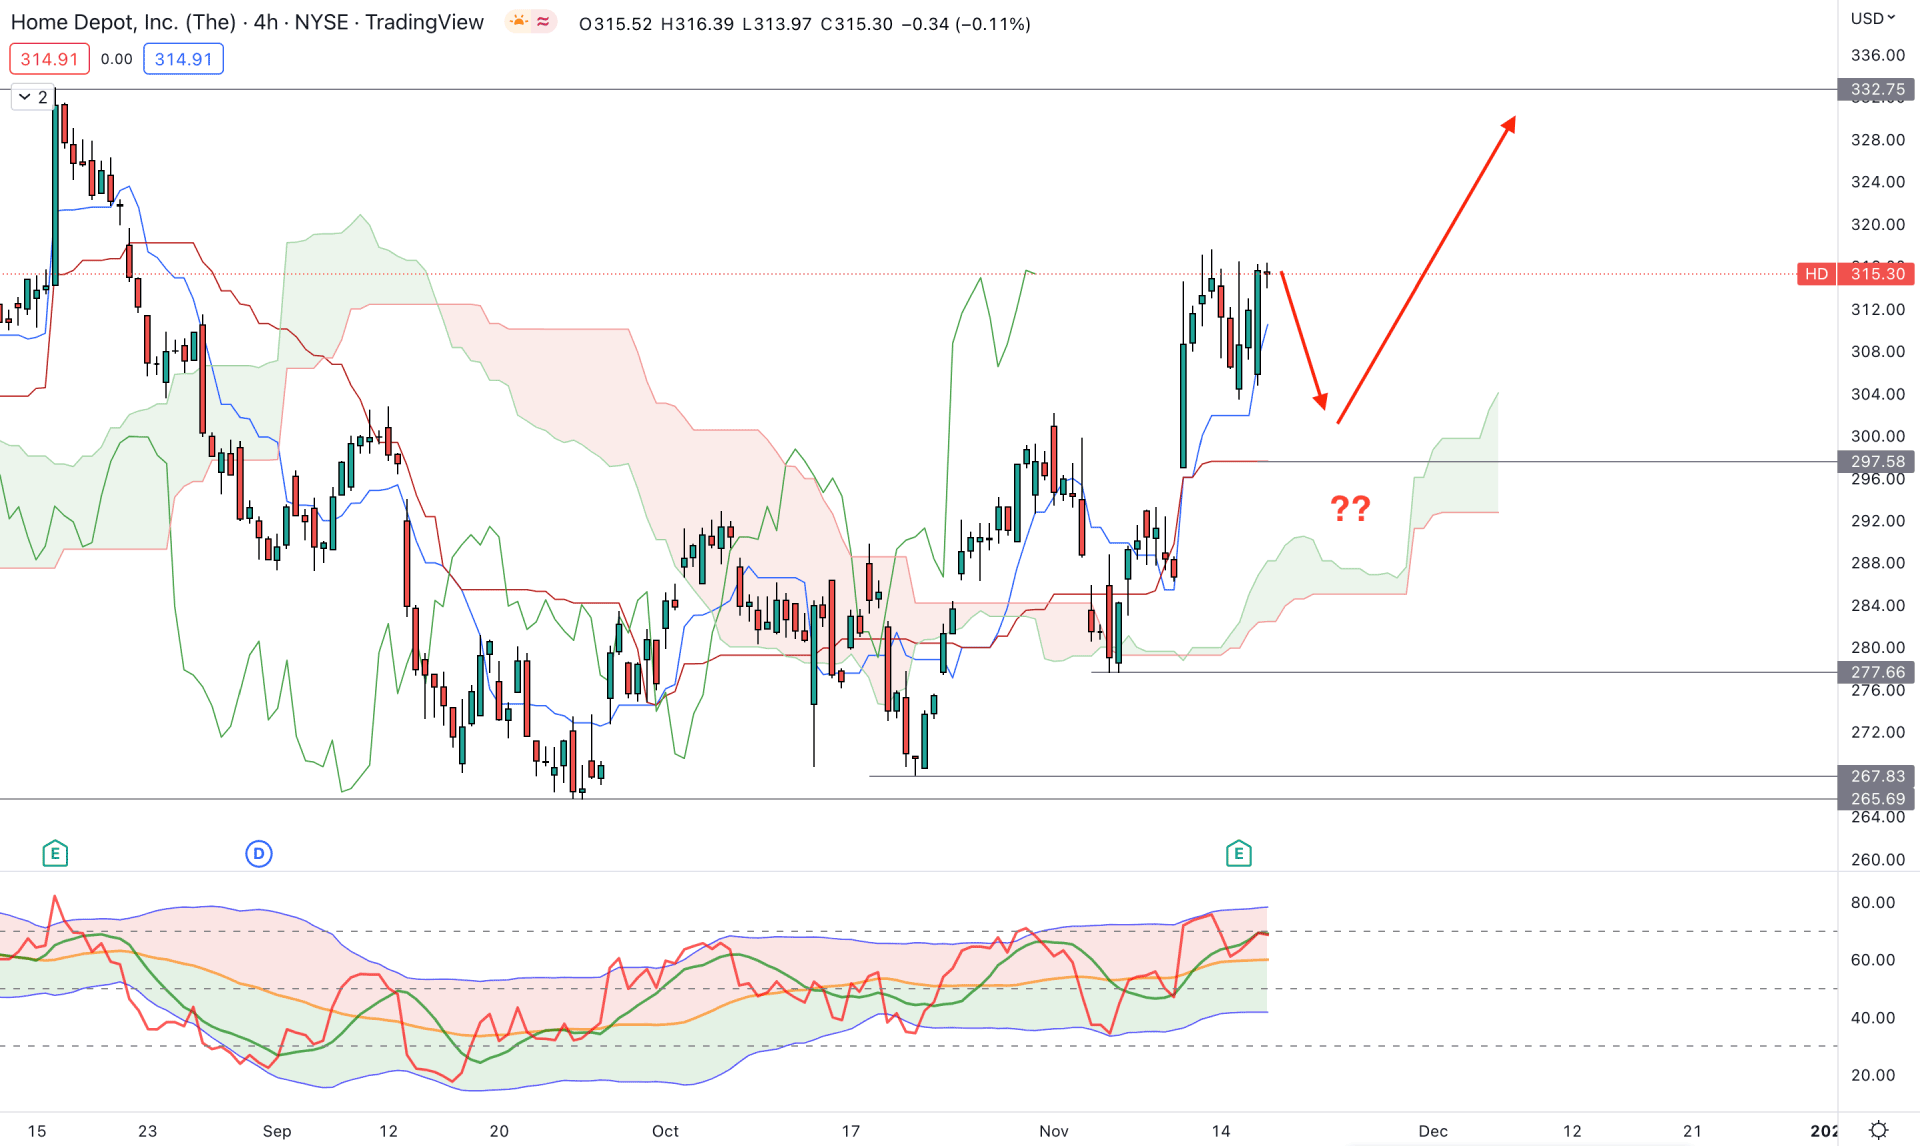
In the H4 timeframe, the current outlook for this instrument is bullish as it is trading above the dynamic Cloud support. Moreover, the Tenkan Sen and Kijun Sen are below the price, supporting bulls.
In the future cloud, the buying possibility is solid as the Senkou Span B (red line) is below the Senkou Span A (green line). It represents a story where short-term and medium-term bulls are active in the market, and short-term bulls are more aggressive than others. In that case, the buying possibility is solid as long as the price trades above the dynamic Cloud support area.
The indicator window shows the same story, where the current Traders Dynamic Index (TDI) is above the 50% area, indicating that buying pressure is more solid in this instrument than selling pressure.
Based on the H4 outlook, the bullish possibility in this instrument is strong, where any minor bearish correction would open a long opportunity. On the other hand, the break below the 277.66 level could eliminate the current bullish structure and open a short opportunity, targeting the 250.00 level.
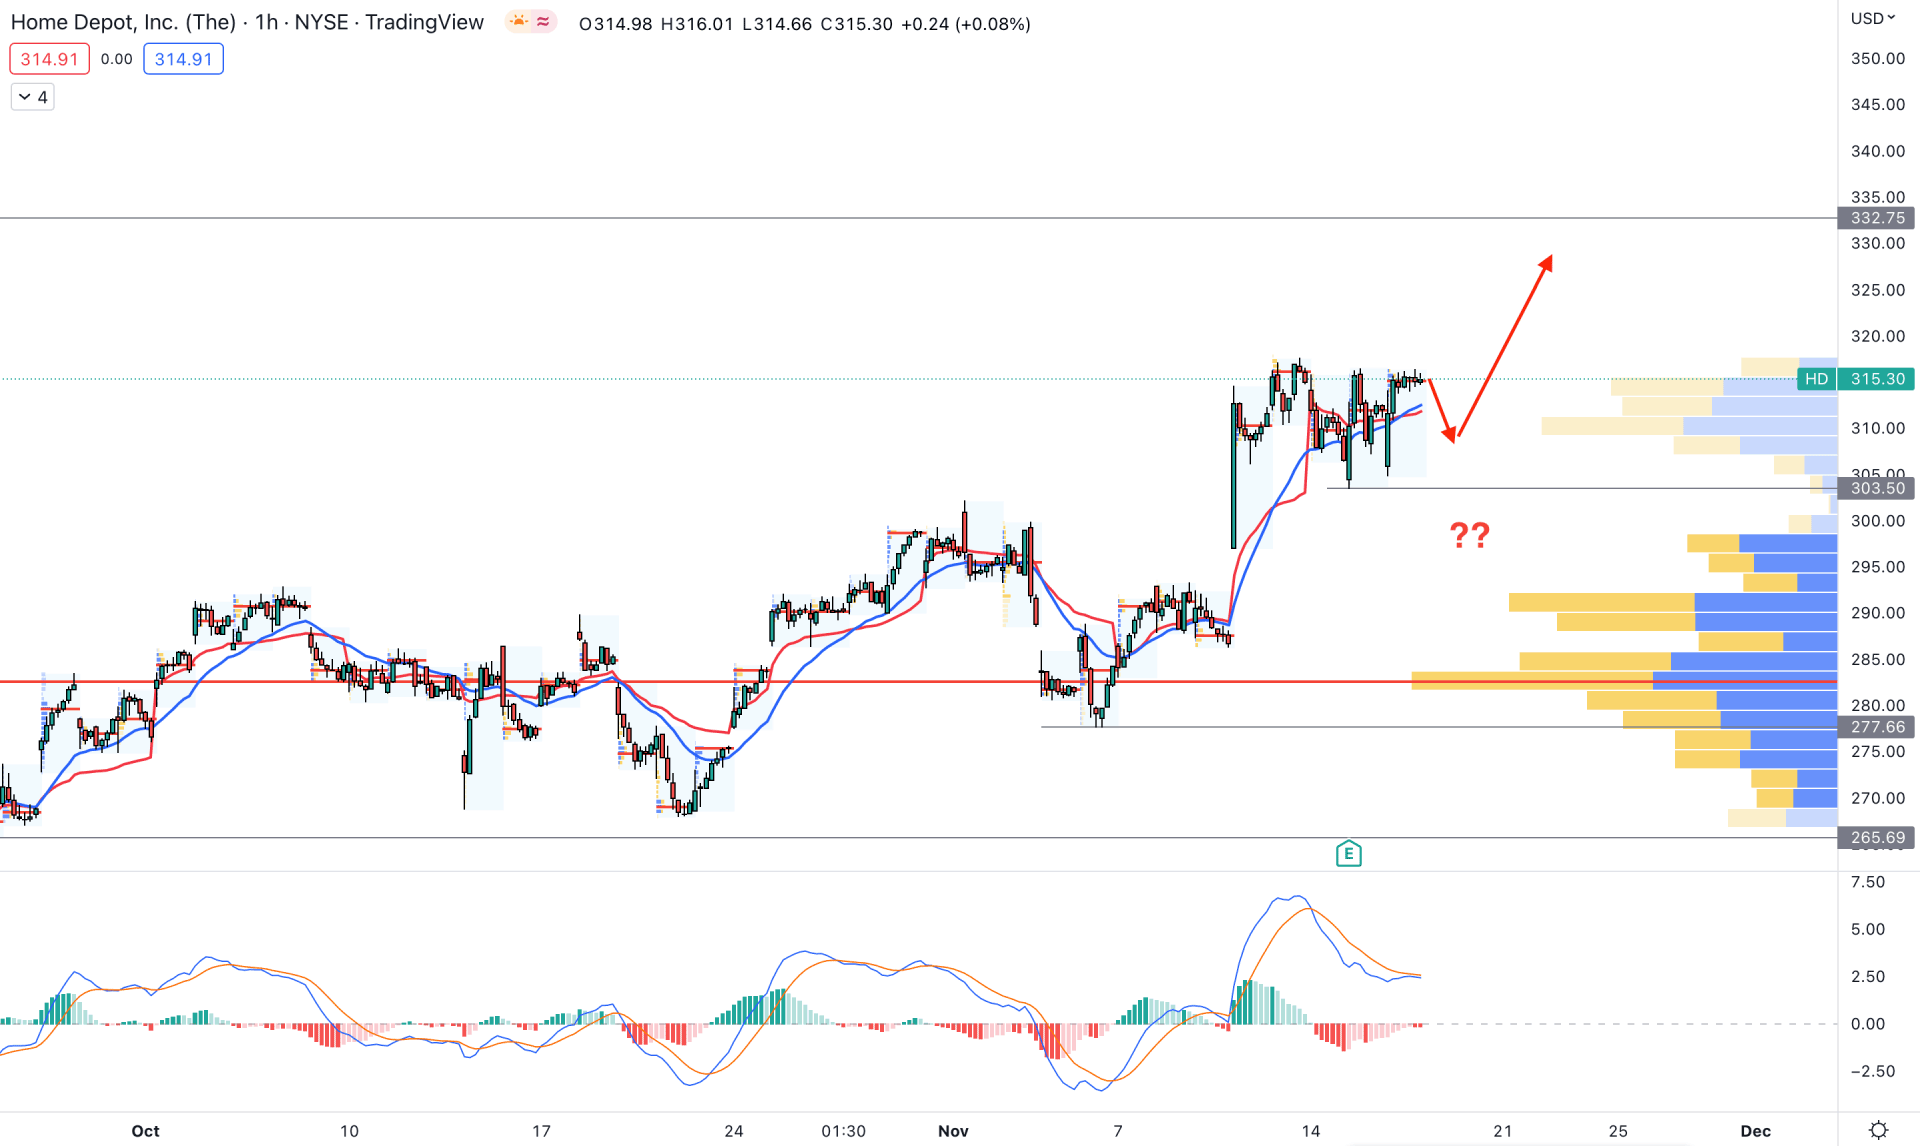
In the hourly chart, the HD price is trading within a buying pressure as the visible range high volume level is below the current price. Moreover, the dynamic 20 EMA and weekly VWAP are closer together, providing buying pressure on the price.
In the indicator window, the MACD Histogram shifted its position to the neutral zone, where an upside possibility is pending with a bullish crossover in MACD lines.
Based on the current price outlook, an immediate buying opportunity is available where the invalidation level is at 303.50 with some buffer.
On the downside, breaking below the 300.00 level with a strong H1 close could lower the price towards the 260.00 area.
Based on the current technical and macro outlook of HD, the bullish trend needs a stable momentum above the near-term supply zone, where the ultimate target is the 420.39 resistance level. On the other hand, bears are still active in the market and can grab the wheel at any time.


