Published: August 6th, 2024
Despite a general downturn in the Decentralized Physical Infrastructure Network (DePin) industry, Helium's HNT coin has grown rapidly.
Helium's HNT, on the other hand, has increased by a remarkable 41.0% in the last month. Although the network's path to success was not easy, the increase in value indicates that Helium's use cases make sense and will continue to expand. Helium is drawing attention with its novel take on the Internet of Things (IoT) and its exclusive reward scheme for network users, while the DePin industry is seeing a sharp downturn. This piece examines HNT's recent performance, looking at the causes of its upswing and any possible effects on its future course.
A system of hotspots serves as wireless gateways for Helium, a distributed ledger created for the Internet of Things (IoT). Thanks to these hotspots, IoT devices may communicate and share data.
Each hotspot serves as a validator node in the Helium ecosystem, and its owners are compensated with HNT tokens to ensure connectivity and supply network coverage. Strong WiFi routers that allow users to connect to the networks anywhere in the world are used to accomplish this.
The network recently surpassed 100,000 mobile users, which is a major milestone. The most recent information through a Dune dashboard indicates that there are currently 103,081 subscribers overall. Furthermore, non-fungible tokens (NFTs) have shown an 8% rise in monthly subscribers throughout the past month.
Let's see the future aspect of this crypto from the HNT/USDT technical analysis:

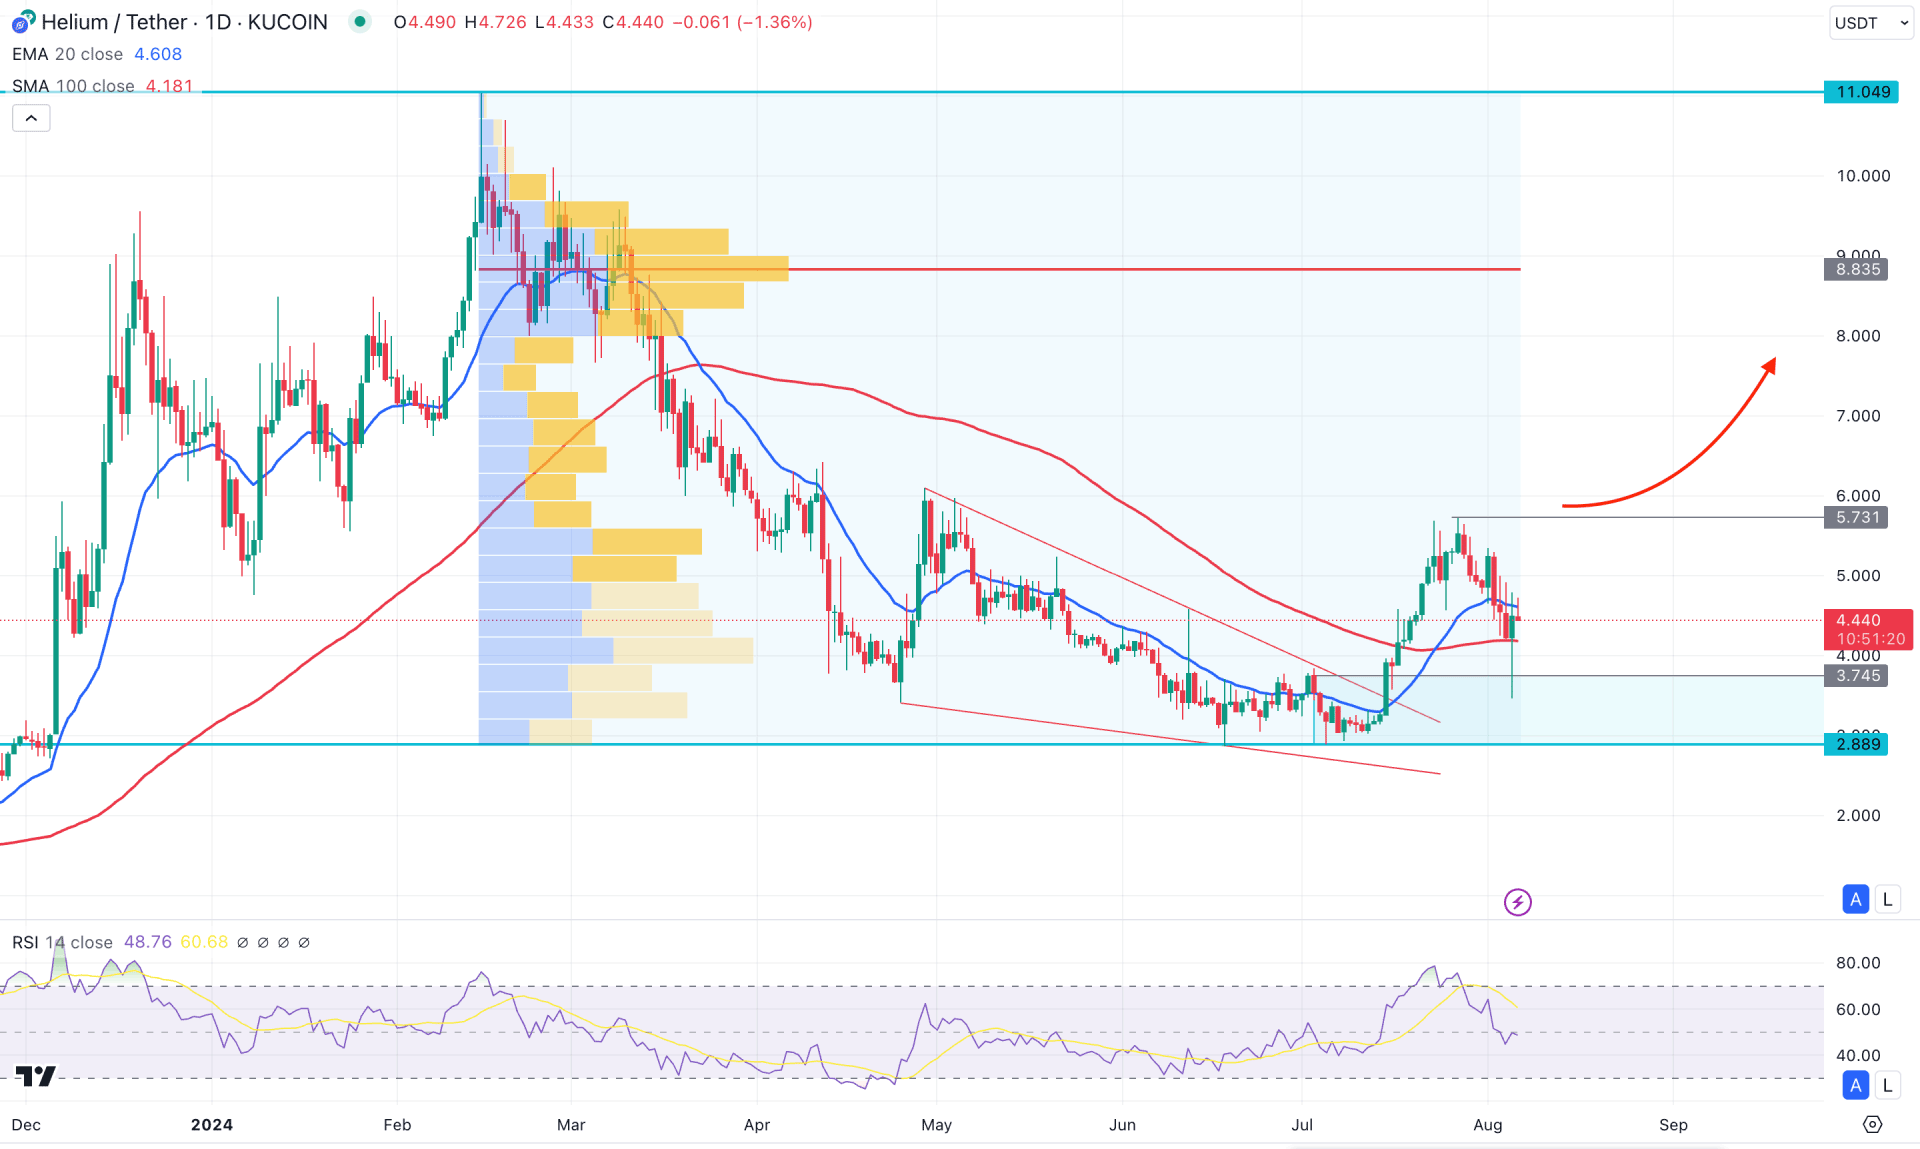
In the daily chart of HNT/USDT, the recent price shows a bullish breakout from the falling wedge pattern from where a bullish opportunity could open.
In the broader context, the bullish possibility is open as the current price is trading above the July 2024 high after forming a bullish engulfing bar. Moreover, the selling pressure from the existing bearish weekly candle limits the ongoing buying pressure. As the current price is trading below the 5.482 weekly high, a valid bullish breakout is needed before forming a bullish continuation.
In the daily chart, the recent price moved above the dynamic 100-day Simple Moving Average, which initiated the bullish possibility. Moreover, the price corrected lower and formed a bullish reversal candlestick from the existing bullish order block. The 20-day EMA is still above the current price and is working at a crucial resistance level. In that case, a valid bullish breakout from this area with a daily candle above the 20-day EMA could validate the bullish signal, aiming for a trend continuation signal.
In the volume structure, the largest activity level since February 2024 is at 8.835, which is way above the current price. As the recent price hovers 50% below the high volume line, we may expect a bullish correction as a mean reversion.
Based on the daily market outlook, a conservative bullish approach is to wait for a valid bullish daily close above the 5.731 resistance level, aiming for the 10.000 psychological level.
On the other hand, the current bullish possibility is valid as long as the current price hovers above the bullish demand zone. A bearish rejection from the 20-day EMA with a daily candle below the 2.889 level might lower the price below the 2.000 psychological point.

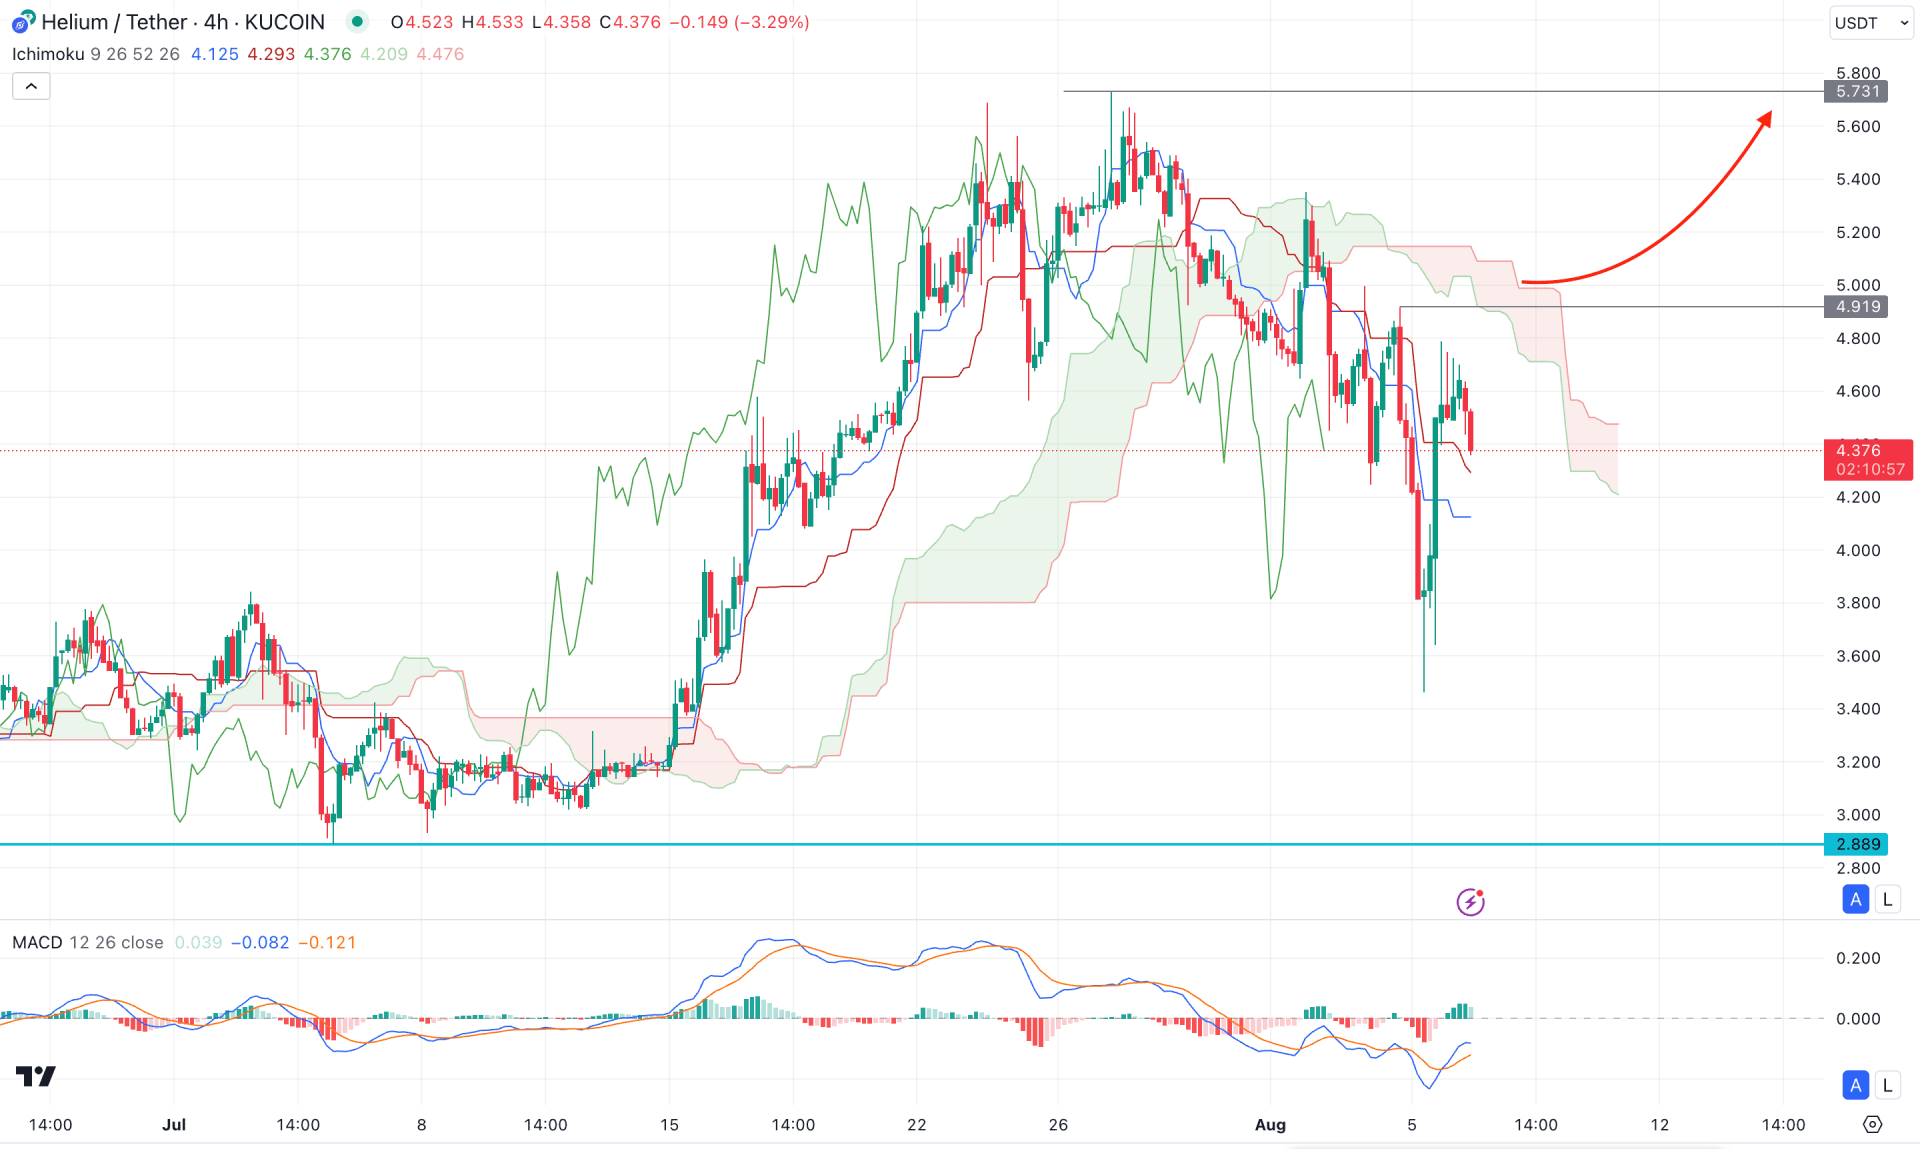
In the H4 timeframe, the recent price trades below the Ichimoku Cloud low, suggesting a bearish continuation signal. Moreover, the Senkou Span A remains below the Senkou Span B, while the Lagging Span is below the current price.
In the secondary window, the MACD Histogram shows a bullish pressure as the current level remains steady above the neutral point. Moreover, a bullish crossover is visible from the negative zone, suggesting a bottom formation.
Based on this context, the Kijun Sen level is below the current price, while the current price trades at the trend line resistance. In that case, a bullish break with a daily candle above the 4.919 level could signal a valid bullish breakout, aiming for the 5.731 resistance level. Moreover, a stable market above the 5.700 level could open the room for reaching the 8.000 area.
On the bearish side, the ongoing selling pressure with an H4 candle below the 4.000 level might resume the existing bearish trend towards the 2.889 support level.

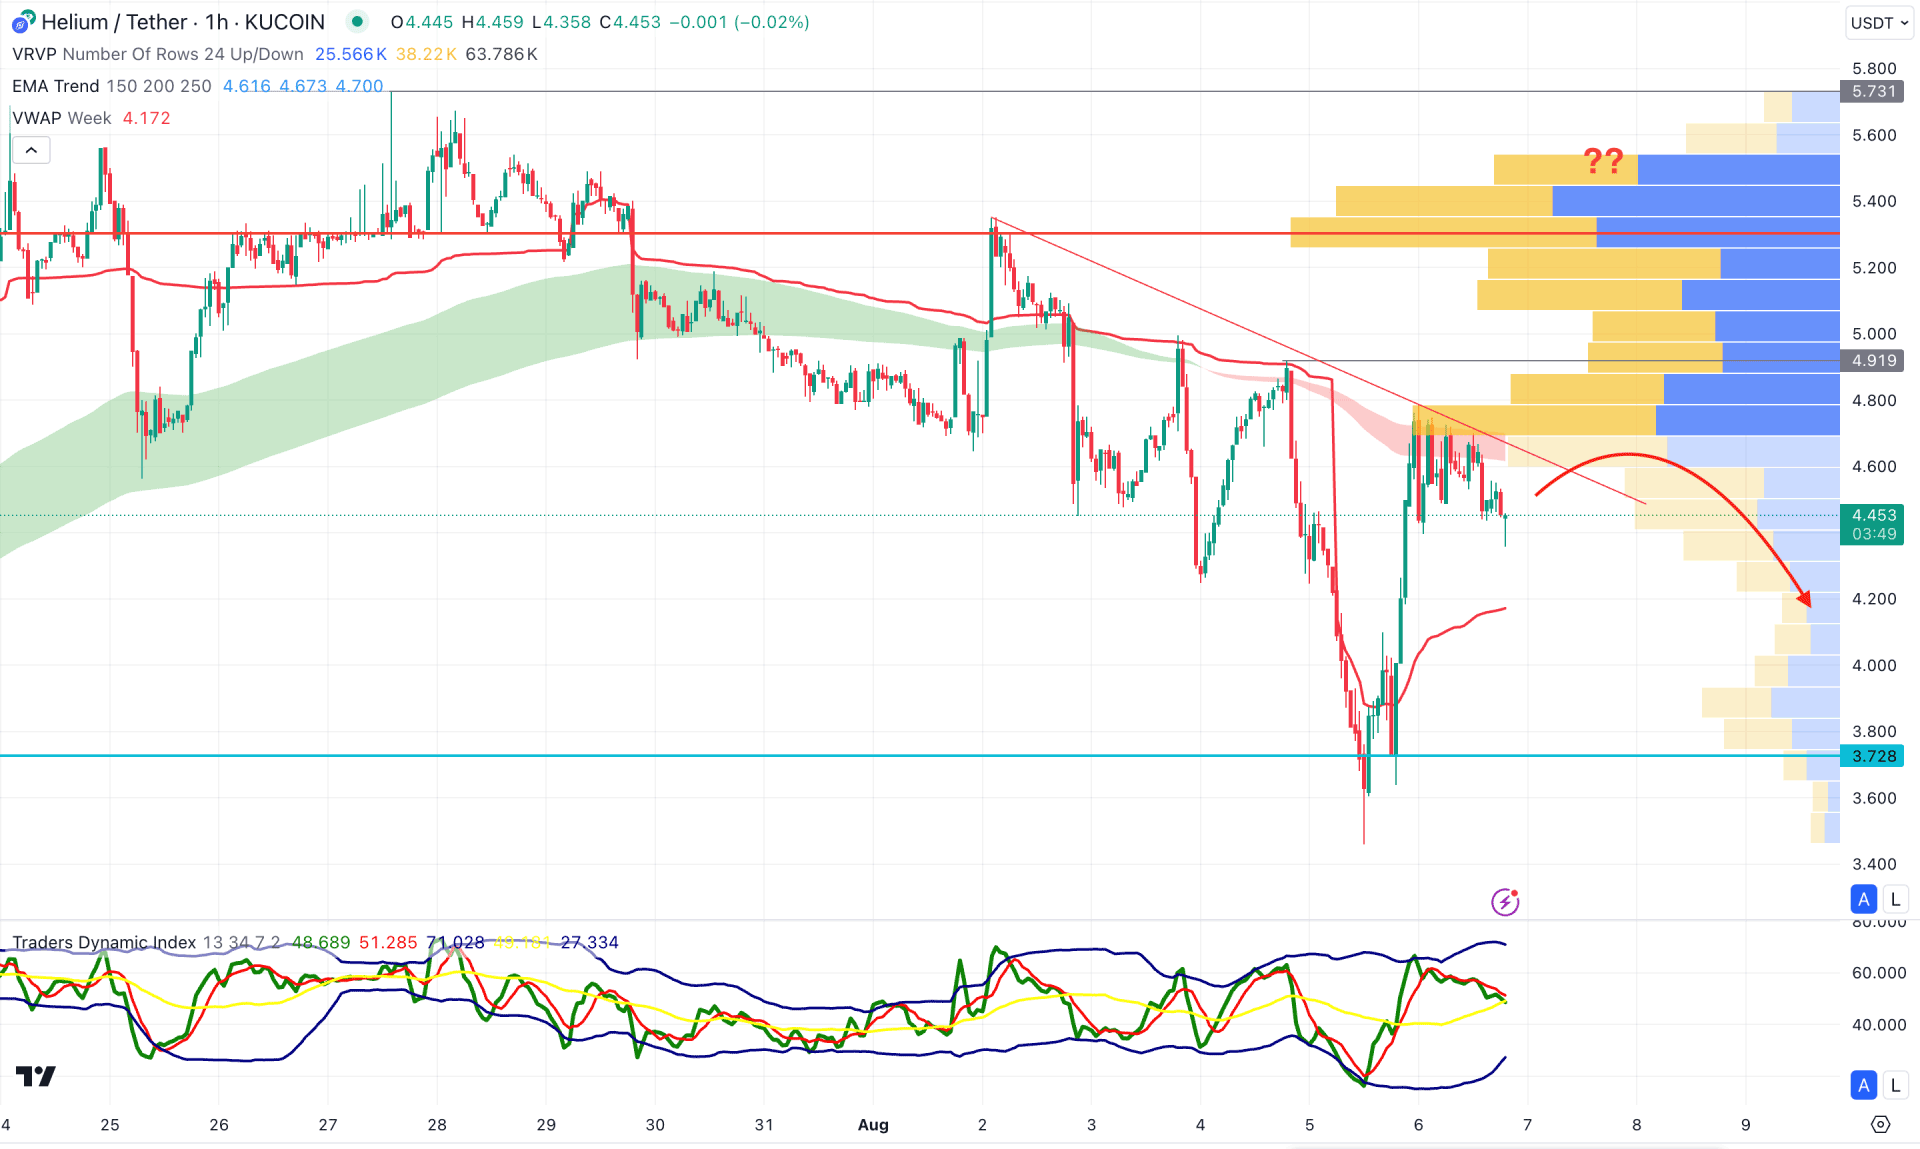
In the hourly time frame, HNT/USDT is facing a trendline resistance before making an immediate bullish recovery from the 3.463 low. In that case, investors should closely monitor how the price reacts at the immediate trendline resistance.
In the indicator window, the recent Traders Dynamic Index (TDI) suggests a valid buying pressure as the current TDI level is above the 50.00 neutral point.
Based on this outlook, a bullish hourly candle above the 4.919 resistance level could be a potential long opportunity, aiming for the 5.731 level. Moreover, a stable market above the 5.273 level could extend the upward pressure above the 8.000 level.
On the bearish side, the downside continuation could resume the existing trend as long as it hovers below the dynamic EMA wave.
Based on the ongoing bullish market pressure, investors should wait for a valid conservative bullish signal in the daily chart to open a long opportunity. Investors should closely monitor the intraday price before opening a long opportunity from a discounted price.