

Published: October 7th, 2026
Hedera has contributed the codebase for its Cross-Ledger Periodic Rewards (CLPR) protocol to the Linux Foundation Decentralized Trust (LFDT). The move places the project under a neutral, community-led organization. It will encourage broader collaboration and create more standardized liquidity solutions across blockchain networks.
The contribution falls under Project Hiero, Hedera's broader effort to open-source its core technology. CLPR addresses “trapped liquidity” by enabling programmable, efficient reward distribution across multiple ledgers. By making the technology available through LFDT, Hedera hopes to encourage developers and industry participants to build and adopt interoperable DeFi infrastructure.
Separately, Hedera introduced an official Model Context Protocol (MCP) server that gives AI coding assistants live, read-only access to its documentation. Known as Hedera Docs MCP, the tool lets AI agents retrieve up-to-date API documentation, SDK guidance, and code examples directly in development environments.
The hosted server works with several popular AI development platforms and is designed to reduce coding errors caused by outdated or inaccurate AI-generated information.
Despite these developments, the price action failed to sustain the buying pressure above the 0.1000 crucial line.
Can bulls regain the momentum? Let's look at the full outlook from the HBAR/USDT price analysis:
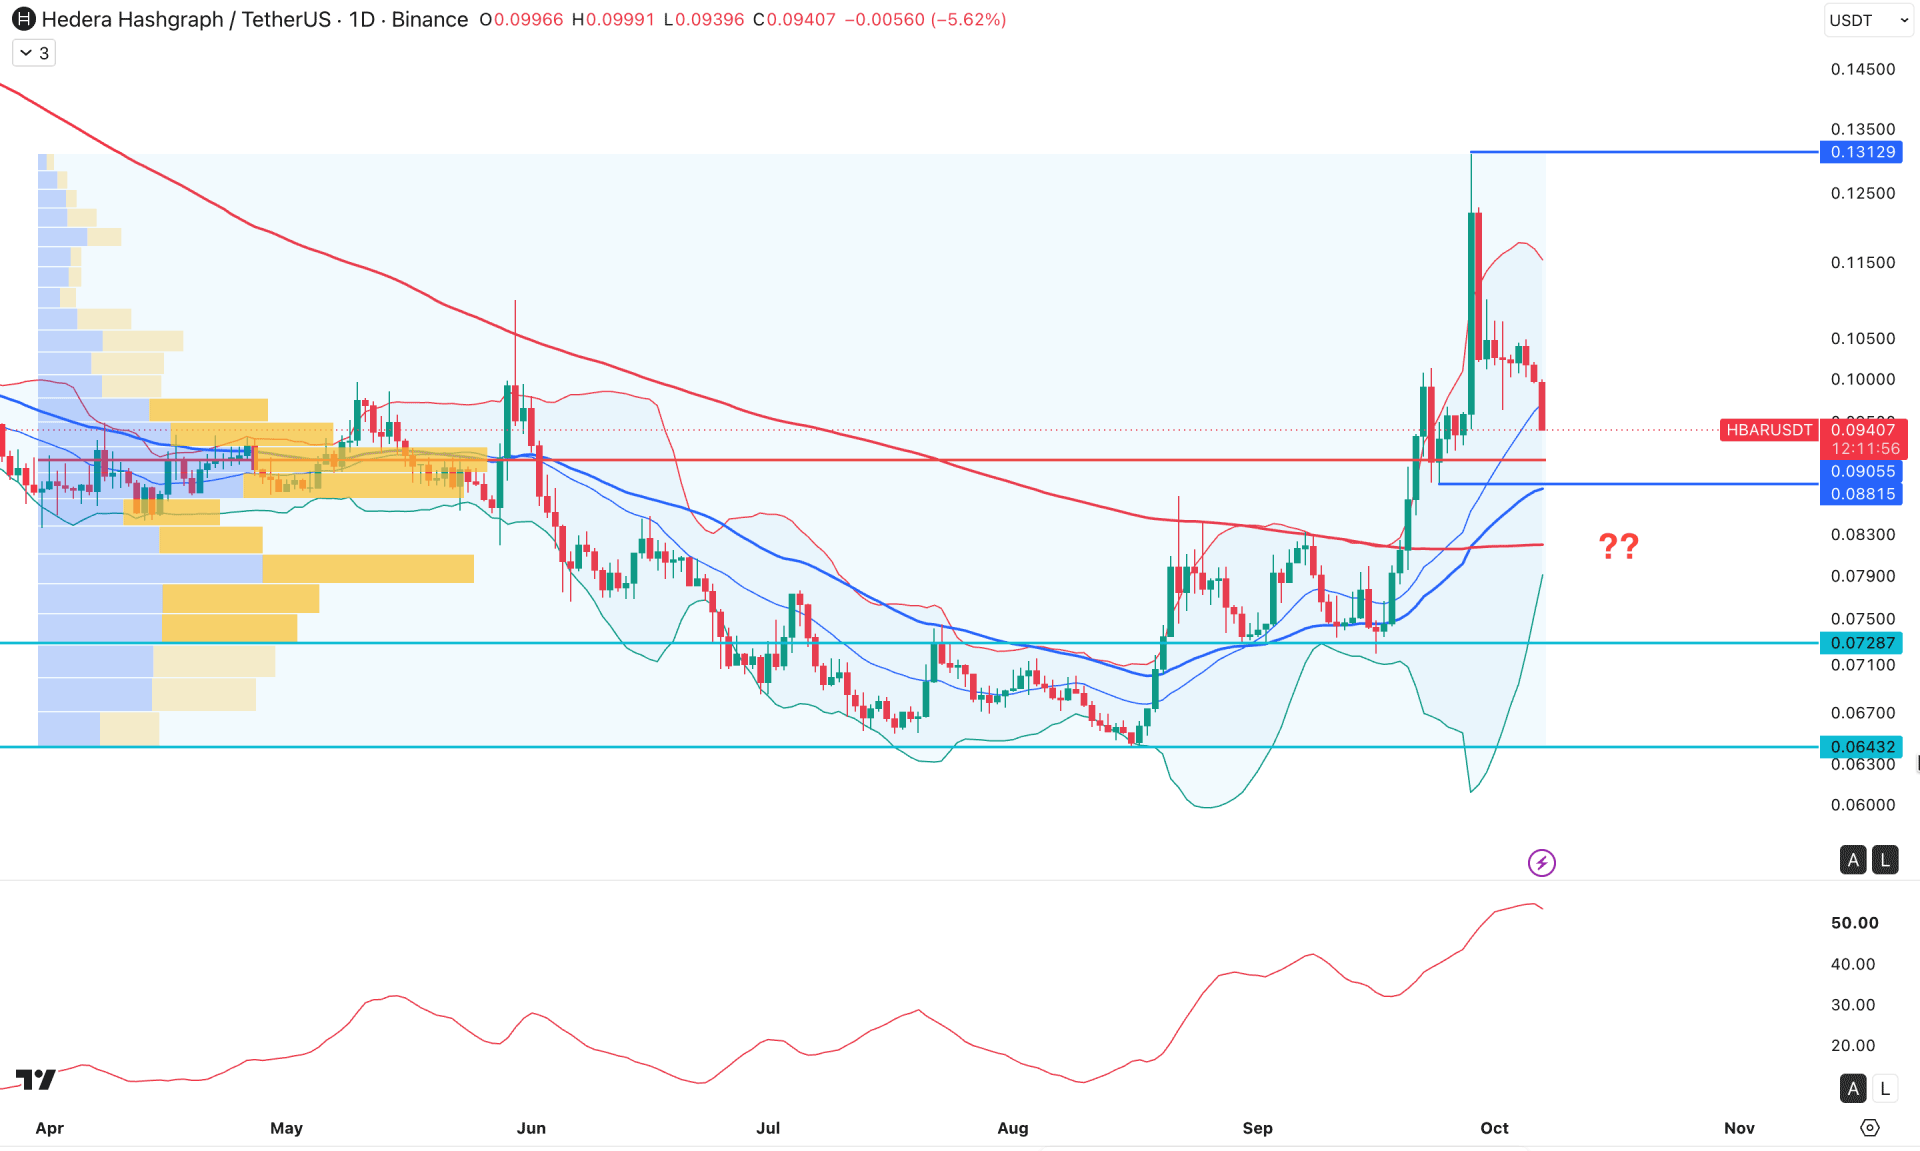
On the HBAR daily chart, market momentum is bearish, as price formed an immediate downside recovery after testing the 0.1312 high. Primarily, this signals a bullish extension from here, although a decent downside correction is possible, even if the overall structure remains bullish.
Looking at the higher timeframe, the monthly candle suggests ongoing buying pressure, supported by an ascending trendline. Moreover, the current candlestick shows a strong recovery, eliminating three months of losses with a valid bullish monthly close. The weekly timeframe shows a bullish failure, as price failed to sustain momentum above the 0.1091 key resistance level.
Volume structure supports the bulls, as the highest activity level since March 2026 sits just below the current price. As the recent price move heads toward the higher level, the primary aim is to test the support level before forming a rebound.
In the daily chart, the bullish over-extension is clear, as the price moved beyond the upper Bollinger Band line. The price action ended the buying pressure with an immediate recovery below the resistance level, pushing the price below the middle Bollinger Band line. As long as price remains below these two crucial Bollinger Band lines, the primary anticipation is to look for short trades only.
Meanwhile, strong bullish pressure in September 2026 led to a breakout above the 200 SMA, signaling a major market shift. Currently, the price is hovering above the 200 SMA and 50 DEMA, signaling a possible bullish recovery at any time.
Selling pressure looks solid, as the Directional Index is above 20.009 and is likely at its highest level in a year.
Based on this outlook, ongoing selling pressure is likely to test the 50-day EMA at the 0.0905 support level before a bullish rebound. A failed move below the 200-day SMA, followed by a recovery above 0.10905, could be a remarkable achievement for buyers and may push price toward the 0.1312 resistance level.
On the other hand, a pump-and-dump pattern is clear, as the price moved beyond the bullish extension area but failed to sustain its momentum. In that case, ongoing selling pressure, along with a bearish close below the 50-day EMA, could increase the possibility of testing the 0.0728 support area soon.
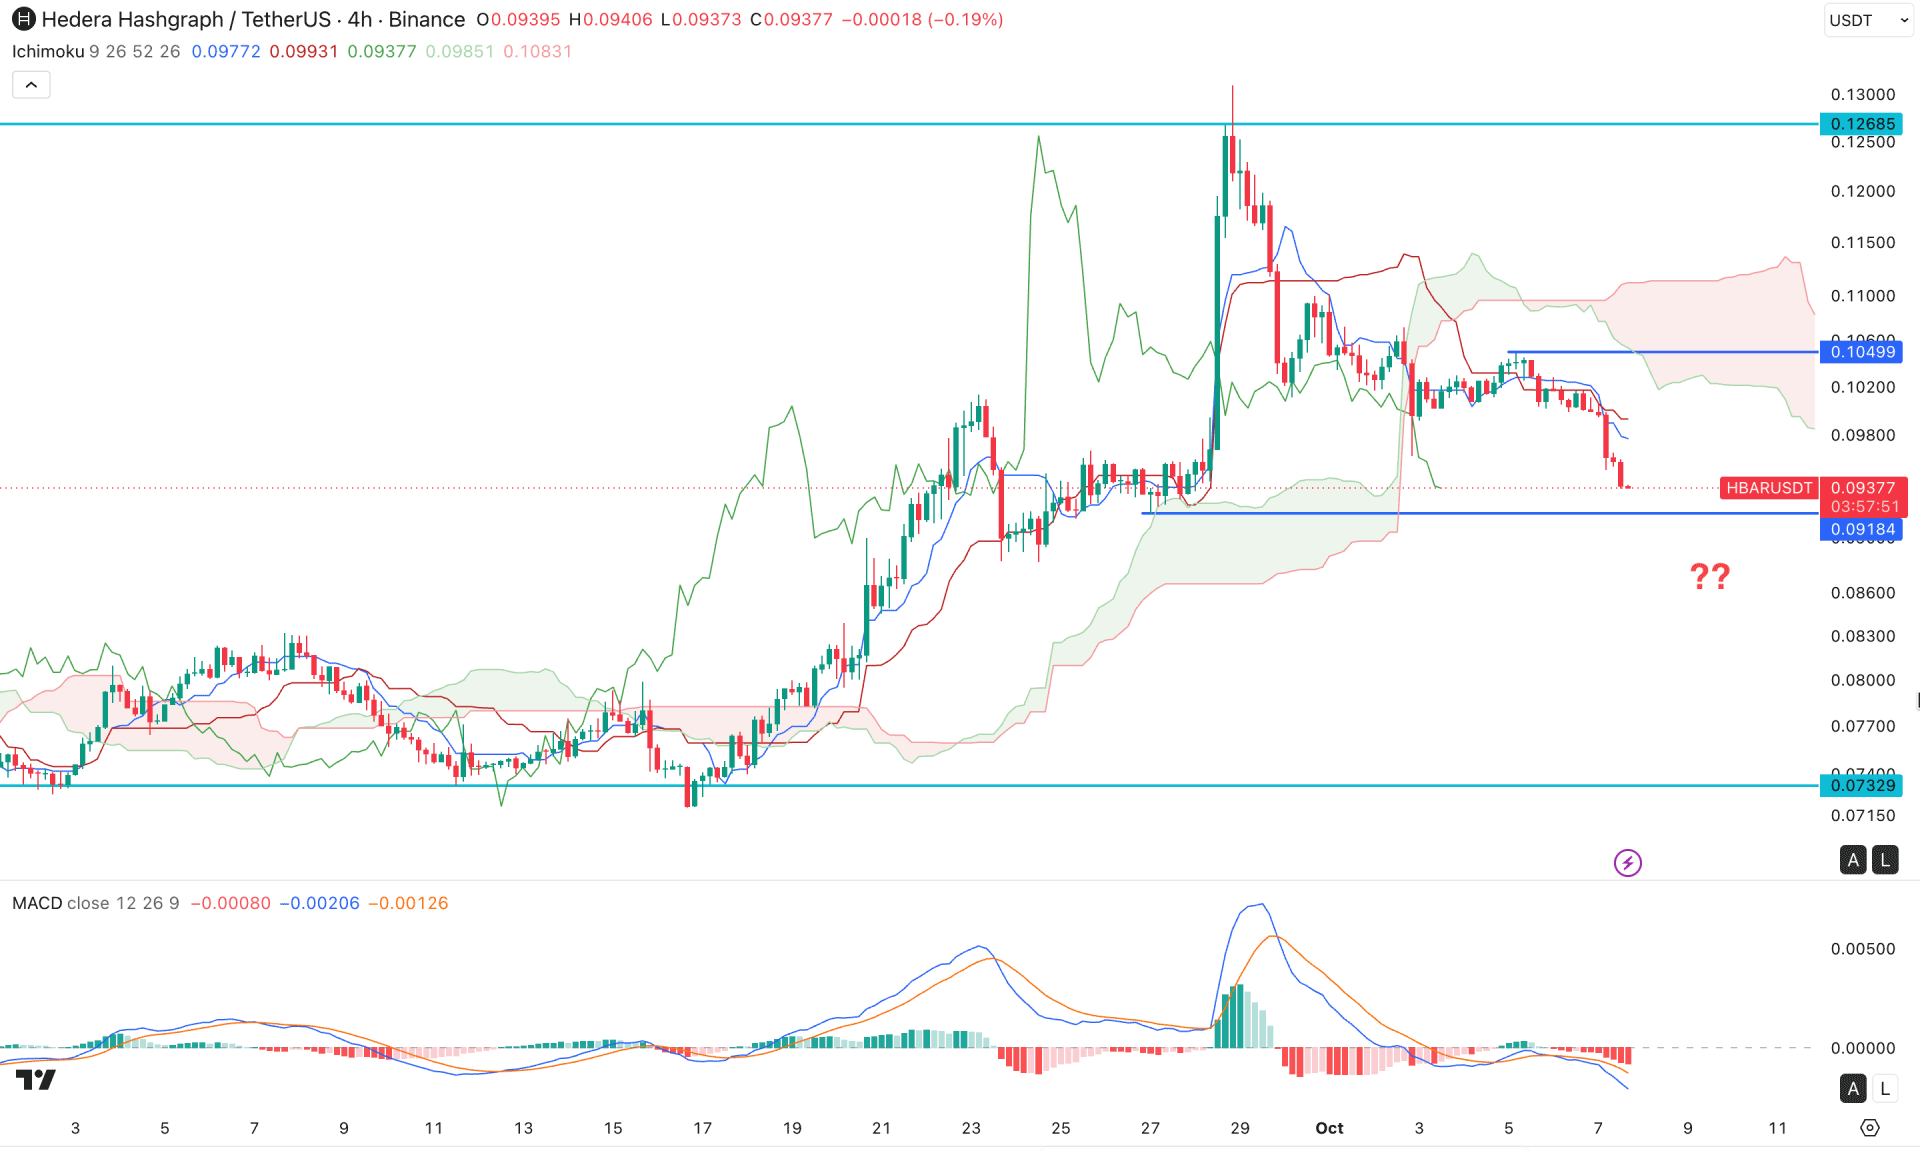
In the four-hour timeframe, HBAR/USDT is trading under selling pressure, as the price has remained below the cloud resistance for a considerable period. After a bearish breakout, price moved sideways while creating a new swing low, suggesting further downside.
The future cloud supports sellers. Both Future lines are heading downward, following the price action. The dynamic Tenkan and Kijun lines remain above the current price with a bearish slope, signaling continued bearish momentum.
In the secondary indicator, the MACD histogram has maintained selling pressure for a considerable period, while the signal line is at its lowest point. This primarily signals a minor bottom formation. However, the signal line's structure is not sufficient to confirm a bullish reversal.
Based on this outlook, the immediate support level to watch is 0.0918, which could be tested before offering another long opportunity. A move above 0.1000 could be the first sign of a bullish recovery, with the ultimate aim of testing 0.1268.
On the other hand, a failure to hold the 0.0918 level could challenge buyers and extend losses toward the 0.0732 area.
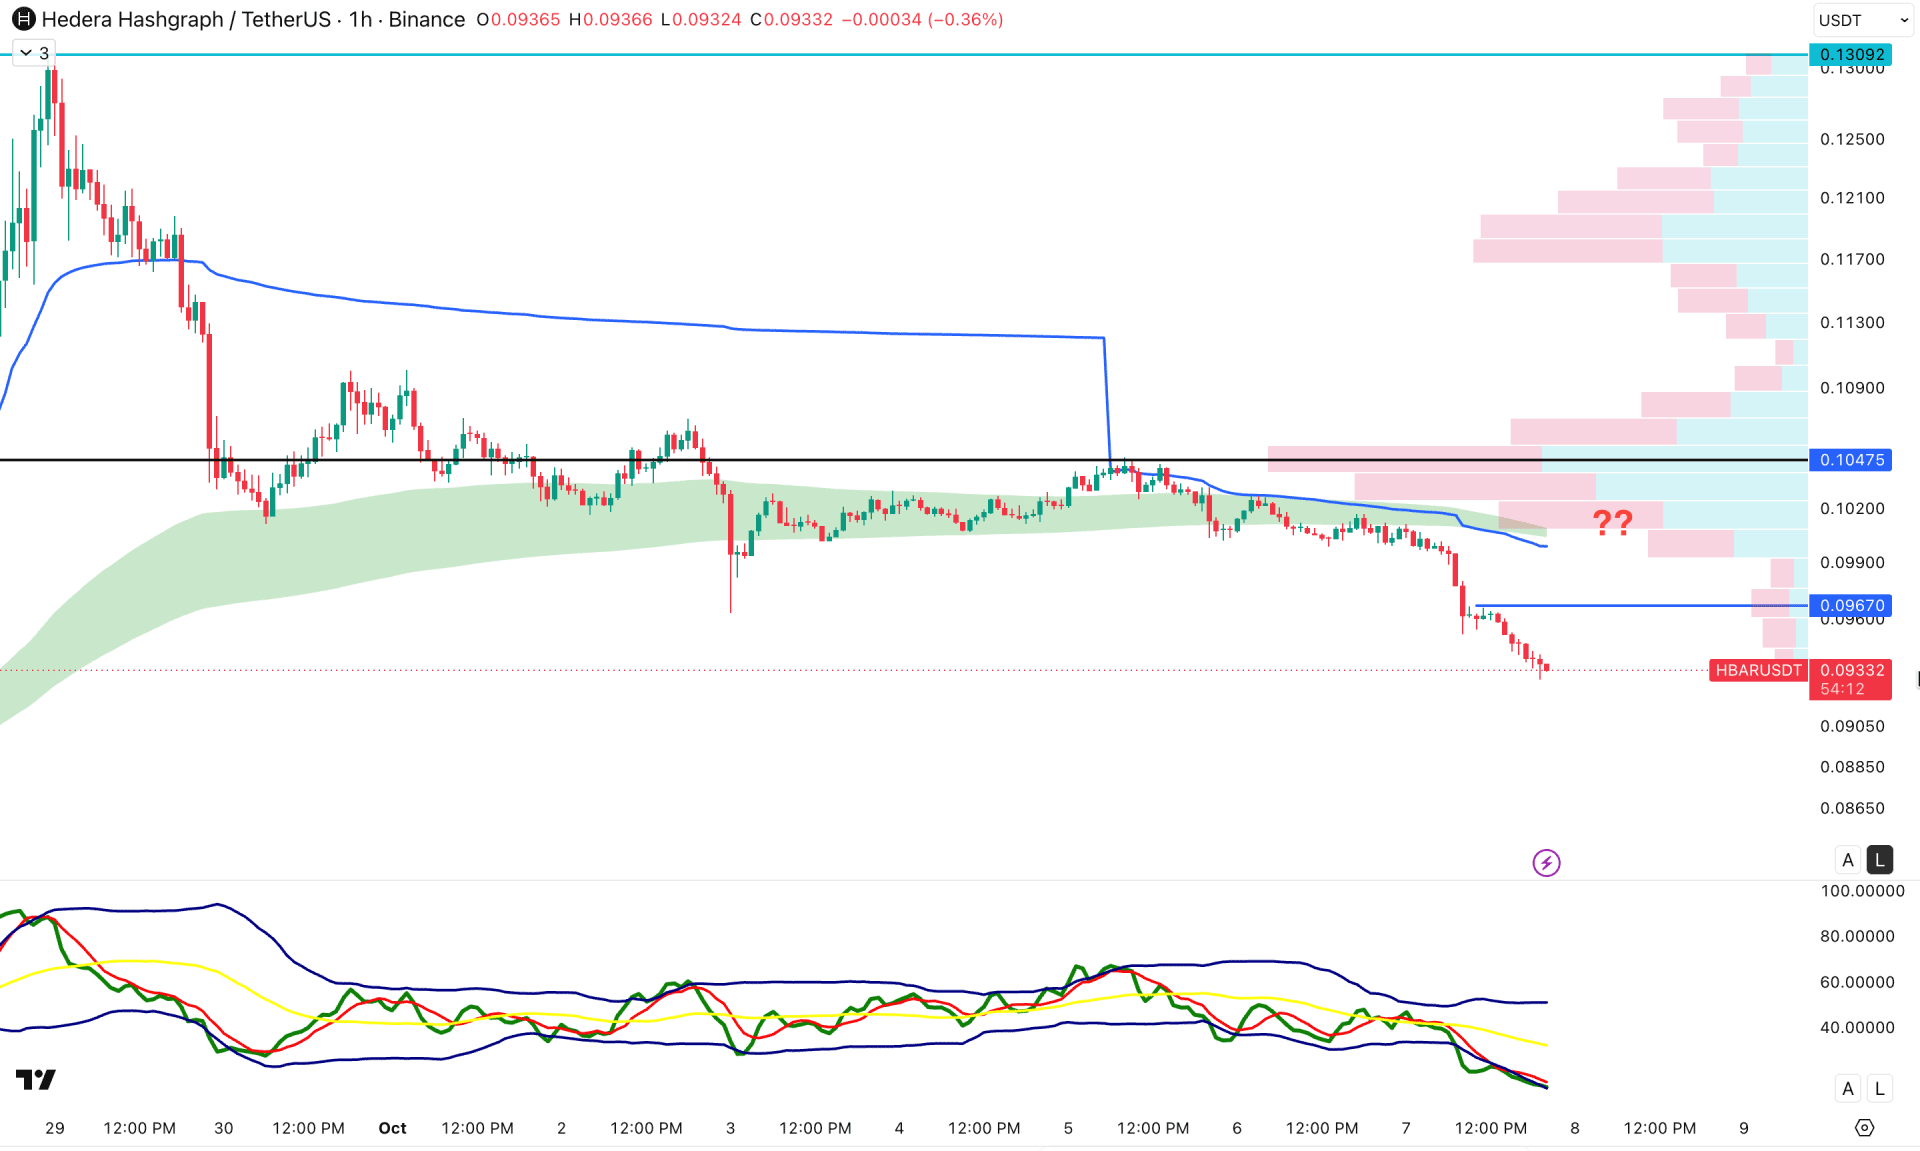
Based on the market structure, HBAR/USDT is trading within a B pressure a pump and dump is clearly visible. As a result, the price is likely to extend the down pressure and taste the daily support area from higher. Shravan could come with a valid liquidity grab.In the hourly timeframe, HBAR/USDT is trading under impulsive bearish pressure, as the current price is moving within an intraday downtrend with no sign of a bullish recovery.
Downside pressure is supported by the declining EMA wave, which aligns with the weekly VWAP. Moreover, the highest-volume level sits at 0.1047, above the current price. Given the current selling pressure, the gap to the high-volume level has widened, with no satisfactory high-volume activity at the bottom.
The indicator window shows an extreme condition, as the Traders Dynamic Index is at its lowest level in a month.
Based on this outlook, extreme selling pressure is visible, as the current price has reached a new intraday low. Downside pressure is supported by resistance at 0.0967, a key level to watch. As long as the price remains below this level, we may expect the selling pressure to continue.
On the other hand, a recovery above 0.0967 could increase the chance of testing 0.1047 before forming a valid bullish rebound.
Based on the market structure, HBAR/USDT is trading under bearish pressure, and a pump-and-dump pattern is clearly visible. As a result, the price is likely to extend the downside pressure and test the daily support area from the higher timeframe. A short-term recovery could occur through a valid liquidity grab.


