Published: April 2nd, 2024
On March 23, the developers of HBAR, the native token of Hedera Hashgraph, announced a momentous development by incorporating the United Kingdom Crypto Asset Business Council. This strategic choice aims to enhance Hedera's standing in the domain of cryptocurrencies and reinforce its dedication to pioneering advancements and transparent regulatory structures within the United Kingdom's crypto space.
The collaboration with the UK CBC signifies a significant accomplishment for Hedera's blockchain network, underscoring its commitment to ensuring the security of HBAR users while providing exceptional cryptocurrency services. After this advancement, HBAR underwent a positive trend, culminating in its attainment of $0.14, a level previously surpassed during a recent surge in the market.
In particular, the value of Hedera's HBAR moved by -9.6% between March 02 and April 02, from The $0.09 threshold is where analysts anticipate HBAR's value to be, signifying a projected increase.
Hedera distinguishes itself as the preeminent, enterprise-grade, sustainable public network for the decentralized economy, enabling businesses and individuals to develop comprehensive decentralized applications (DApps). Hiera provides a more equitable and effective framework designed to address conventional blockchain platforms' deficiencies, including lethargic performance and instability.
A little over a year after its inception through an initial coin offering (ICO) in August 2018, Hedera's mainnet went live in September 2019. Throughout the ICO, investors were allowed to procure the platform's native utility token (HBAR) at a price set for its initial offering.
Let's see the upcoming price direction of this coin from the HBAR/USDT technical analysis:
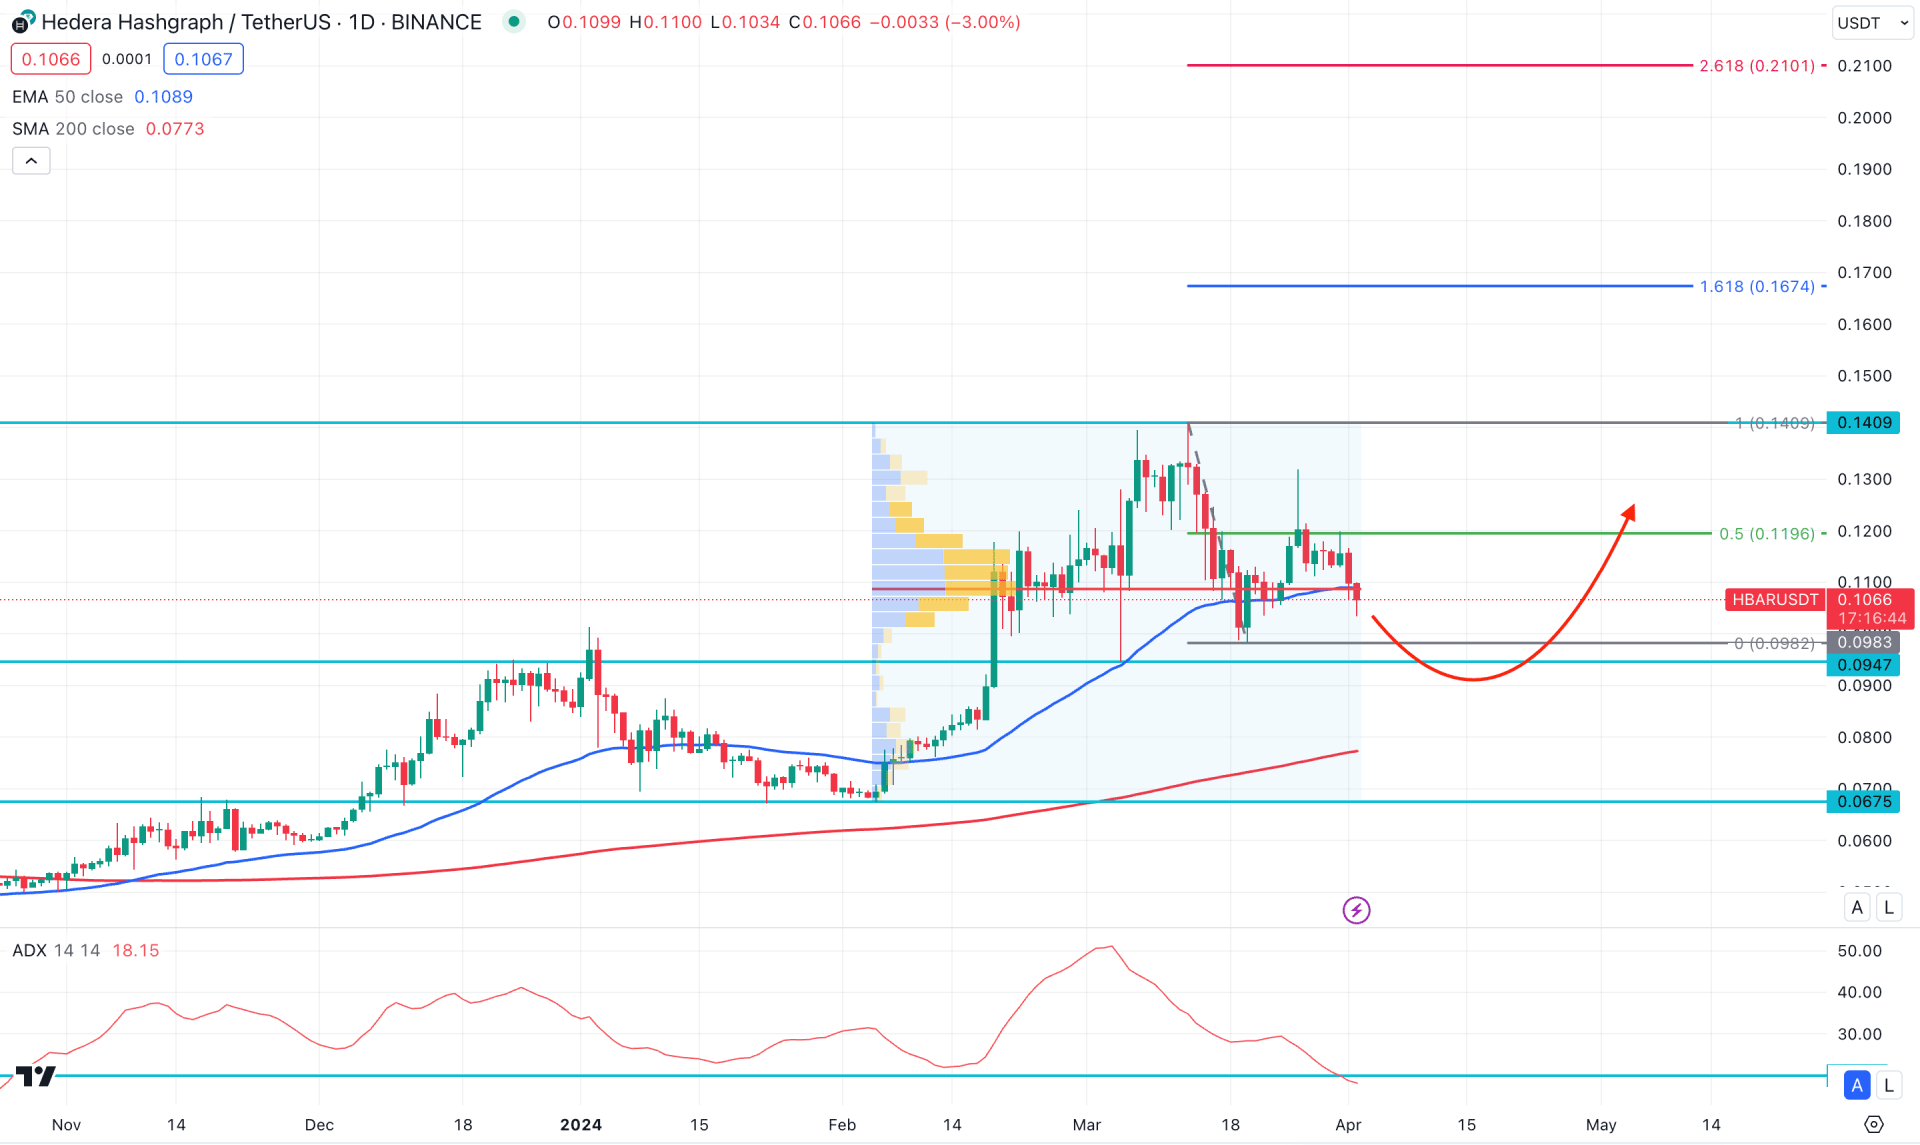
In the daily chart of HBAR/USDT, the ongoing buying pressure is limited from the recent volatility after finding a peak at the 0.1409 level. Extensive selling pressure from the top makes it challenging for bulls to regain momentum. However, the broader market context is bullish, and any failure to break down from near-term support levels could potentially be a long opportunity.
In the higher timeframe, February 2024 was a bullish month, with an engulfing pattern formation, where the next candle closed as a Doji formation, suggesting a sideways momentum. Following the monthly candle formation, a bullish continuation could follow after overcoming the last Doji high, which was formed in March.
In the daily volume structure, the most active level since 5 February also suggests higher volatility by remaining closer to the current price.
In the main chart, a bearish daily candle formed below the dynamic 50-day Exponential Moving Average, which suggests an ongoing medium-term selling pressure. Meanwhile, the 200-day Simple Moving Average level is still untouched and below the major static support.
Based on the daily market outlook of HBAR/USDT, a sell-side liquidity sweep 0.0983 to 0.0947 zone could be a potential long opportunity. The conservative trading approach is to find a new swing low below this zone and form an immediate bullish reversal. In that case, an upward signal could be potent, targeting the 0.1674 Fibonacci Extension level.
On the other hand, an ongoing selling pressure is present below the 50 day Exponential Moving Average level, where a bearish daily candle below the 0.0900 level with a consolidation could test the 0.0700 level.
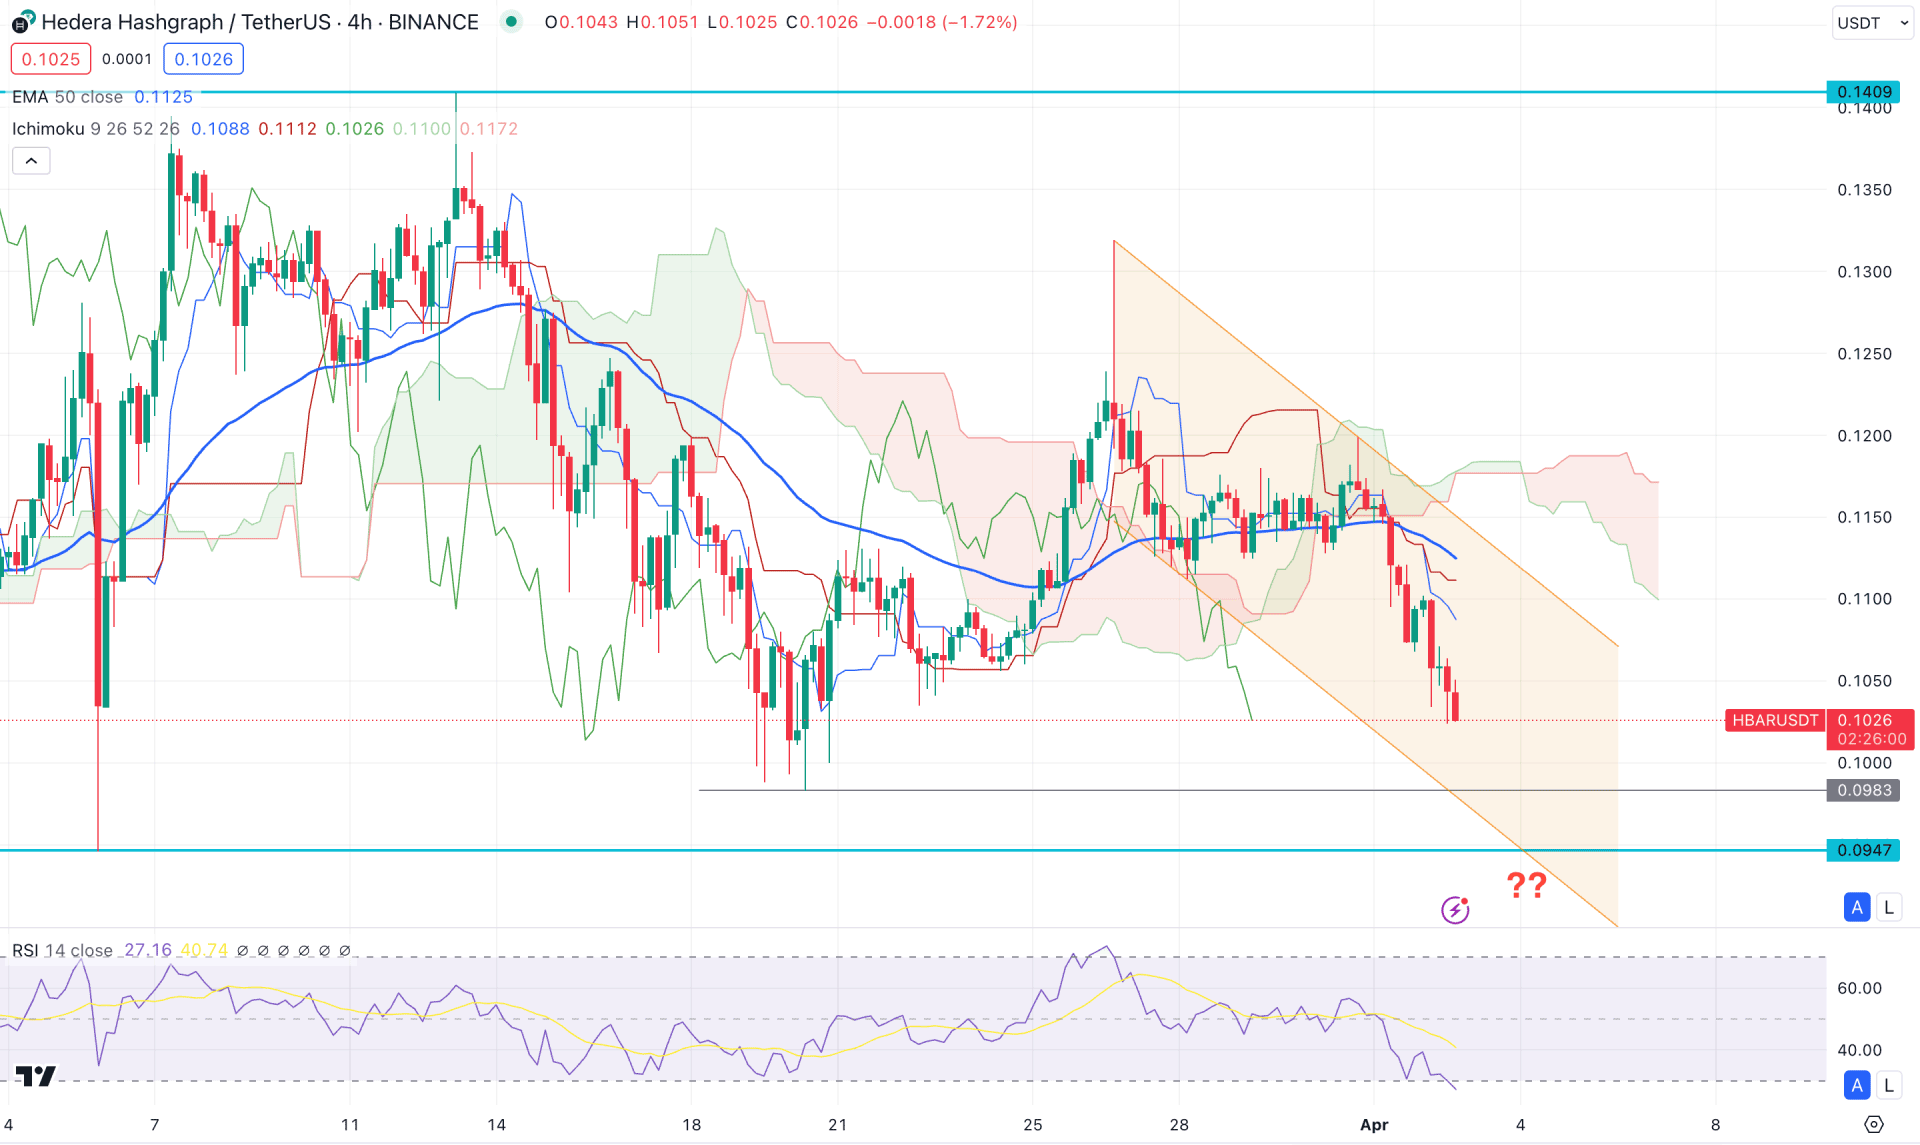
In the H4 chart, extensive selling pressure is visible below the dynamic Ichimoku Cloud zone, where the Future Cloud suggests a downside continuation signal. Moreover, the recent downside pressure runs within the descending channel formation with a gap between the current price and dynamic Kijun Sen.
In the indicator window, the current Relative Strength Index (RSI) reached the oversold 30.00 level, suggesting extreme downside pressure. However, a potential bullish correction is possible from the channel support, depending on how the price reacts to the near-term support area.
Based on the H4 outlook of HBAR/USDT, a bullish reversal from the 0.0983 to 0.0947 area could be an upward possibility, targeting the channel resistance. However, the long-term bullish possibility needs a solid break from the channel with a stable market above the dynamic Kijun Sen level before aiming for the 0.1300 level.
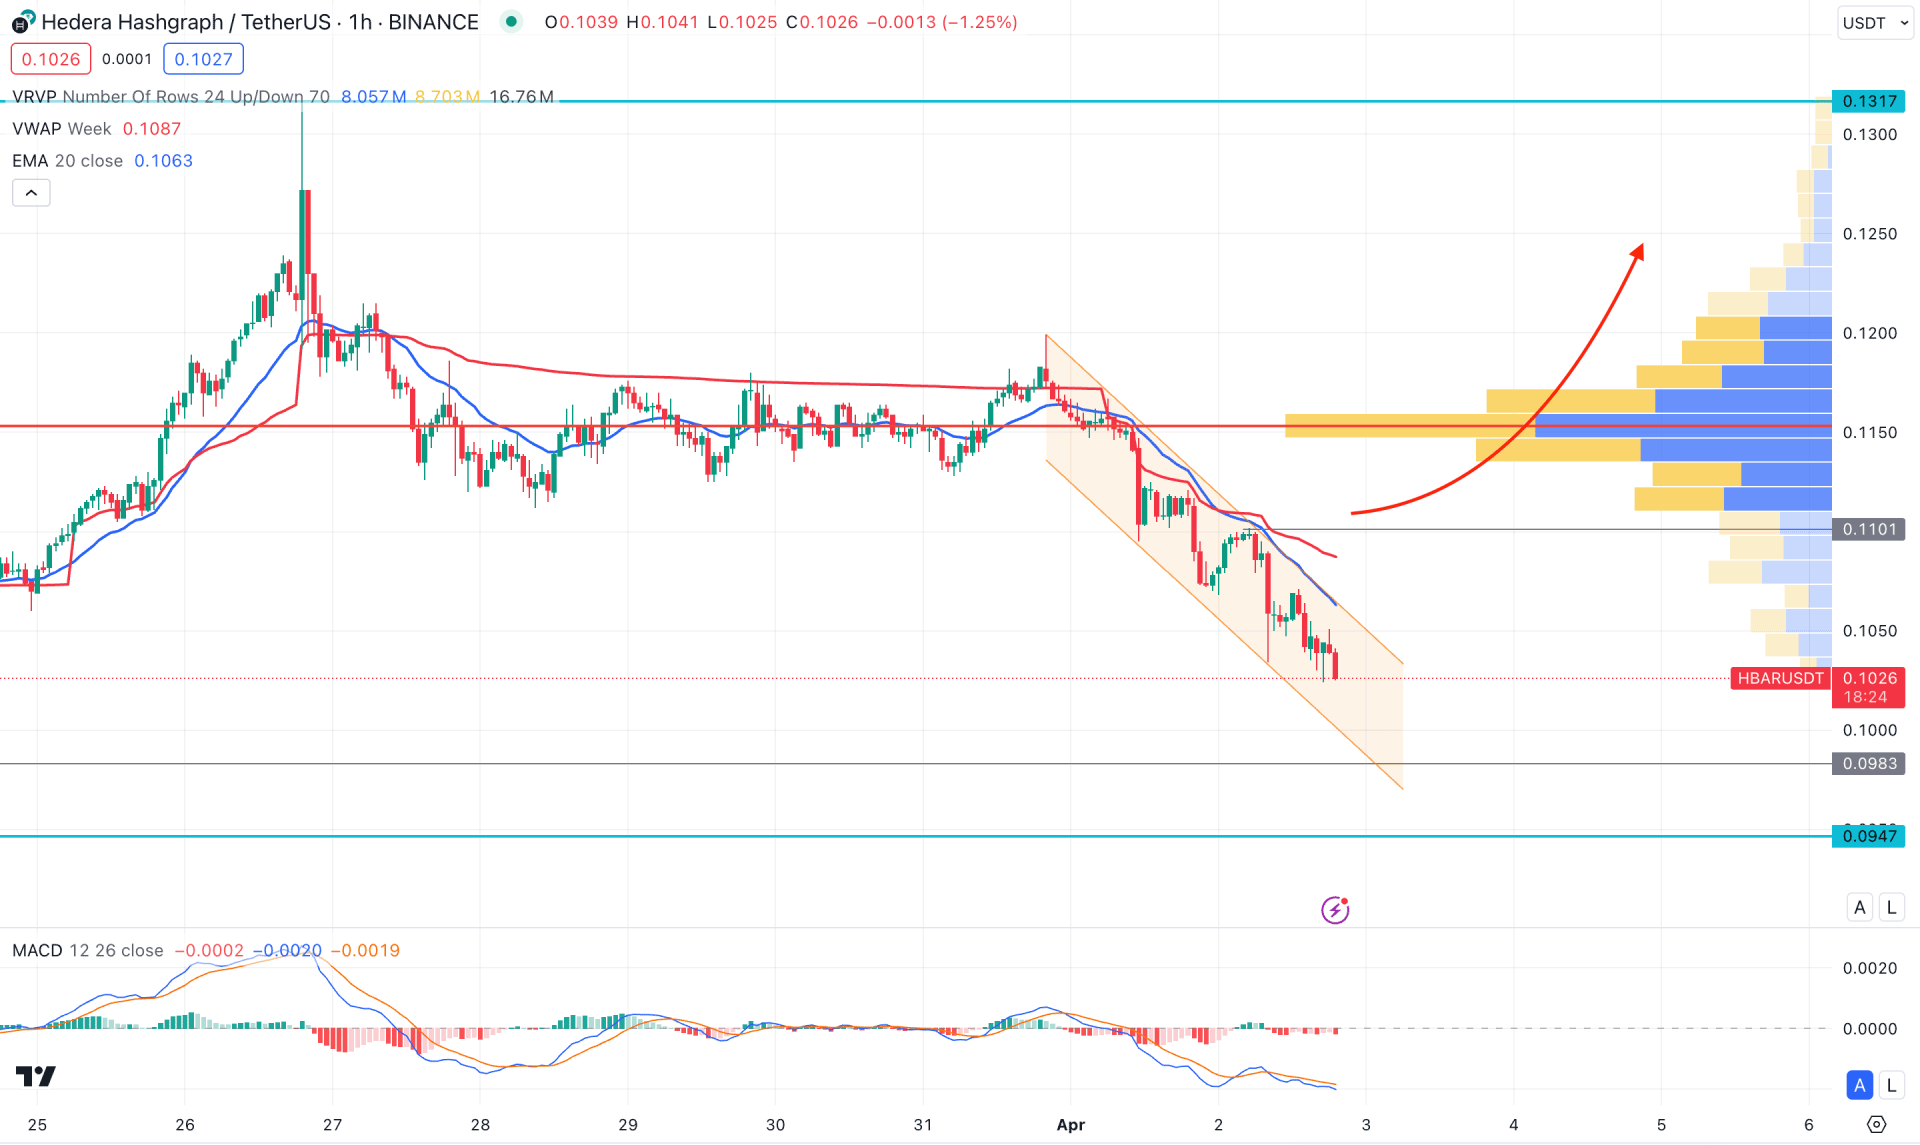
In the hourly chart, the HBAR/USDT is trading within a selling pressure, where the dynamic 20 Exponential Moving Average is the immediate resistance. Moreover, the visible range high volume level is above the current price, working as an additional bearish signal.
On the indicator window, the MACD Histogram maintained a strong bearish position while the Signal line reached the oversold level.
Based on this outlook, a strong bullish correction is pending, where a bullish breakout with an H1 candle above the 0.1101 level could open a long opportunity, targeting the 0.1300 level.
Based on the ongoing market behavior, investors might expect a bullish reversal in the HBAR/USDT price after having a strong sell-side liquidity sweep from the near-term support level. Investors should closely monitor how the price reacts on the daily static level to find a bullish reversal opportunity.


