Published: July 15th, 2025
Following the ground-breaking usage of Hedera's infrastructure for digital currency transfers by Aberdeen Investments and Lloyds Bank, the price spike occurred. Bloomberg claims that the financial institutions used the Hedera Hashgraph cryptocurrency to process digital models of Aberdeen's investment fund and UK sovereign bonds. The adoption of regulated blockchain in conventional finance reached a major turning point with these transactions.
Every method complied with current financial legislation and compliance standards in the United Kingdom. The successful deployment shows how blockchain technology can be incorporated into existing regulatory frameworks by well-known financial organizations.
Strong decentralized apps (dApps) can be developed by people and companies using Hedera (HBAR), a decentralized open network. Peer-to-peer and micropayment company models are built using its native digital currencies, HBAR, which also serves as a network defense against malevolent actors.
Utilizing hashgraph consensus, which guarantees the advantages of blockchain – decentralization, shipping, and security via hashing – with improved speed, efficacy, and scalability, Hedera distinguishes itself from other blockchain solutions.
Let's see the future price outlook from the HBAR/USDT technical analysis:
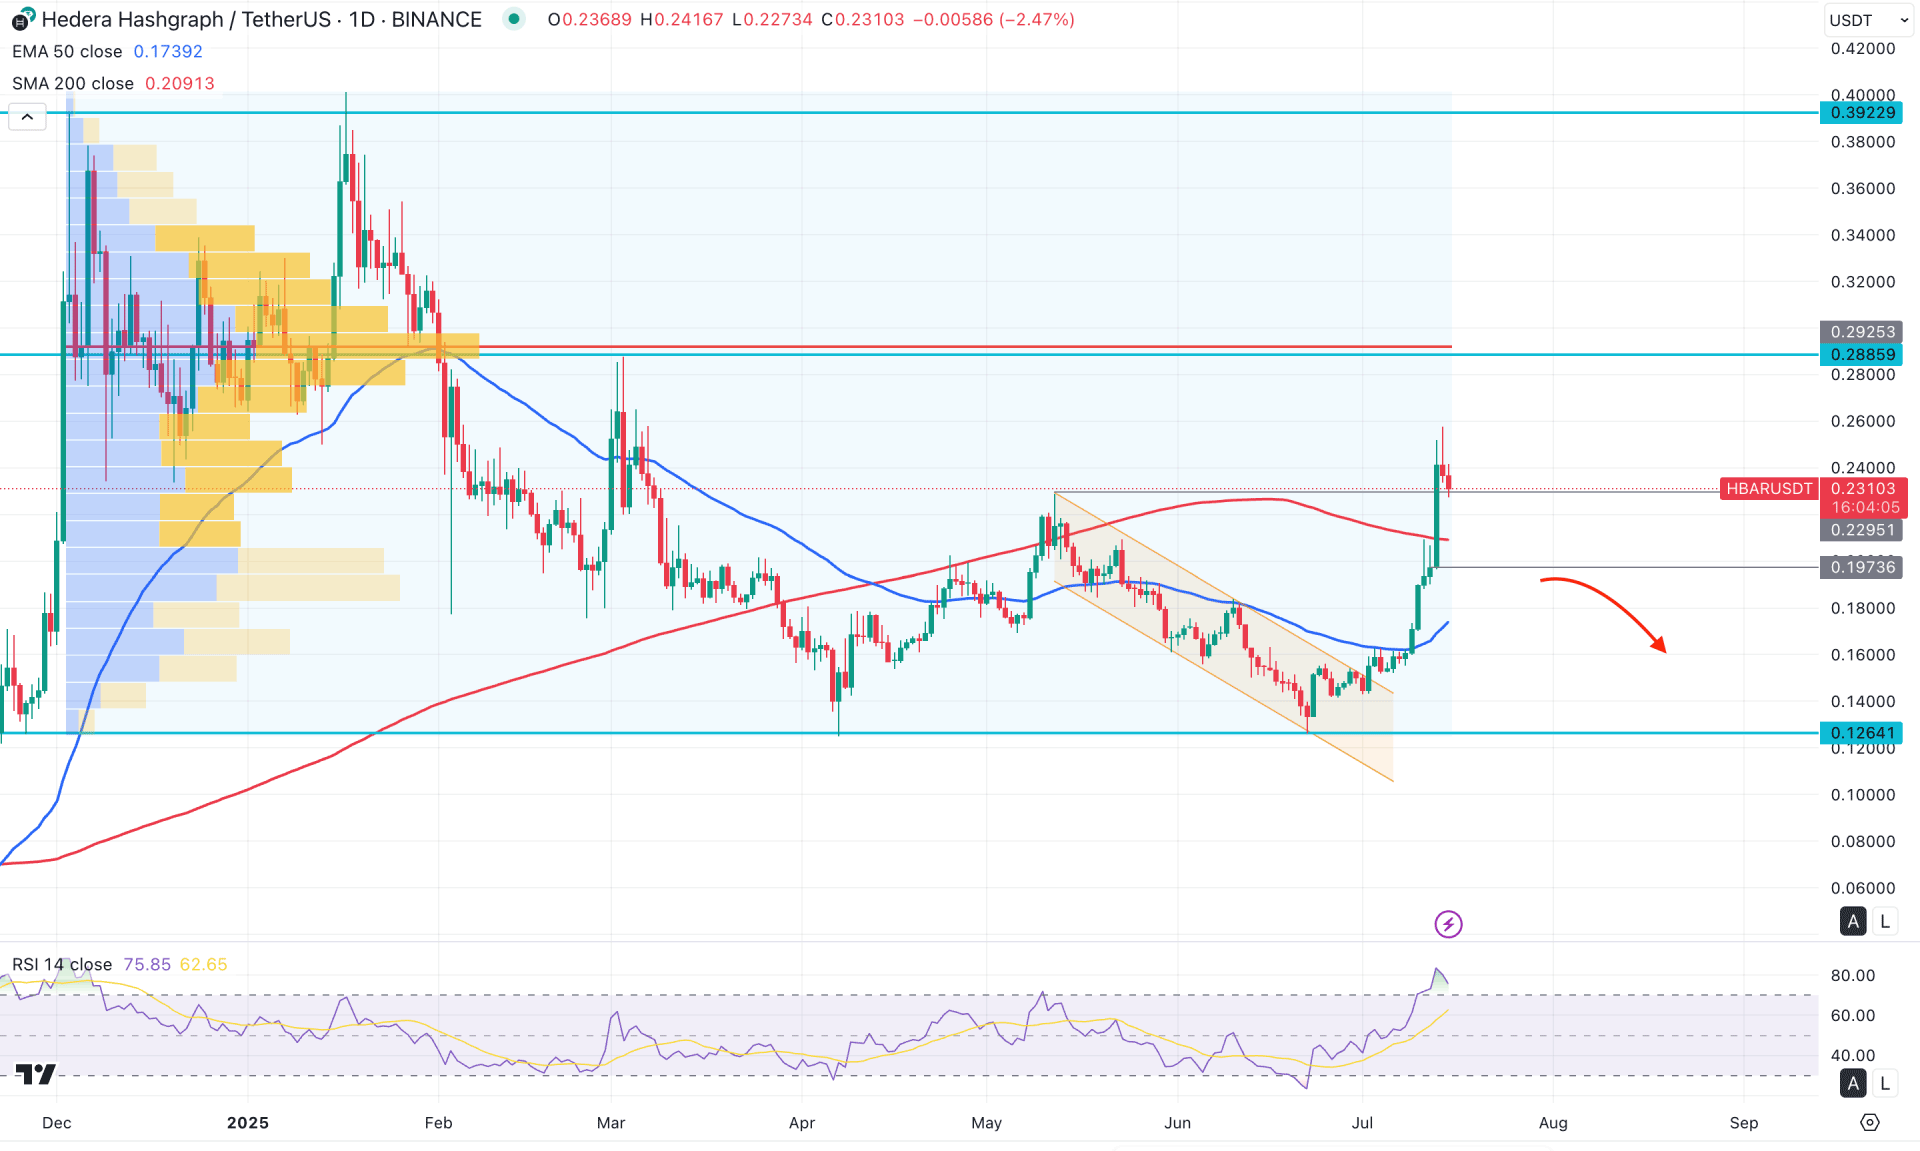
In the daily chart of HBAR/USDT, strong bullish momentum is visible following a bullish breakout from the double bottom pattern, with a daily candle closing above the 0.2295 resistance level. However, the broader market context is still unclear, so taking a long position may require additional confirmation.
Looking at the higher timeframe, the monthly candle is trading bullish after a strong breakout above the June 2025 high. Following three consecutive months of sideways-to-bearish movement, the current bullish momentum appears promising for bulls. However, investors should monitor how the monthly candle closes before anticipating a move toward the existing all-time high.
Although the higher timeframe price action indicates a bullish possibility, there is no significant momentum from a volume perspective. The visible high-volume node since December 2024 is at the 0.2919 level, which is well above the current price. On the weekly chart, a strong bullish candle has pushed the price above a 17-week high, which is a positive signal for buyers. However, the weekly resistance at 0.2510 remains intact, and a bullish breakout is needed before confirming a continuation.
The ongoing buying pressure has occurred without any notable corrective movement and has pushed the price above the 200-day Simple Moving Average. As a result, the Relative Strength Index (RSI) has moved above the overbought level of 70.00.
Primarily, the current price action suggests a bullish extension, but a considerable downside correction may be pending. As the price has created a gap between itself and the 50-day Exponential Moving Average, a pullback could occur before further upside continuation.
Based on the current market outlook, investors should closely monitor how the price reacts above the 200-day SMA, which could act as a primary support level. A break below the 200-day SMA with a strong bearish daily candle could indicate buyer liquidation and open a bearish opportunity. In that case, a sideways market below the 0.2000 psychological level could extend the bearish possibility toward the 0.1400 area.
On the other hand, if downside pressure below the 0.2000 level is met with a strong bullish bounce from the 50-day EMA, it could offer a solid bullish continuation opportunity. In that case, the buying pressure may resume, potentially pushing the price beyond the 0.2600 psychological level.
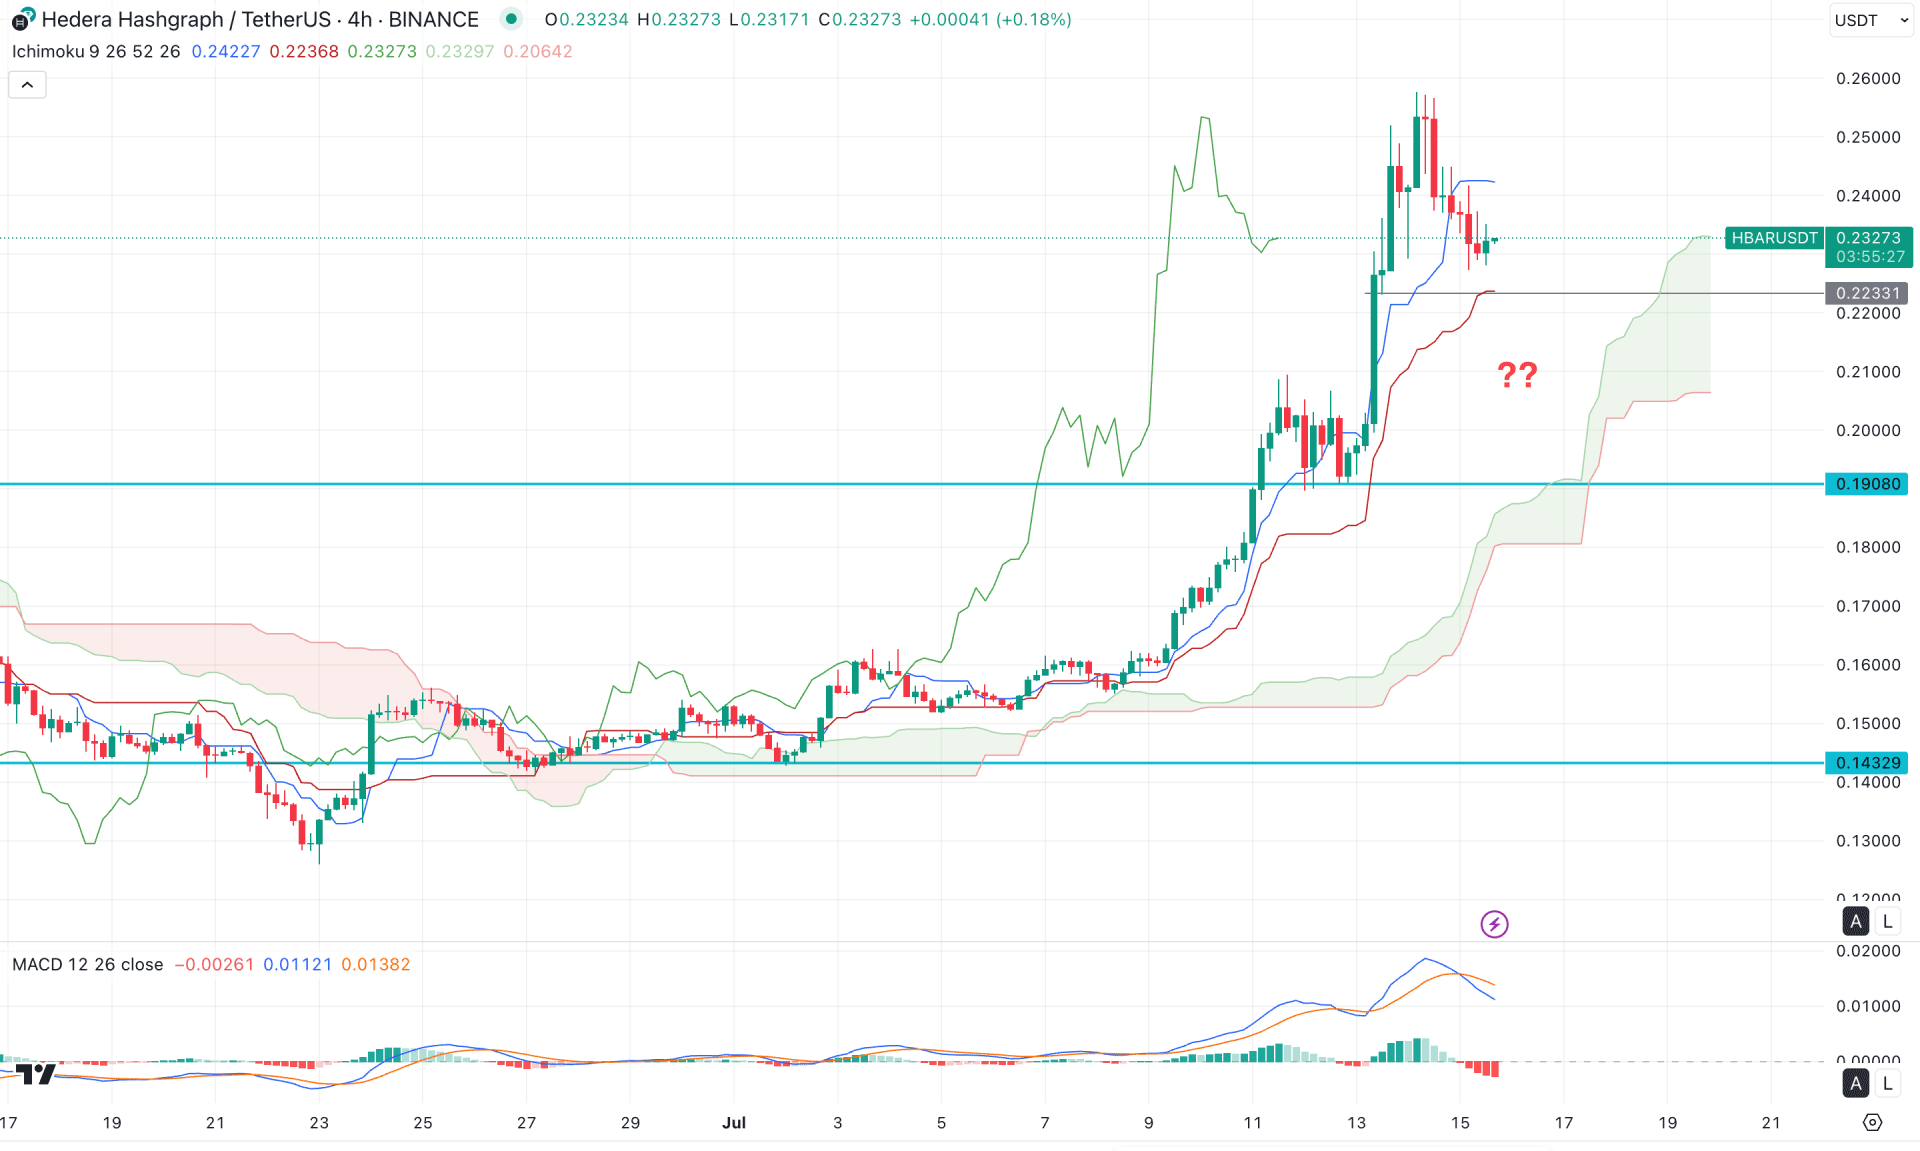
In the four-hour timeframe, a bullish momentum is visible following consecutive higher highs above the Ichimoku Cloud. This indicates a potential bullish continuation, suggesting that further upward pressure may develop.
Within the cloud structure, the future cloud appears positive, as both Senkou Span lines are sloping upward. However, the price is currently undergoing a minor downside correction, with bearish pressure appearing below the Tenkan-sen line.
In the secondary indicator window, the MACD signal line has formed a bearish crossover near the top, accompanied by four consecutive red histograms below the neutral line. This could signal a potential top formation, even though no clear divergence is present.
Based on the current outlook, investors should closely monitor how the price reacts at the immediate support level of 0.2233. The primary strategy would be to look for a short opportunity if the price breaks below the 0.2233 level with a bearish candle. In that case, the price may extend its decline and find support near the 0.2000 area.
On the other hand, a bullish bounce from the Kijun-sen level could trigger renewed buying pressure, potentially leading to a new swing high above the 0.2600 level.
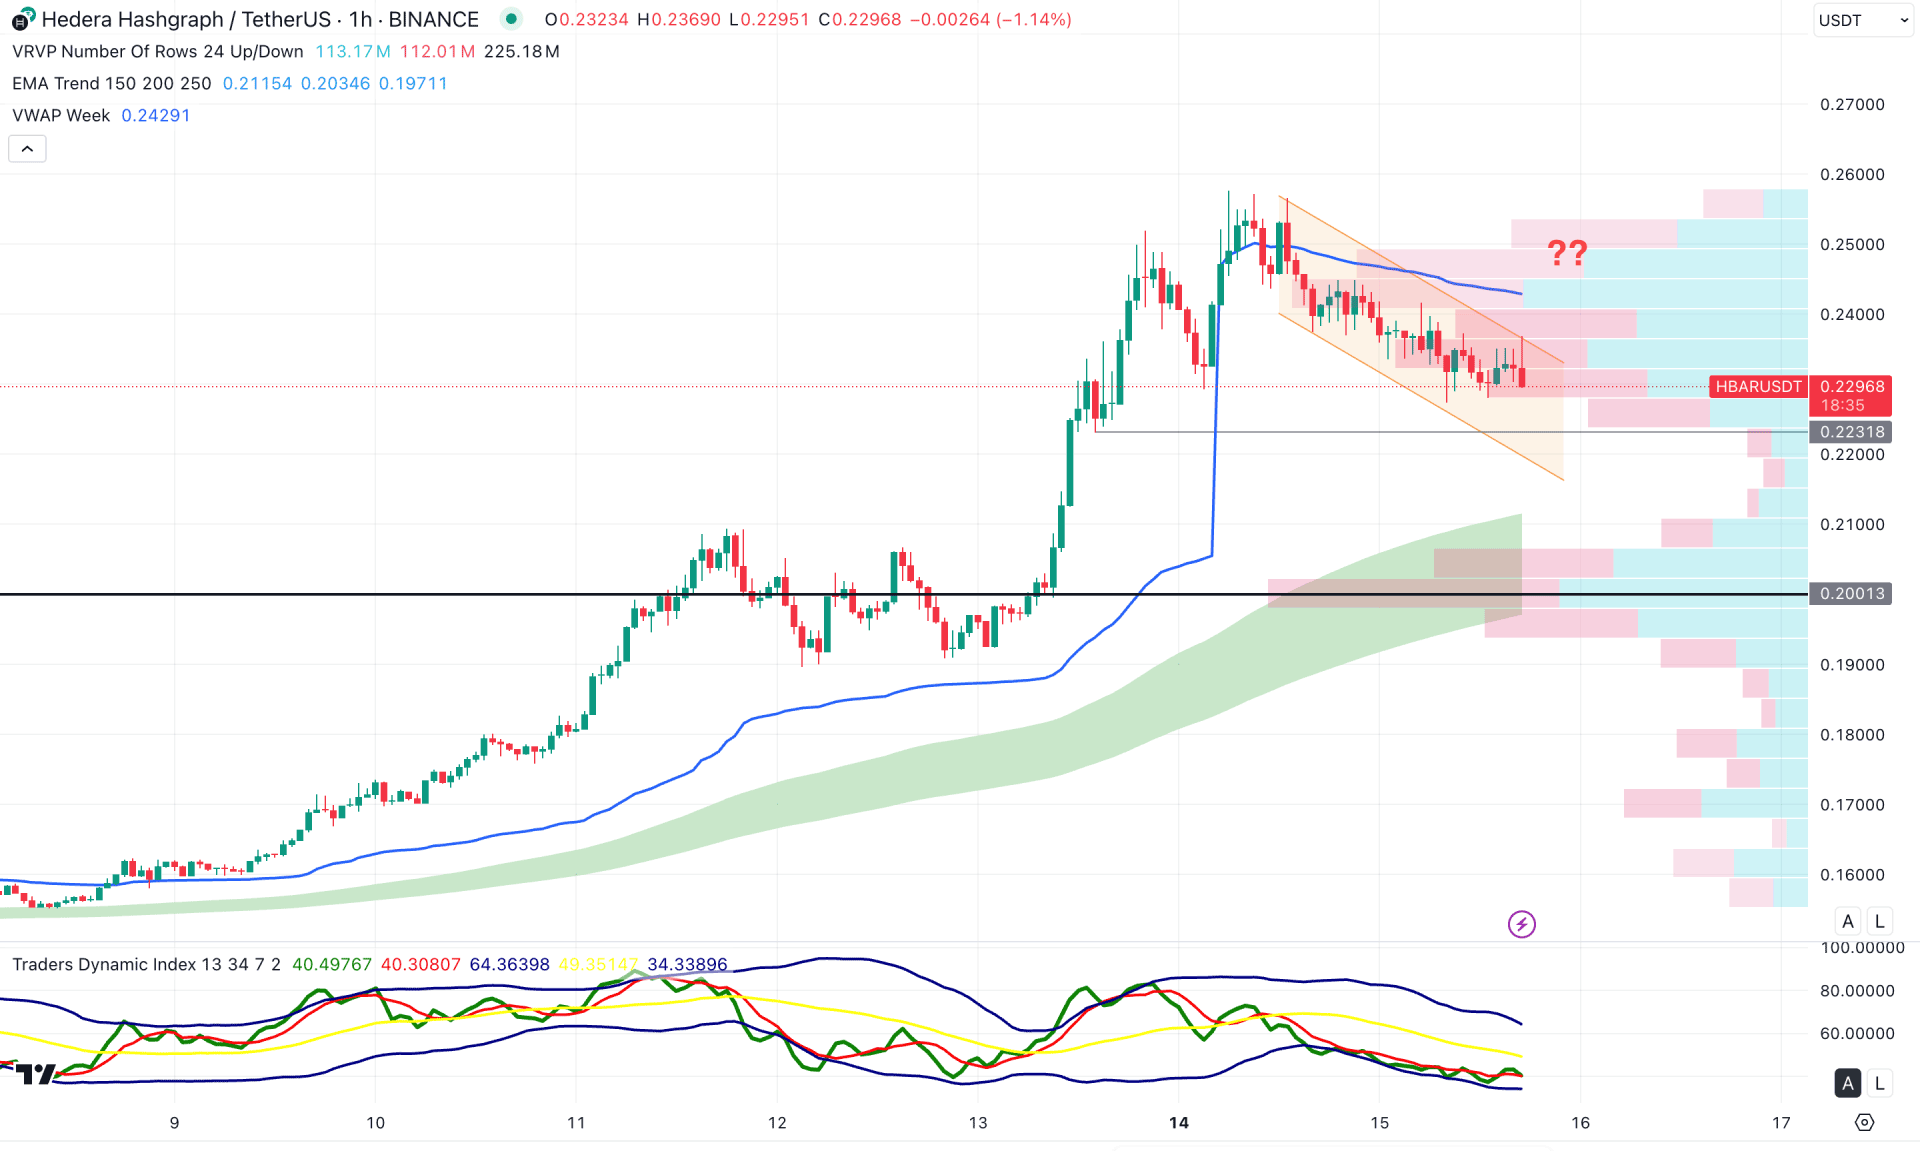
In the hourly timeframe, the recent price is trading within a descending channel where no bullish breakout is visible. The ongoing price action is bearish as selling pressure is present from the channel resistance.
In the main chart, the price has rebounded below the weekly VWAP level, while the MA wave is still intact. Moreover, the visible range high volume line remains below the current price, working as a confluence bullish factor.
Based on this outlook, a bullish break from the descending channel with the TDI level above 50.00 could signal a long opportunity, targeting the 0.2700 level.
On the other hand, the current selling pressure from the channel resistance signals a range extension, where the main aim is to test the 0.2231 static support level.
Based on the overall market structure, HBAR/USDT has reached the peak with no support from the volume. Investors should closely monitor how the price trades in the intraday chart, as any bullish failed attempt could be a short opportunity.


