
Published: January 25th, 2023
Hedera is a layer-1 network developed by Leemon Baird, a renowned computer scientist. It utilizes hashgraph technology and ABFT (asynchronous byzantine fault tolerance) to prevent bad actors and eliminate latency assumptions when reaching a consensus. Compared to other layer-1 networks like Ethereum and BNB Chain, Hedera Hashgraph is faster and cleaner.
Despite being a "sleeping giant", Hedera's technology is being utilized by major companies such as Abrdn and DLA Piper to tokenize financial and real estate assets. Avery Dennison, a company known for producing stickers, is utilizing Hedera's DLT to create distributed barcodes for tracking billions of products.
Hedera is also collaborating with Ubisoft, Servicenow, and Corp Stage to develop a verifiable and auditable ESG reporting platform. Though Hedera Hashgraph is not currently well-known in industries such as DeFi and NFTs, it has the potential to succeed as these companies launch their Hedera-based products.
Let’s see the future price prediction of Hedera Hashgraph from the HBAR/USDT technical analysis:
In the weekly timeframe, the price made three consecutive bullish candles where the current weekly price is still within the body of the previous W1 candle. It is a sign that the bullish trend is still active and there is more space for bulls to take the price above the previous weekly high.
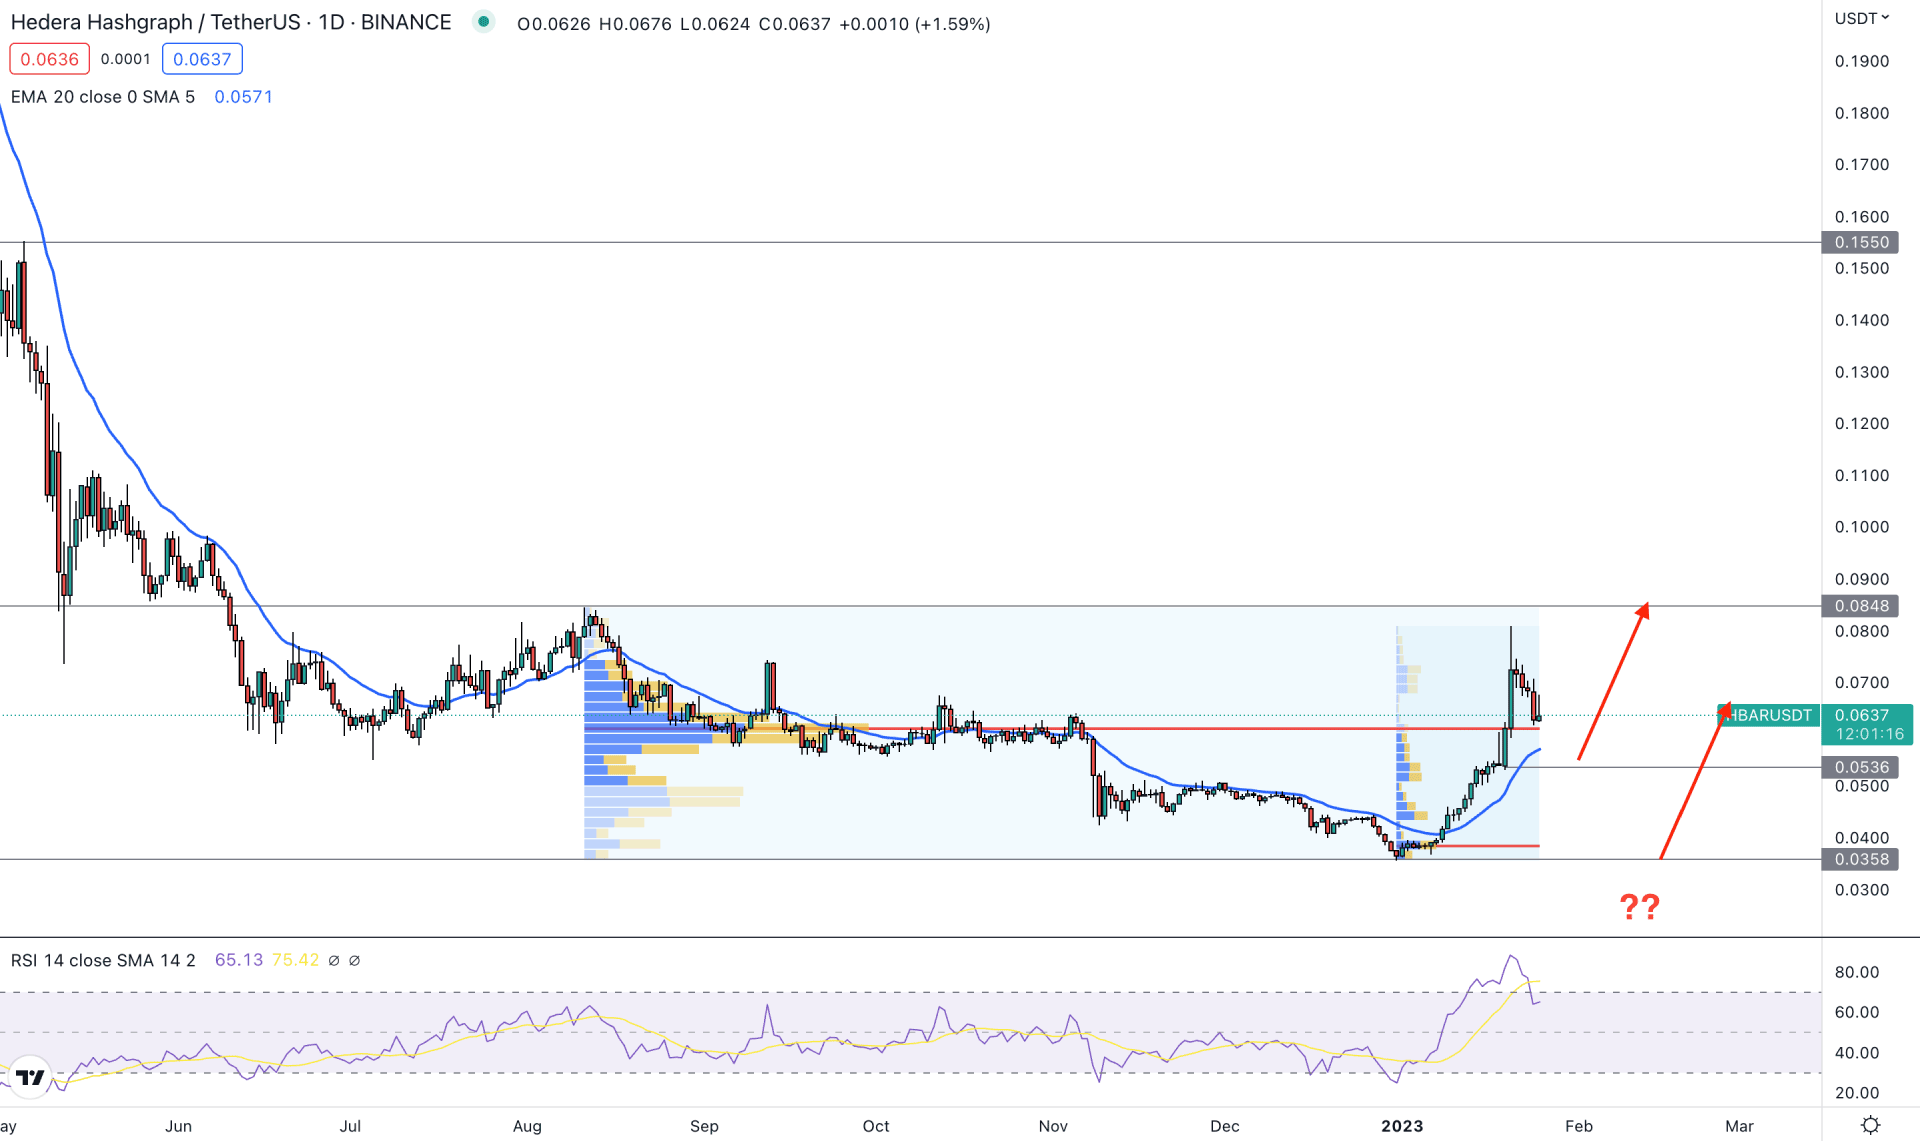
Now come to the daily chart- if you look at the price from left to right, we can see a buy-side liquidity gap and selling pressure from the 0.0848 resistance level. It is a critical swing level from where the price moved down and made a bottom at the 0.0258 level. Based on this behavior, the current tradable range would be 0.0848, high to 0.0358 low. The current price is trading at the premium zone from here. Therefore, taking any bullish entry from the current area needs additional confirmation.
Based on the high volume indicator, the most active trading volume level from January 2023 high to low is at 0.0382 level, which is just above the 0.0258 support area. It is a sign that the buying pressure from the 0.0358 level has strong support from institutional investors.
The bullish pressure is also supported by the dynamic 20 Exponential Moving Average, which is below the current price. Moreover, the Relative Strength Index (RSI) showed a rebound from the 70% level, but still held a strong position above the neutral 50% area.
Based on the daily price structure, bulls have a higher possibility of taking the price up. In that case, any bullish rejection from the 0.0610 to 0.0536 area would be a decent buying possibility toward that 0.0848 level. On the other hand, breaking below the 0.0500 level could extend the price toward the 0.0400 area.
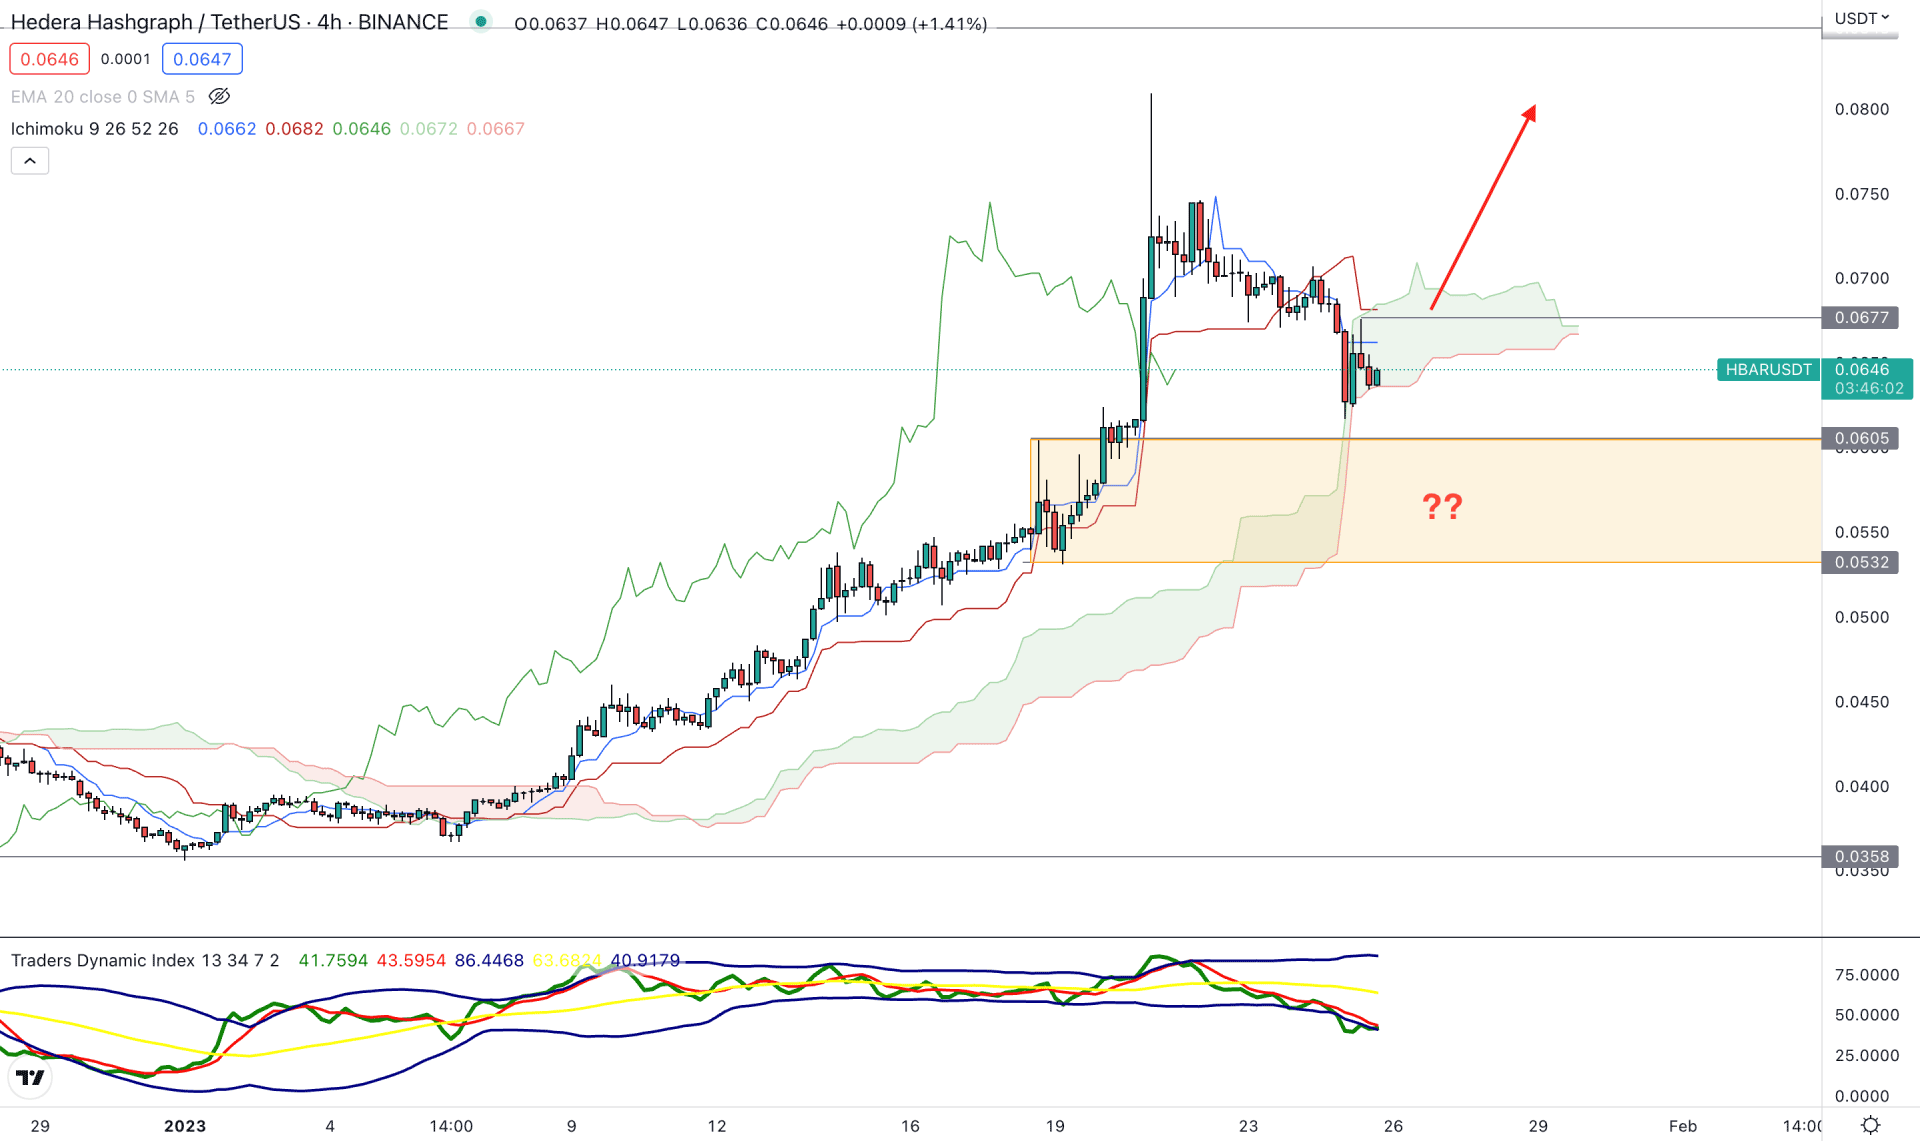
As per the current Ichimoku Cloud structure, the price is trading with a strong bullish pressure above the cloud support. It is a sign that bulls are taking control of the price. In that case, any bullish trading opportunity could offer higher profits.
However, a bearish correction is visible and the current price is trading within the cloud area. In the future cloud, both of the Senkou lines are squeezing, which is a sign of a possible breakout.
The existing buying pressure left the 0.0605 to 0.0532 area untested so a further downside, pressure, and a bullish rejection from this zone could provide another buying opportunity.
In the indicator window, the bearish correction is supported by the trader's dynamic index indicator which is aiming lower below the 50% area.
Based on the current intraday price outlook, a strong buying possibility is valid as long as prices trade above the 0.0532 area. However, breaking below the 0.0500 level could eliminate the current buying possibility and lower the price toward the 0.0356 support level.
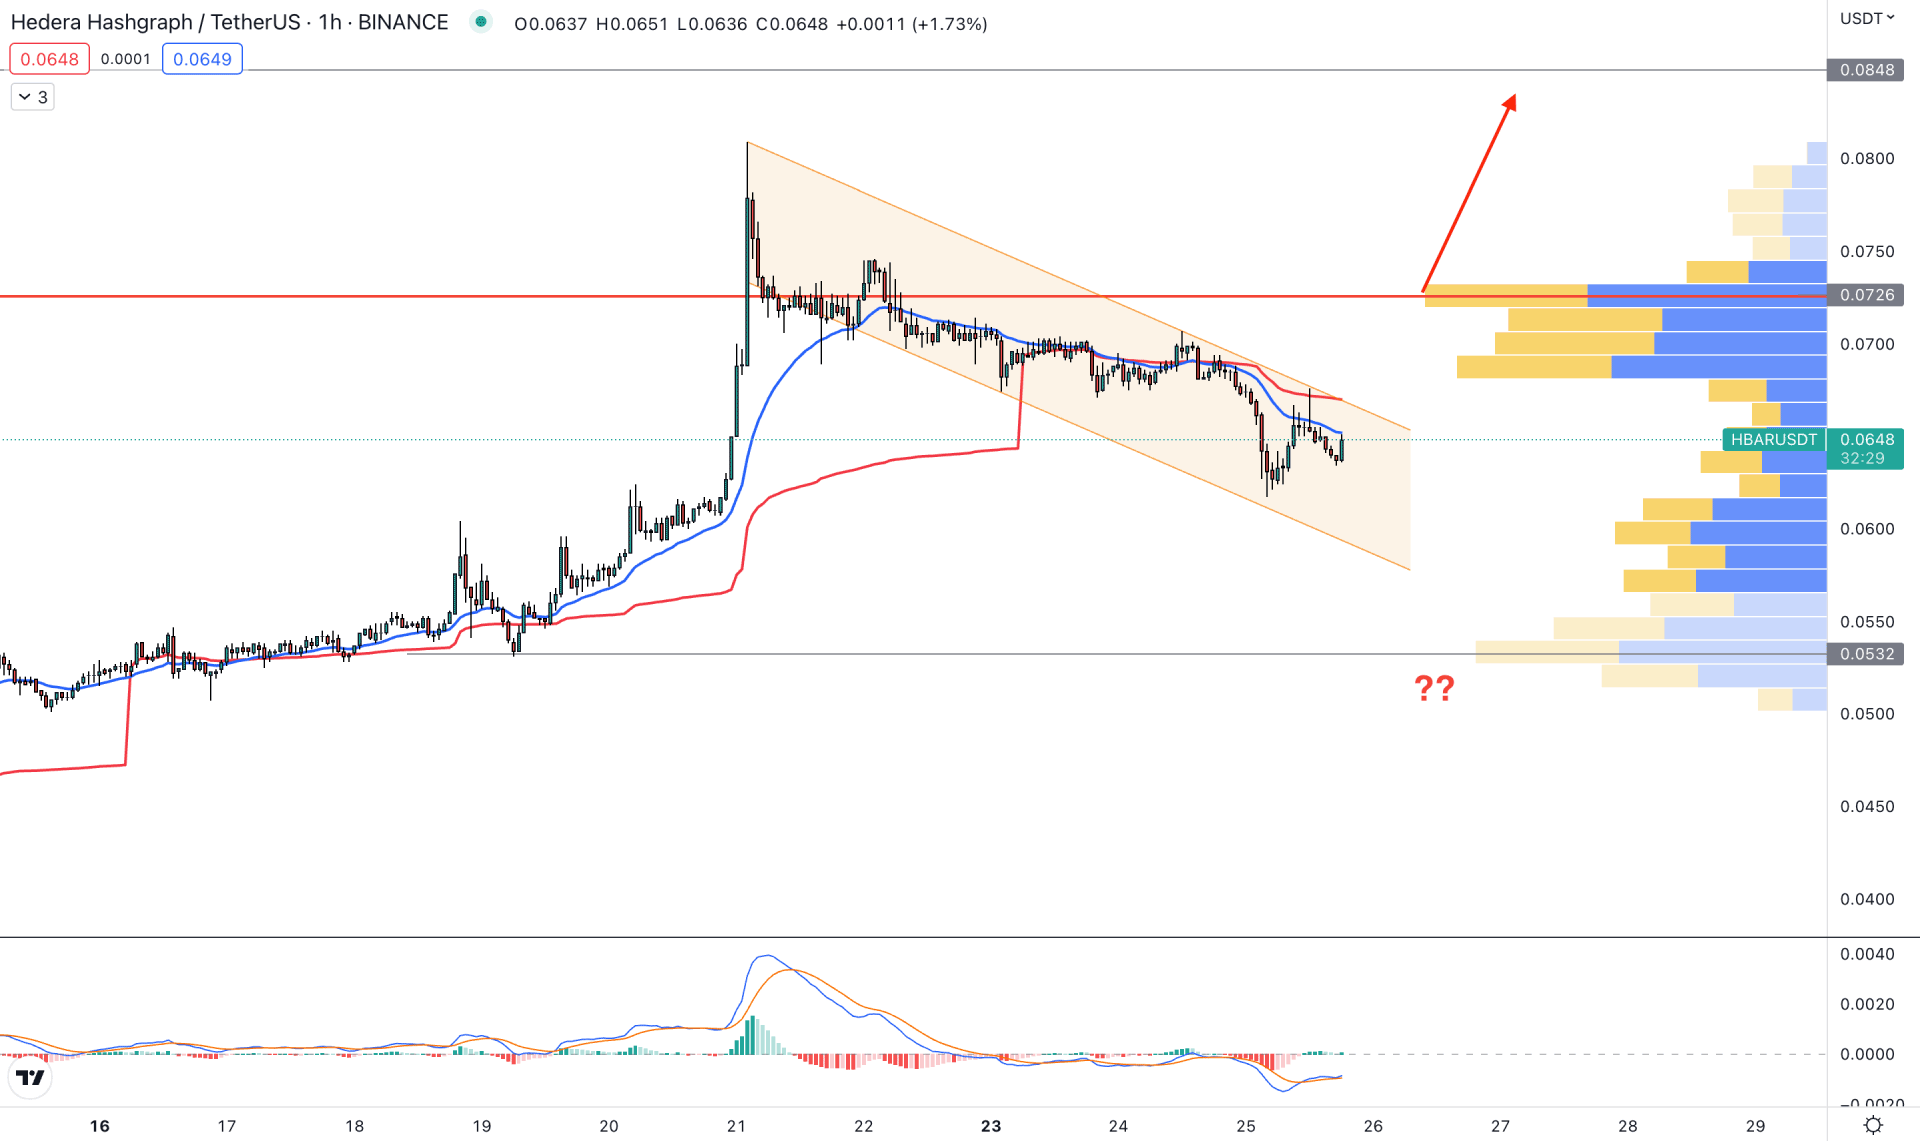
In the hourly timeframe, the current price is trading within a descending channel. Moreover, the visible range high volume level is above the current price. In that case, a bullish pressure with a candle close to the 0.0726 high volume level could validate the bullish entry.
In the main chart, the dynamic 20 EMA and weekly VWAP are above the current price and working as a resistance. In the indicator window, strong corrective pressure is seen as the MACD EMA’s are below the neutral level.
Based on the hourly outlook, a stable price above the dynamic 20 EMA and an hourly close above the 0.0726 level could offer a buying possibility toward the 0.0900 area. However, breaking below the 0.0532 level might alter the current price action and lower the price to that 0.0400 level.
Based on the current multi-timeframe analysis, HBAR/USDT has a higher possibility of taking the price higher. However, the minor bearish correction in the intraday chart is still pending and investors should find a valid bullish rejection from the near-term area.


