
Published: December 3rd, 2020
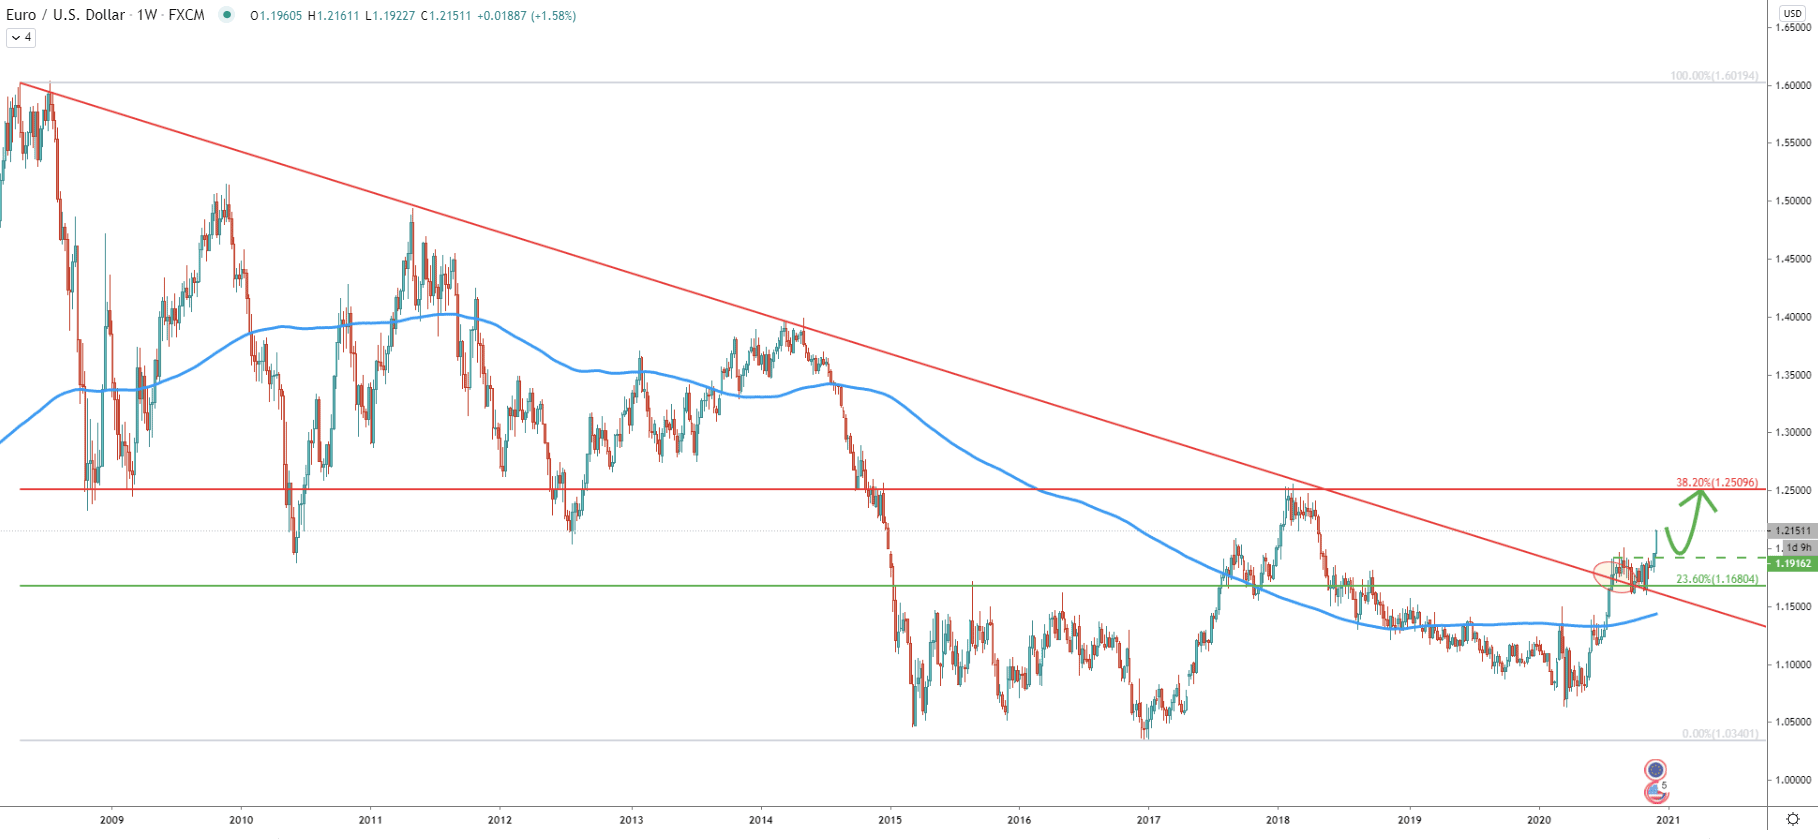
On the weekly chart, the EUR/USD trend remains very bearish, up until the end of 2017, when it bottomed out at 1.0340. Then the price went up and broke above the 50 Exponential Moving Average, although failed to break above the downtrend trendline. But a couple of months ago, the price finally broke above the trendline, which could have been the confirmation of the beginning of a long-term uptrend.
Throughout the consolidation phase, EUR/USD formed support near the 23.6% Fibonacci retracement level at 1.1680. And during the past month, EUR/USD has been in a steady breakout. Just3 days ago it broke a previously established key resistance at 1.2000 psychological level, yet again implying the beginning of an uptrend.
The next Fibonacci resistance, which is 38.2% retracement level, is located near 1.2500, yet another psychological level. Perhaps this will be the end of the current rally, should it continue. And to the question, if the rally will continue, well, considering a strong uptrend during recent days, it would be reasonable to have some correction down. Usually, the price is correcting down to the point of the previous resistance, in our case, this is a 1.2000 support area. Maybe EUR/USD will correct, but let’s see on the lower timeframes whether there is any reason for a pullback.
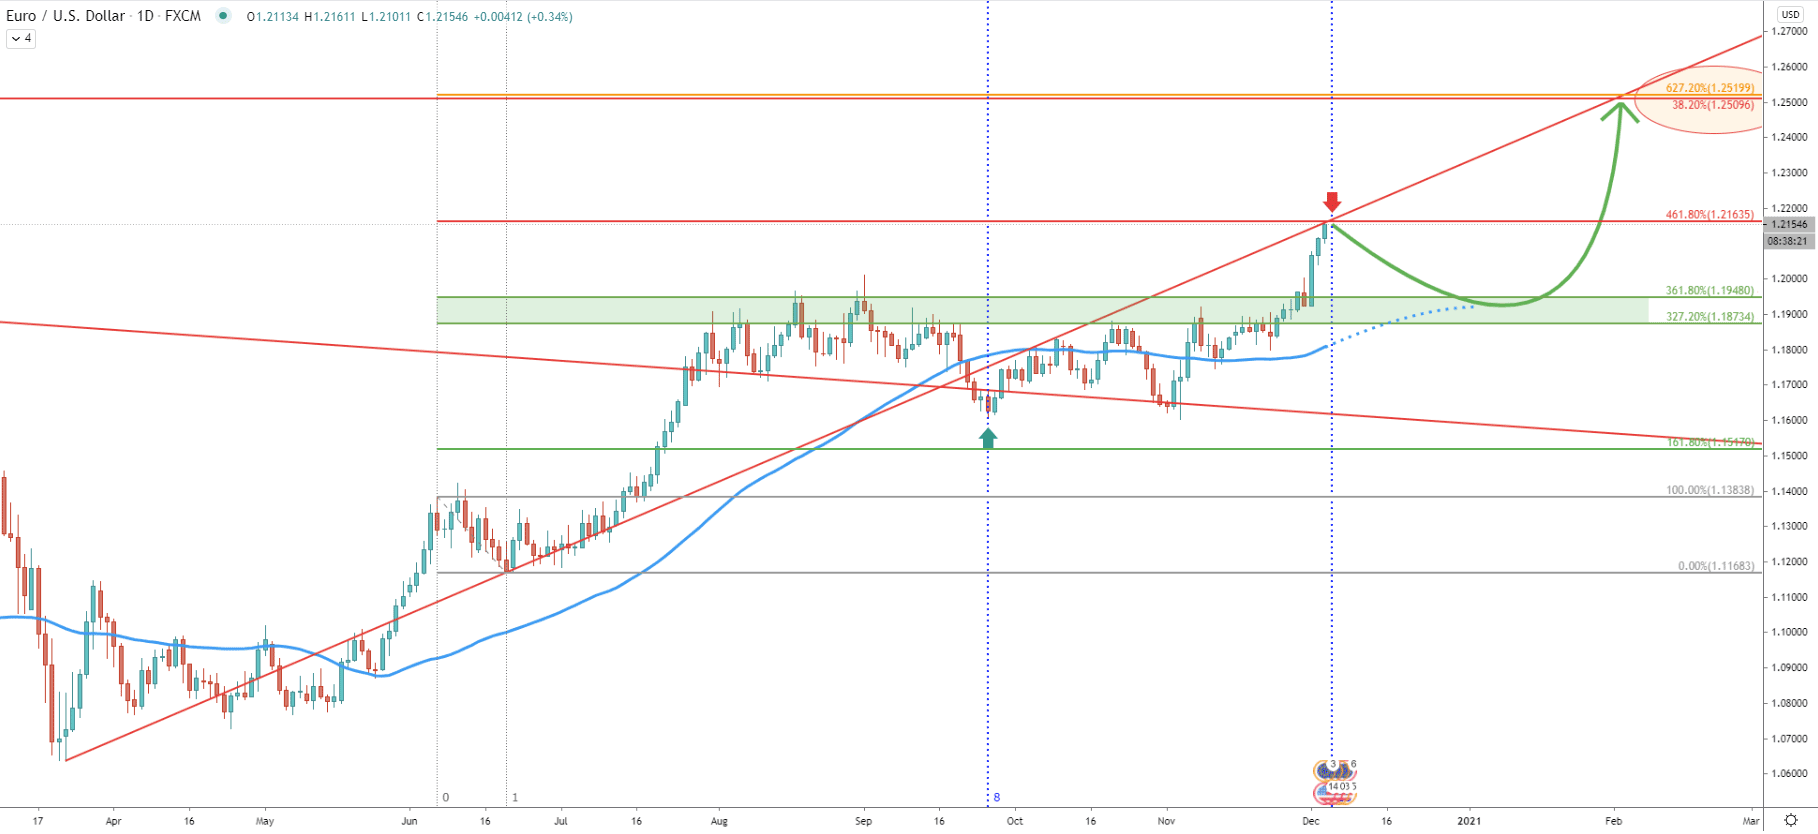
On the daily timeframe, EUR/USD has approached an average-price uptrend trendline, which might be acting as the resistance. But this could only be the case if the 461.8% Fibs resistance level at 1.2163 will be respected, with the daily close below this level. If this will be the case today, then a correctional move down might take place. This is because there will be a double rejection of the resistance indicators as well as the new Fibonacci cycle starting with the next daily candle.
The pullback might take the price down to the 1.1870 - 1.1950 support area, which is confirmed by two Fibs as can be seen on the chart. Besides, this support goes inline with 50 EMA, which might also provide a strong obstacle from the further price decline.
If/when the support area gets rejected, uptrend continuation is the most likely scenario. EUR/USD should be expected to continue trending up, potentially towards the 1.2500 area, which on this chart is confirmed by two Fibs.
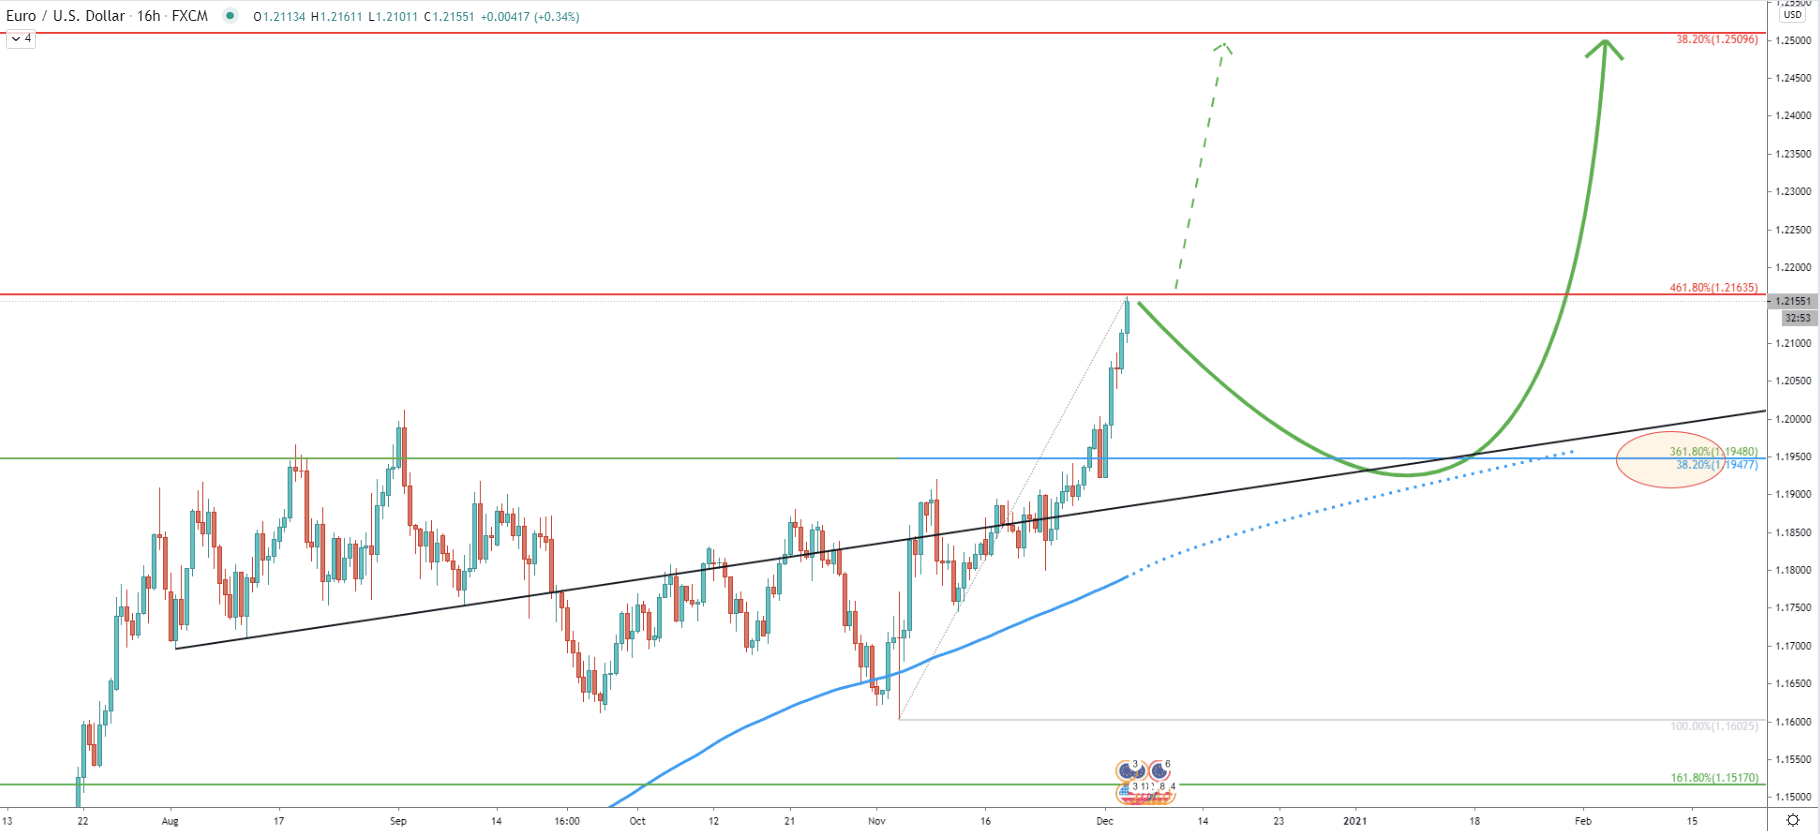
But if daily and perhaps the weekly close will be above the 1.2163 resistance, the uptrend might not even stop. In this case, there is a good probability, that EUR/USD will continue rising non-stop towards the 1.2500 area. However, if resistance will get rejected, the price might drop quite fast towards the 1.1950- 1.2000 support area quite fast, which on this chart is confirmed by 2 Fibs, 200 EMA as well as the average-price uptrend trenldine.
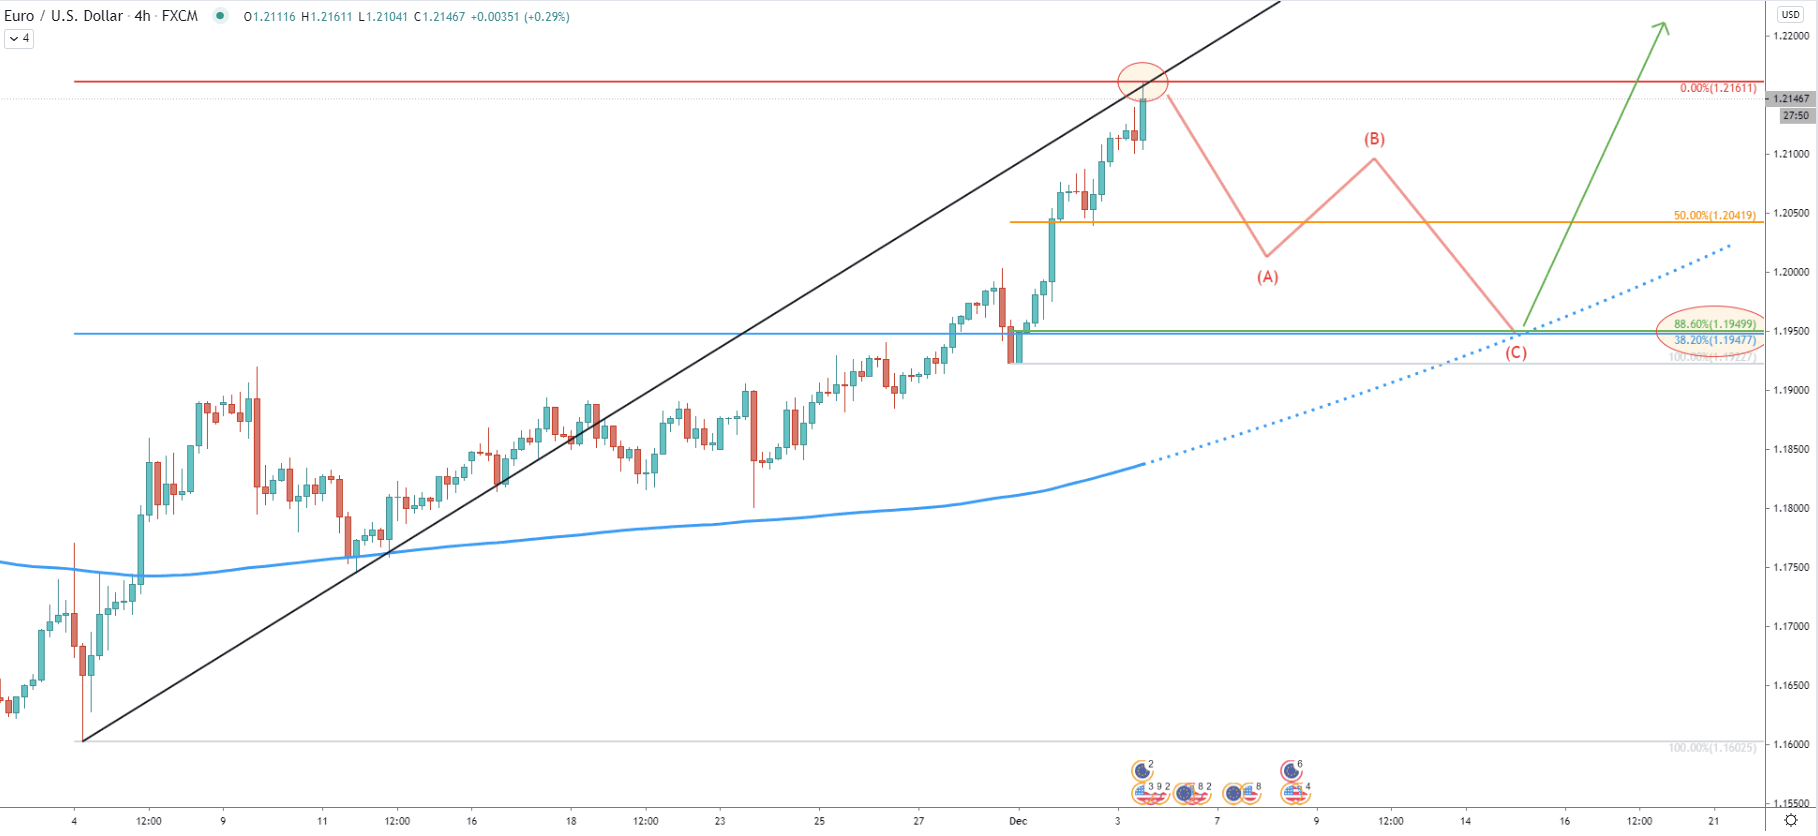
Yet another scenario after the rejection of the resistance, which on this chart is confirmed by yet another average-price uptrend trendline, is an ABC correction down. On this chart, the 1.1950 support is confirmed by two Fibs, as well as the 200 EMA, suggesting that price might test this demand area by mid-December. And as can be seen, now there is another Fibonacci retracement level confirming the 1.1950 support. This is 88.6% Fibs, applied to the last impulsive move up.
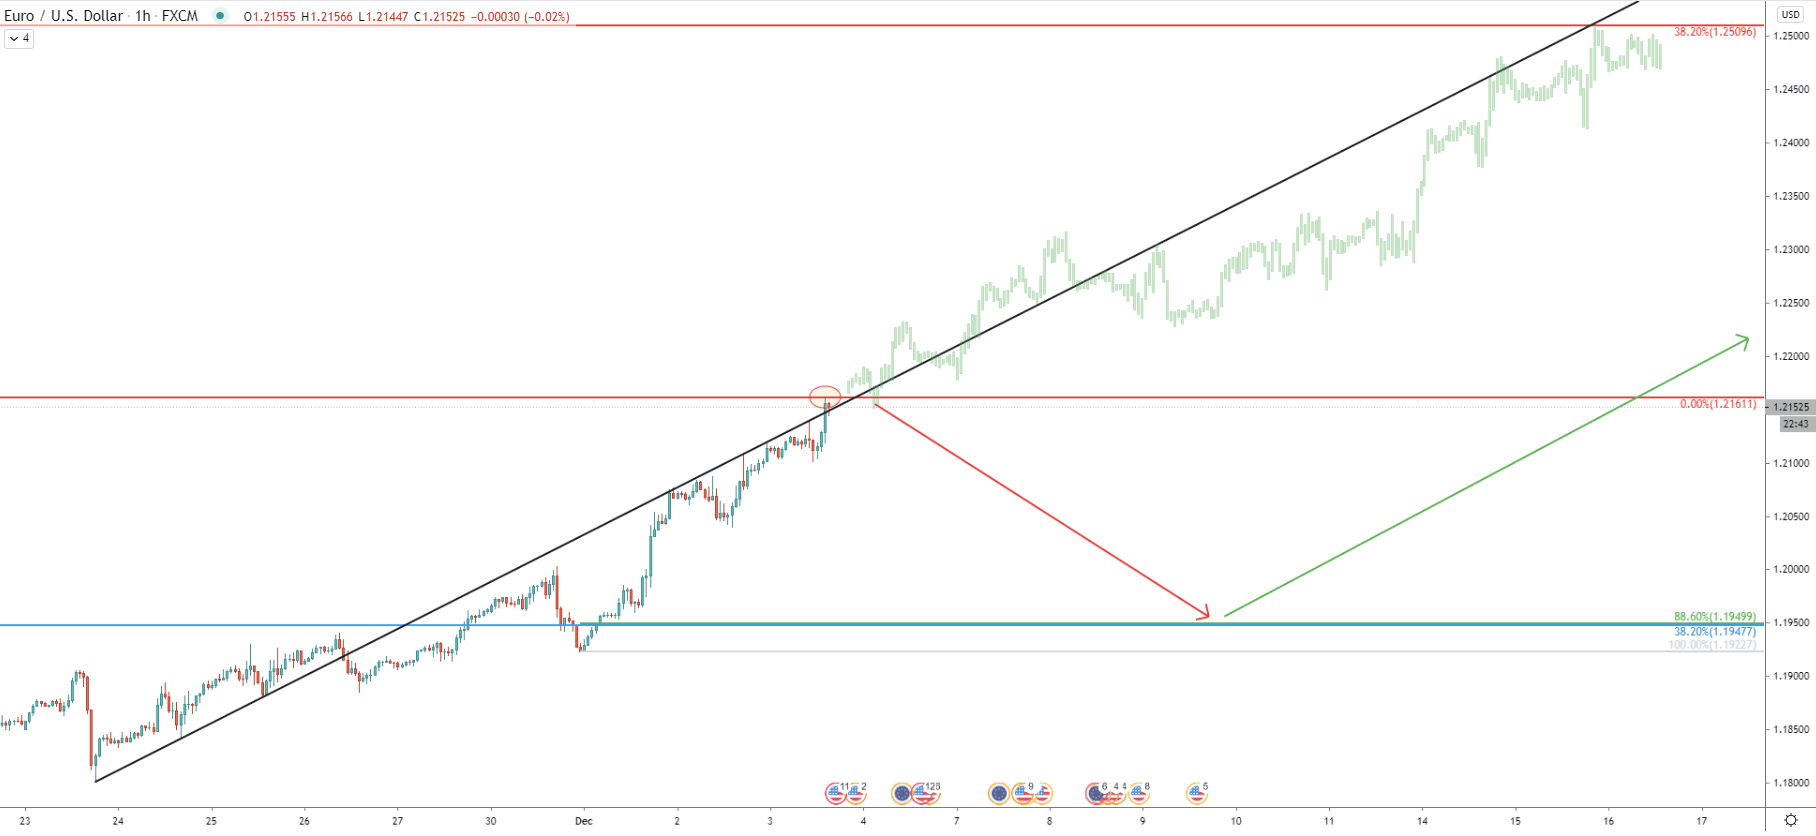
But what if the price breaks to the upside. On the hourly chart, a potential scenario of an uptrend can be visualized. EUR/USD is likely to continue rising steadily, eventually reaching 1.2500 resistance as well as bouncing off the average-price upturned trendline. It is possible, that in case of an uptrend continuation, EUR/USD will move by 350 in the next two weeks.
The EUR/USD trend remains heavily bullish, and it seems that it is only a matter of time before the uptrend will continue. On the other hand, price is currently facing multiple resistance indicators, and upon rejection, this should result in a strong downside correction.
Based on multiple Fibonacci retracement levels and several average-price uptrend trendlines, the EUR/USD final upside target could be as high as 1.2500 physiological level.
It would be quite unreasonable to talk about the change in trend at this point. Yes, the correction can take place, and it can be very strong. Although to completely invalidate the bullish forecast, EUR/USD will have to break below the 1.1740 low, established prior to the recent rally.
Support: 1.1950, 1.1870, 1.1740
Resistance: 1.2160, 1.2500


