
Published: May 19th, 2021
Google beat the earning expectation in the Q1 of 2021 with an investment gain of $4.8 billion. Search advertising revenue came at $31.88 billion, 30% higher than the estimate of $29.8 billion. Moreover, the YouTube revenue was increased by 49% to $6.01 billion. Furthermore, the company announced a new $5 billion Google stock buyback that boosted Google earnings.
Under the supervision of Google CEO Sundar Pichai, Google made a lot of improvements in its transparency. However, Google’s fast-growing cloud computing remained unprofitable due to high investment.
Besides the development, any sign of strict regulation may regain hopes for Google stock sellers. Let’s see the upcoming price direction from the Google Stock technical analysis:
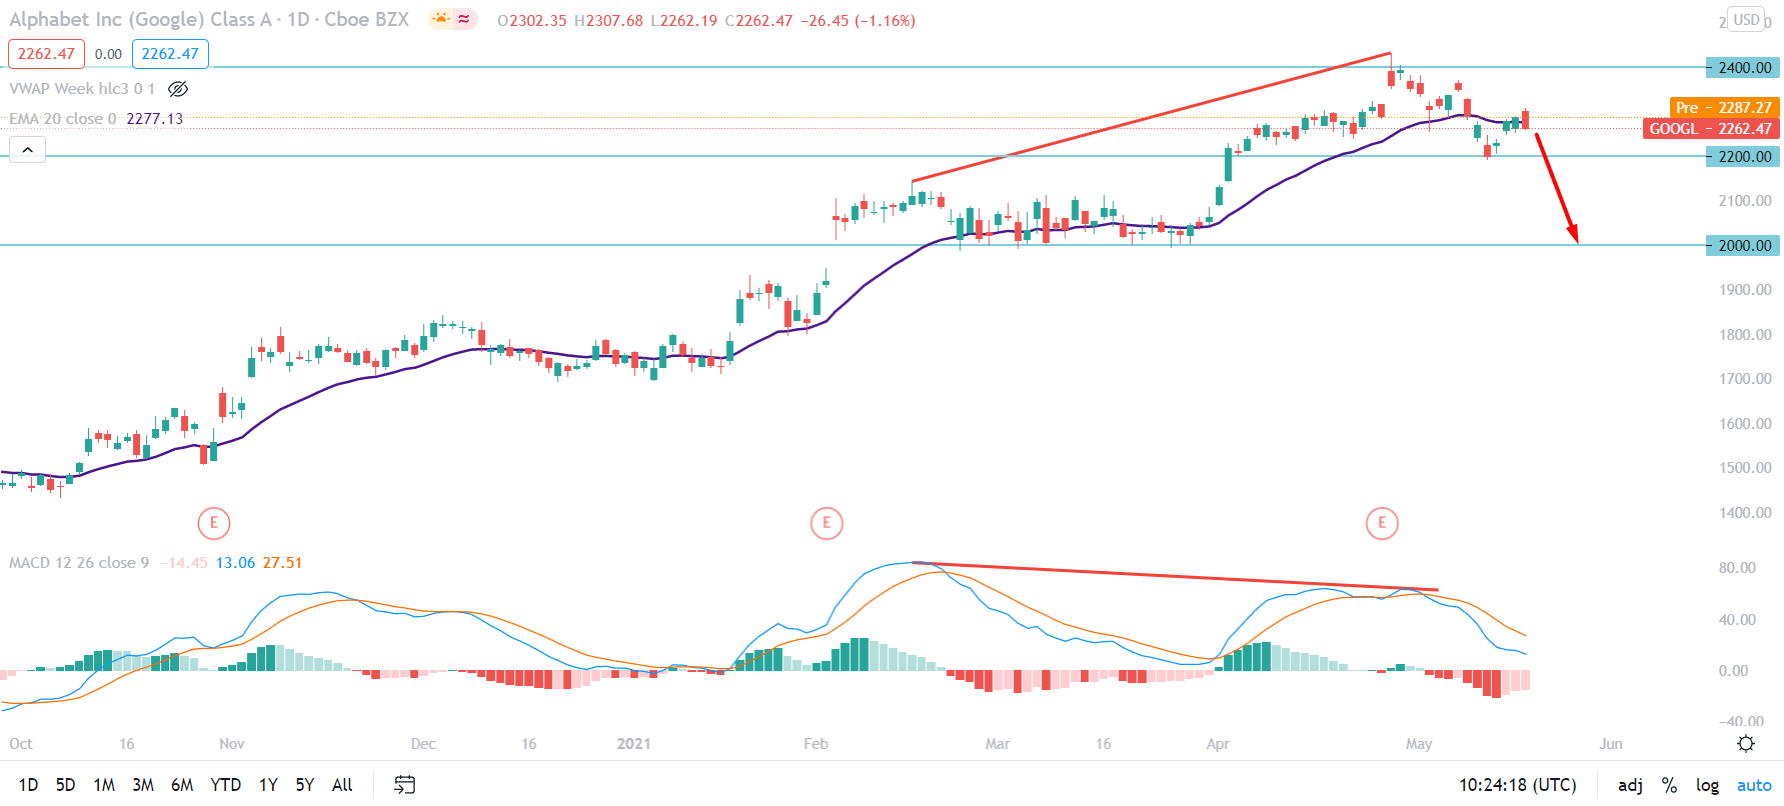
Google stock started the bullish momentum from the COVID-19 market crash that made it to the bottom at 1007.30 level. After that, the price began to rise without any significant correction and made an all-time high at 2430.00. However, the price failed to sustain above the 2400.00 psychological level and rejected the price with a Shooting star candle on the daily chart. Therefore, as bears are holding the price below the 2400.00 level since May 2021, it has a higher possibility to extend the bearish correction.
In the above image, we can see that the price moved higher by creating new swings and became volatile after testing the 2400 level for the first time. Moreover, the regular divergence with MACD works as a possible turning point here, but traders should wait for more confirmations.
The price broke below the dynamic 20 EMA in the most recent chart and made a swing low near the 2200.00 level. Currently, the dynamic 20 EMA is working as a minor resistance to the price, and a bearish daily close below the 2200.00 level may increase the bearish possibility.
Conversely, any bullish daily close above the 2400.00 level may alter the current market that may take the price higher above the 2430.00 level.
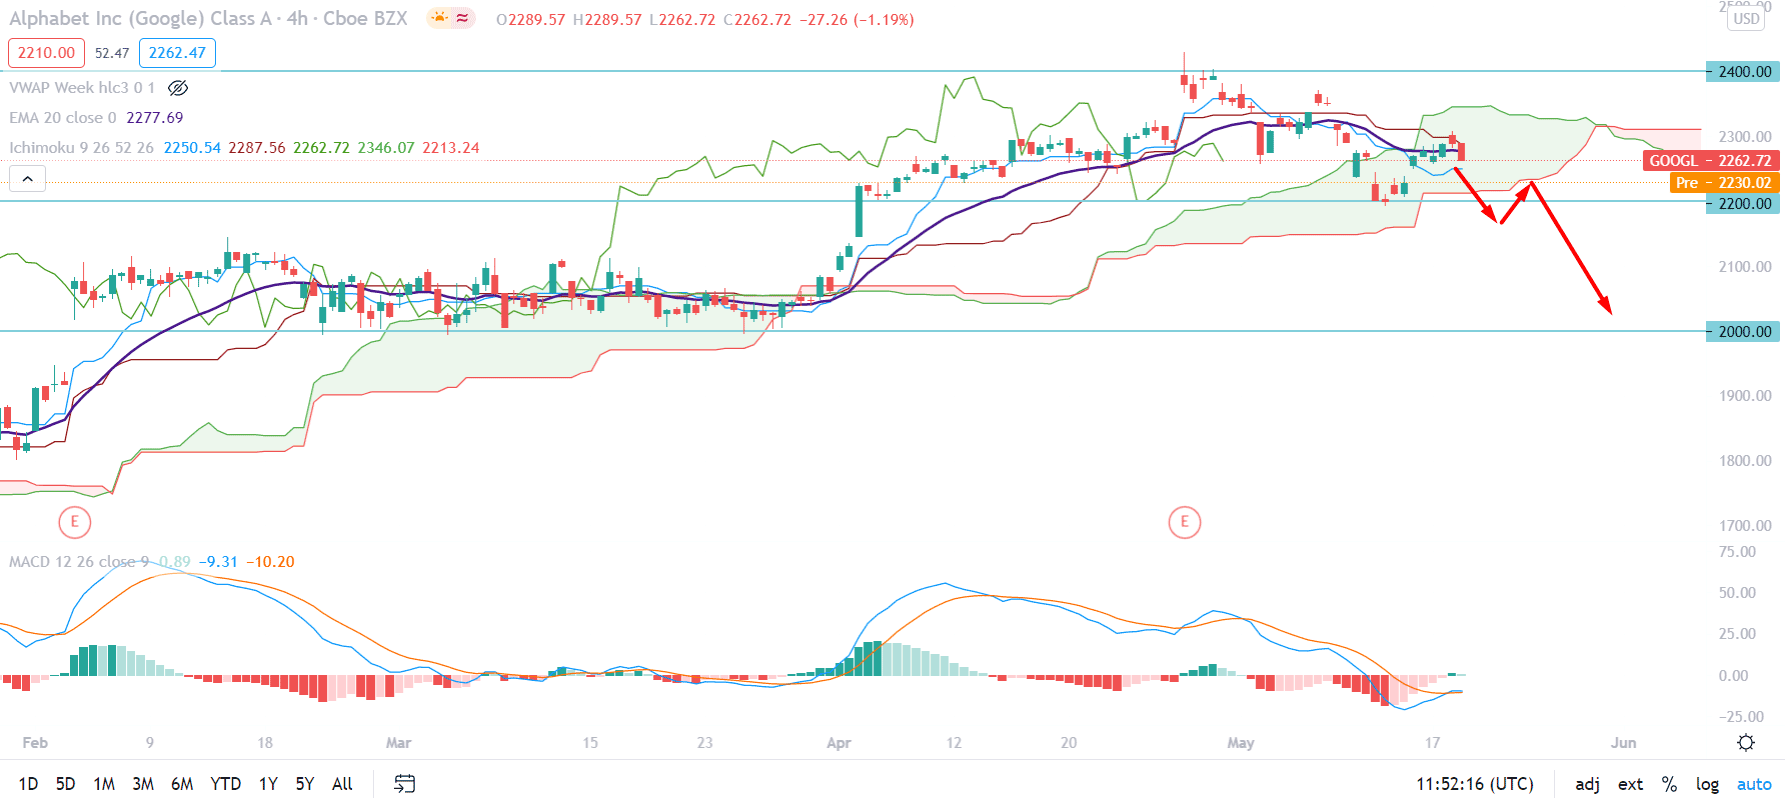
Based on the Ichimoku Cloud, Google stock moved higher from the cloud support before making the all-time high but failed to hold the momentum. As a result, the price moved lower, and is currently trading within the Kumo Cloud. Therefore, as long as the price remains within the cloud, investors should wait for a breakout.
Within the Kumo Cloud, the price tried to move higher above the Senkou Span A but failed, which indicates that the bearish possibility is high. Moreover, the Senkou Span A is below the Senkou Span B in the future cloud, and Chikou Span is below the price.
The price is getting resistance from the dynamic 20 EMA and Kijun Sen, where a solid bearish H4 close below the Kumo Cloud may initiate a bearish trend with the target of 2000.00 level.
On the other hand, investors should wait for a daily close above the 2400.00 level before considering the current structure as invalid.
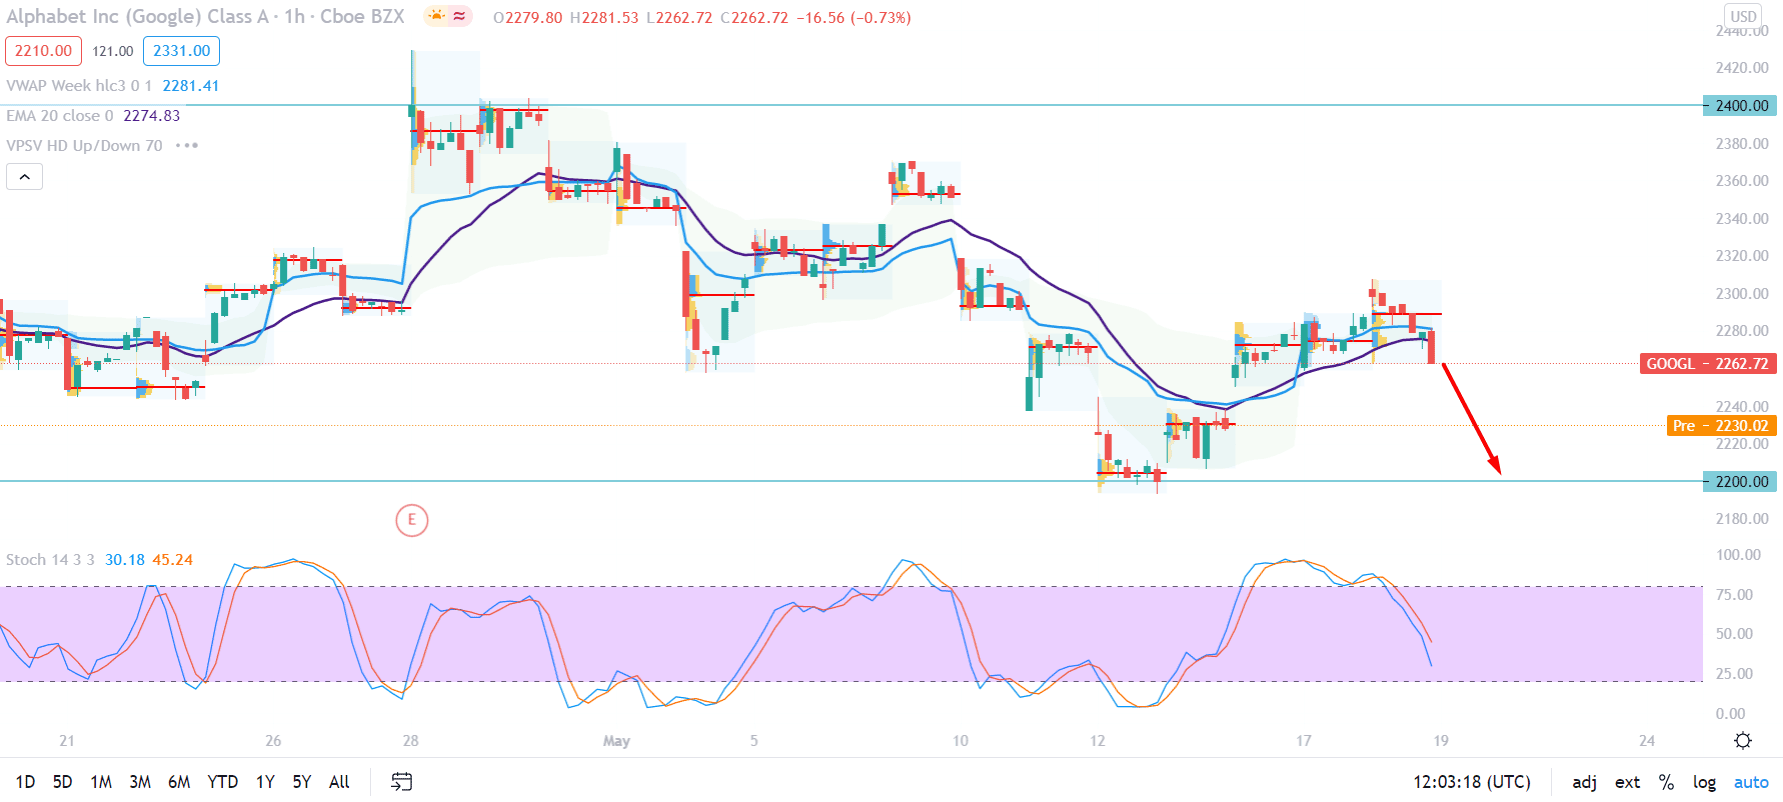
In the intraday chart of Google Stock, the price is trading below the intraday high volume level of 2289.23 level with a strong H1 candle. Moreover, the price made a new low at 2200.00 level after testing the 2430.00 level. Based on this structure, the price may make another swing low below the 2200.00 level in the coming session.
We can see that the price moved below the dynamic 20 EMA and vwap with strong bearish pressure in the above image. Therefore, as long as the price is trading below the 2289.23 level, it may come lower and test the 2200.00 level before setting further price direction. Moreover, the Stochastic Oscillator is moved below the 50 levels, indicating further bearishness to the price.
On the other hand, any strong bullish H1 close above the recent swing high of 2307.25 may alter the current market structure and take the price higher towards the 2400.00 level.
As per the current observation, bears have a higher possibility to take the price lower below 2200.00 level in the coming days. Moreover, any sign of tough regulation may increase the bearishness of the price.
On the other hand, investors should wait for a bullish daily close above the 2400 level that may take the price higher above the 2430.00 level.


