
Published: January 20th, 2022
Google’s growth factors are solid as its parent company, Alphabet showed a massive 65% gain in 2021. On the other hand, Nasdaq 100 and S&P 500 showed barely 20% gain over the last year. Tech giants Microsoft, Meta, and Apple also showed a decent return in 2021, but none beat Google.
However, with the recent surge in the inflation rate with the labor shortage and interest rate hike, investors wonder whether Google stock can maintain its growth in the coming days or not.
According to the latest nine months period ended 30 September, Google’s revenue is up by 45% while the profit was doubled to $55.4 billion, from $25 billion. Another strength of Google investors is its video streaming platform, YouTube, which showed a massive 43% growth in the latest growth for the first time. Unlike Microsoft and Meta, Google is not facing enough pressure from Apple’s iOS restriction.
Overall, with the growth in the Cloud Computing business, advertising, and massive user adoption to digital platforms, Google Stock (GOOGL) has become a potential investment opportunity.
Let’s see the upcoming price direction from the Google Stock (GOOGL) technical analysis:
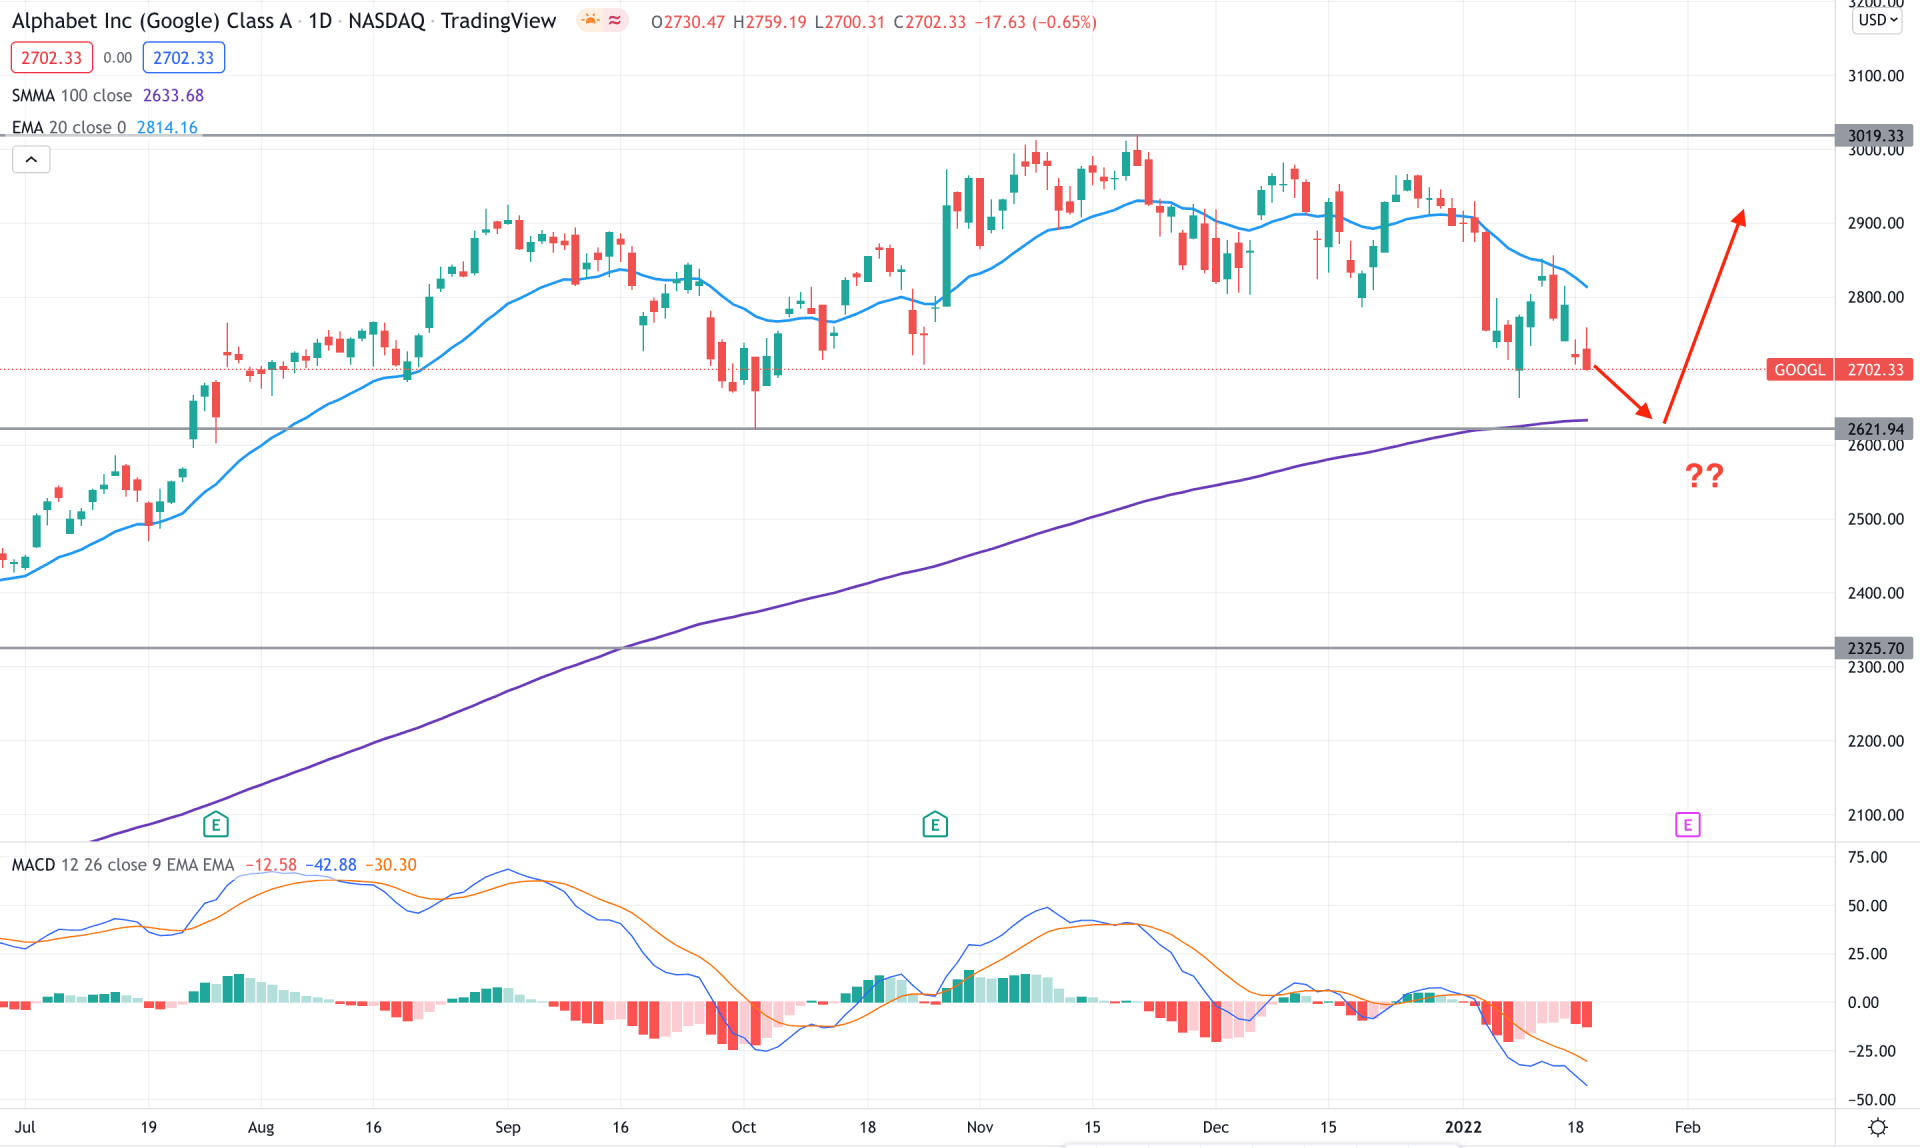
Google Stock consolidated after reaching the all-time high level in mid-November and made a new swing low at the yearly opening. The corrective momentum at the all-time high and breaking below the dynamic 20 EMA is a sign that bulls are taking profits, and the price needs more indication before showing a buying sign.
The above image shows that the MACD Histogram is bearish and aiming lower while the dynamic 20 EMA works as minor resistance. On the other hand, the broader market trend is still bullish as the price is above the 100-day moving average. Therefore, as long as bulls are holding the price above the 2621.94 support level a buying pressure may come. In that case, any daily close above the dynamic 20 EMA would be a buying opportunity.
On the other hand, a break below the 2621.94 level would lower the price towards the 2325.00 area from where another buying sign may appear.
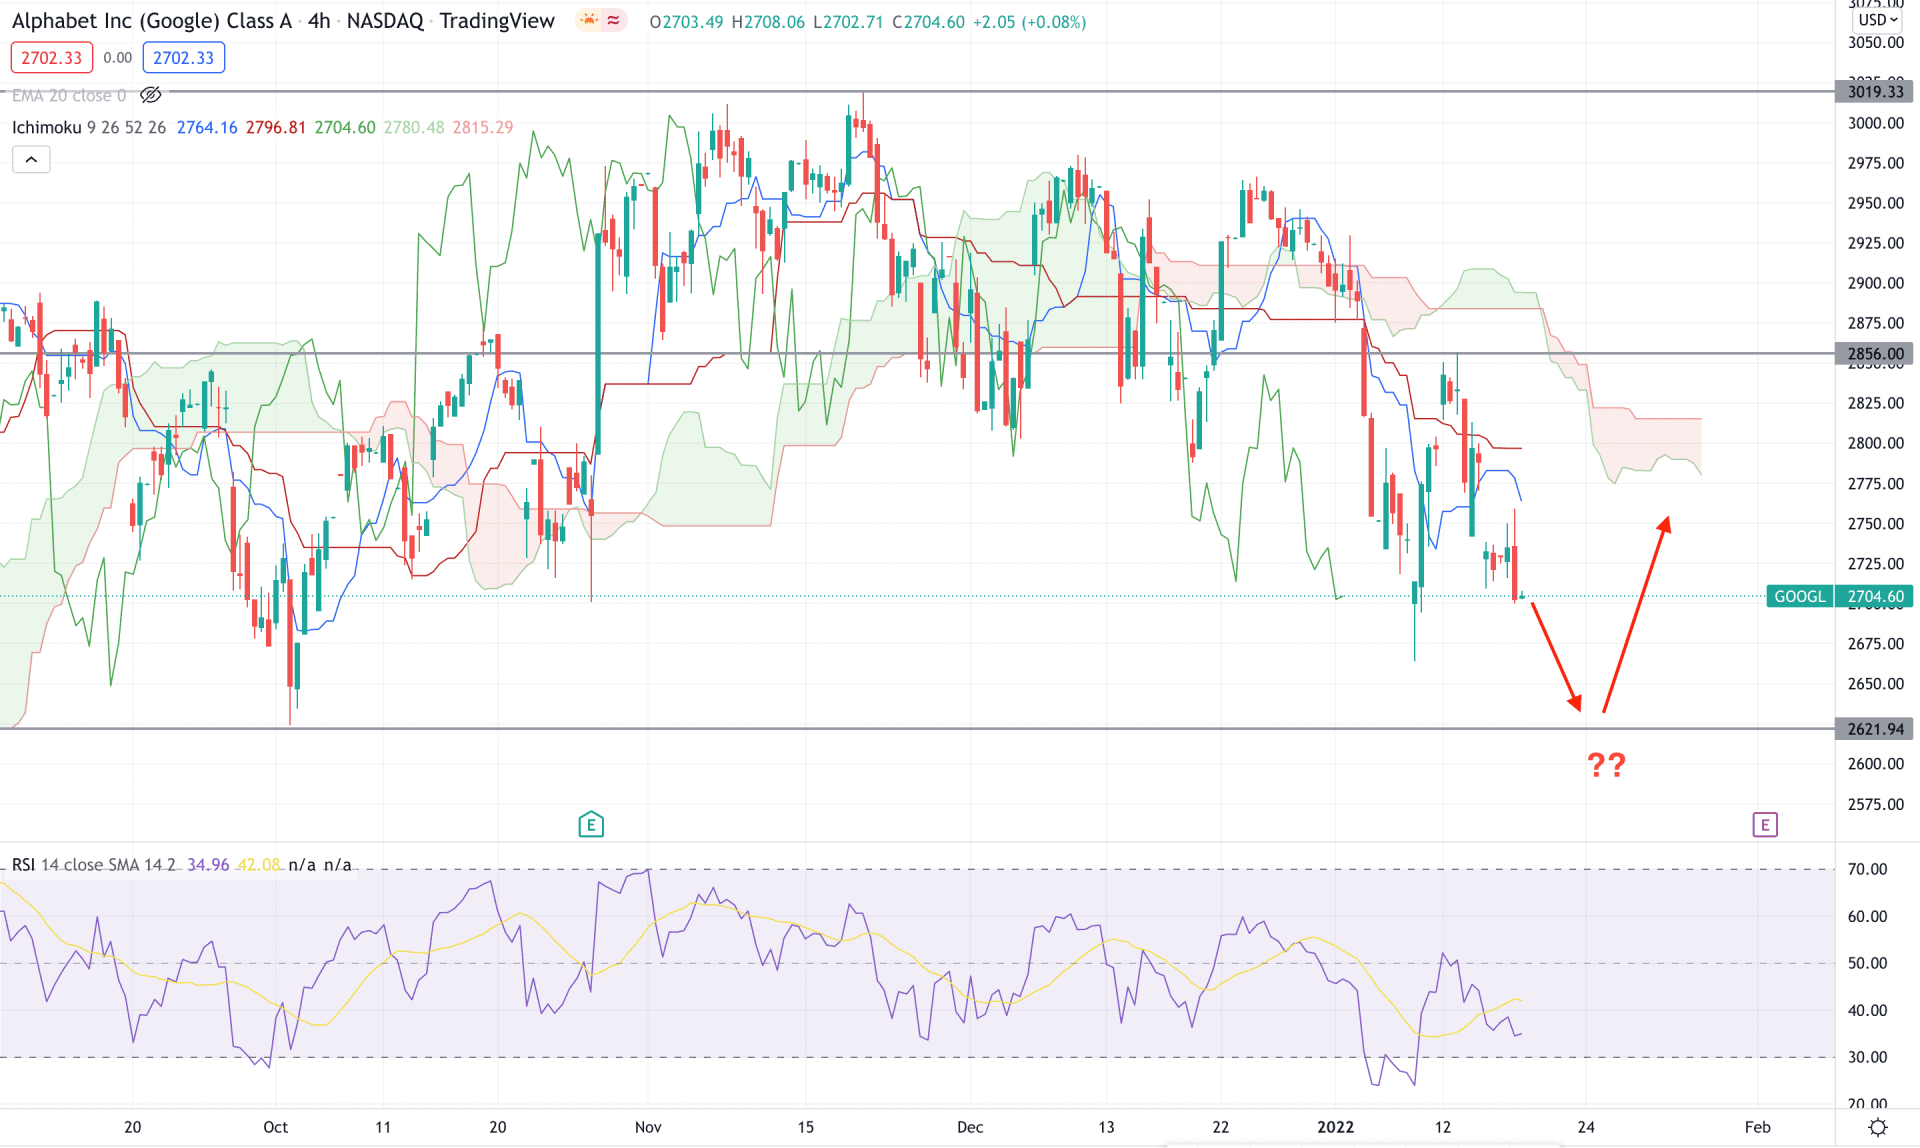
Although the daily context is bullish for GOOGL, the intraday price action shows another picture. According to the Ichimoku Cloud analysis, Google stock is trending lower as the most recent price moves below the dynamic Kijun Sen while the Kumo Cloud works as a dynamic resistance. In the future cloud, the Senkou Span A is below the Senkou Span B and aiming lower while the Lagging Span is below the price.
The above image shows how the price trades below the dynamic Tenkan Sen and Kijun Sen while the Tenkan Sen is below the Kijun Sen. On the other hand, the RSI changed the direction from 50 levels and moved lower where the buying opportunity was not wise until the RSI showed a reversal from 30 areas.
Based on the H4 context, a direct touch to the 2621 support with an H4 close above the dynamic Tenkan Sen would be a buying opportunity in this instrument where the primary target would be the 3019.00 area. On the other hand, any test and bearish rejection at the 2856.00 level would be a selling opportunity towards the 2500.00 level.
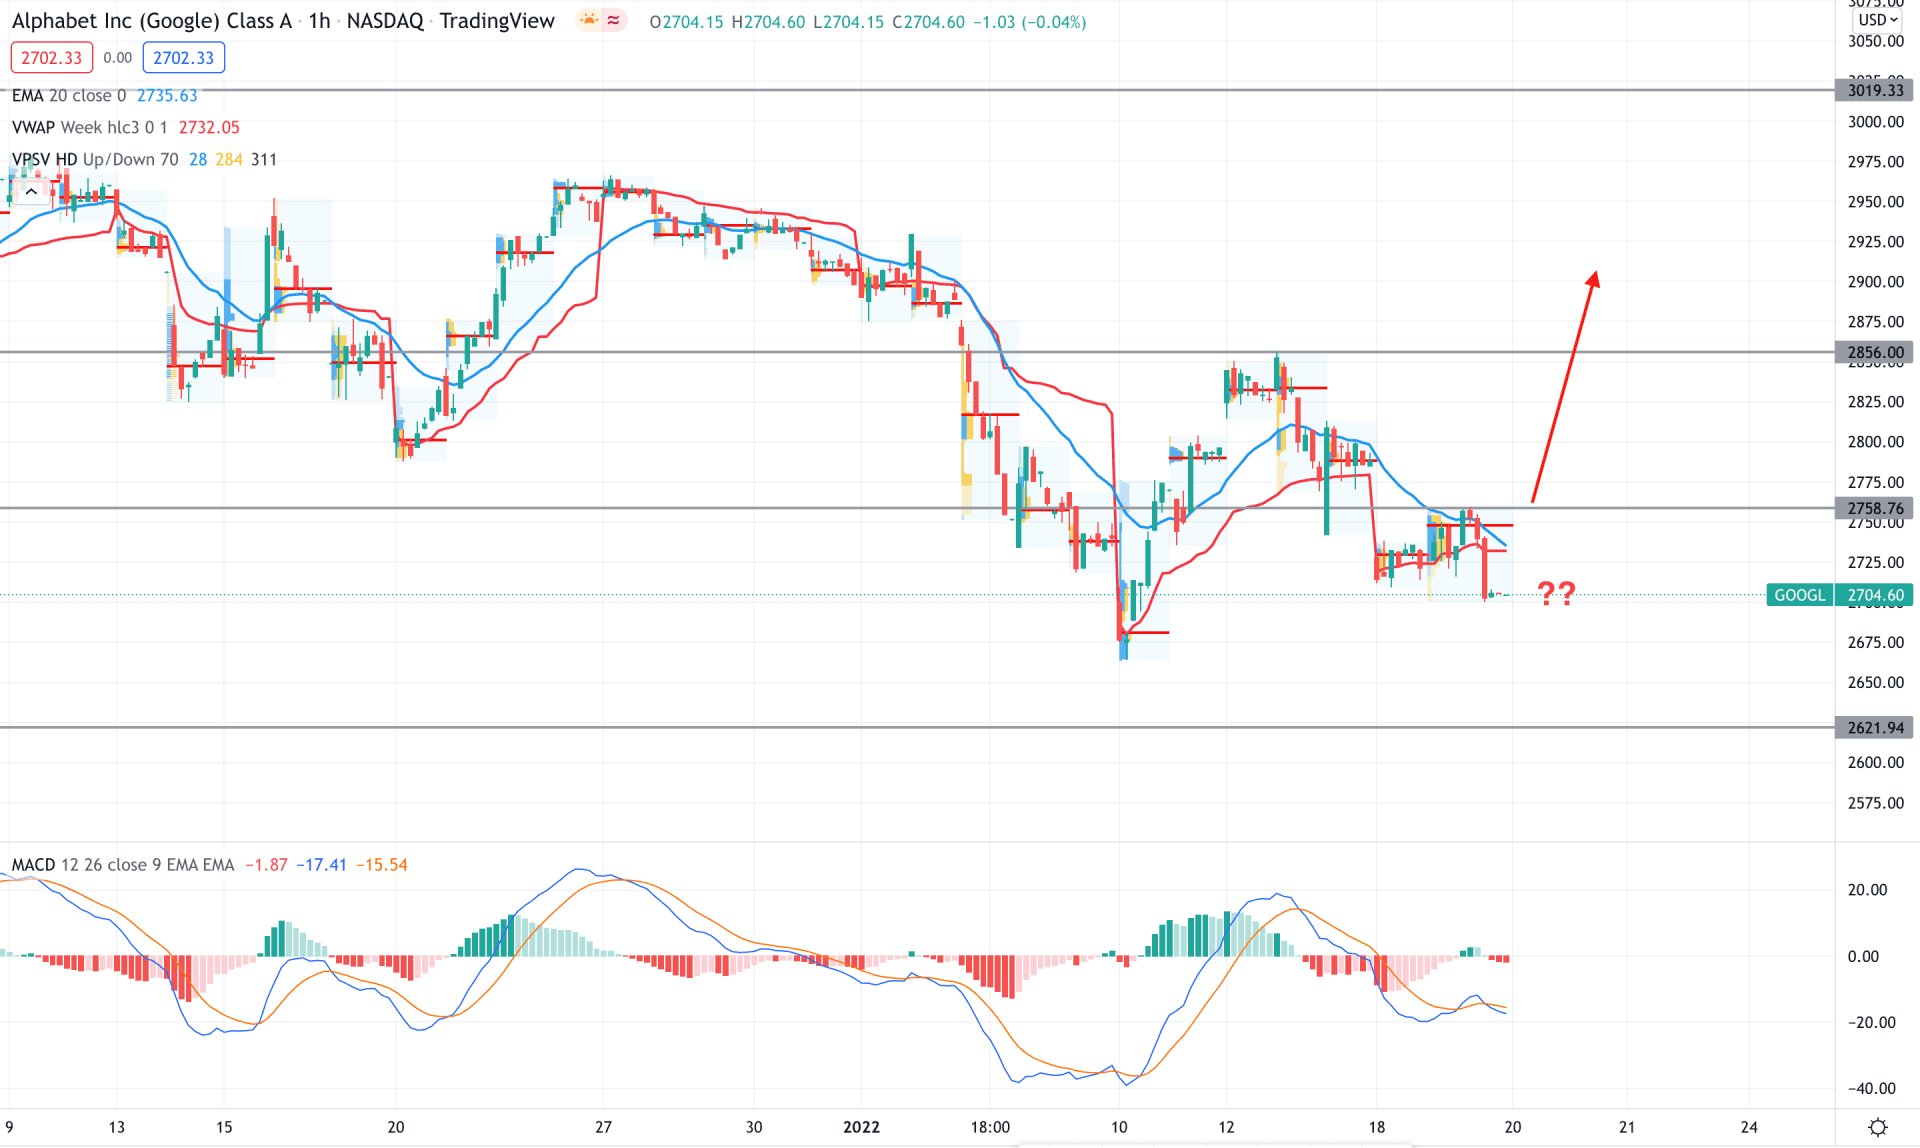
In the intraday chart, Google stock showed a selling pressure as the most recent price moved below the intraday high volume level of 2747.22 level with an impulsive pressure. Moreover, the current price is trading below dynamic 20 EMA and weekly VWAP, which is another sign of the possible selling pressure in the price.
The above image shows how the price faces dynamic resistance from the weekly VWAP while the MACD Histogram turns bearish. Therefore, based on the current price structure, bears may show another attempt to lower the price towards the 2621.94 level. On the other hand, a bullish price action with an H1 close above the 2758.76 would open buying opportunity in this instrument towards the target of 3019.00 area.
As per the current market context, Google stock tends up where buying opportunity in the lower time frame is not seen yet. Therefore, investors should wait for a bullish breakout above the near-term static resistance level in the H4 chart to find the perfect buying opportunity.


