
Published: January 13th, 2026
After results from JPMorgan Chase (JPM.N) along with other companies are due on Tuesday, Goldman will publish its earnings report on January 15. This paves the way for a week when trading offices and deal fees become important once more, and when guidance on pricing and rate expectations is subject to sudden fluctuations.
The direct customer exposure of Goldman is always changing. The bank said last week that it had achieved a deal to transfer the Apple Card system and associated accounts to JPMorgan's Chase.
According to Goldman, the move is anticipated to take roughly 24 months and increase fourth-quarter 2025 profits by $0.46 per share.
In contrast to last year's impressive results, Goldman Sachs is likewise anticipated to announce reduced Q4 2025 profits, which makes it the only significant U.S. bank with reduced earnings amid a favorable sector forecast.
Goldman Sachs reported $15.18 billion in net revenue for the third quarter, a 20% increase over the same period last year. At $3.82 billion, net interest income increased by 64% from the previous year. In the meantime, net earnings reached $4.1 billion, up 37%.
Let's see the future market outlook from the GS price analysis:
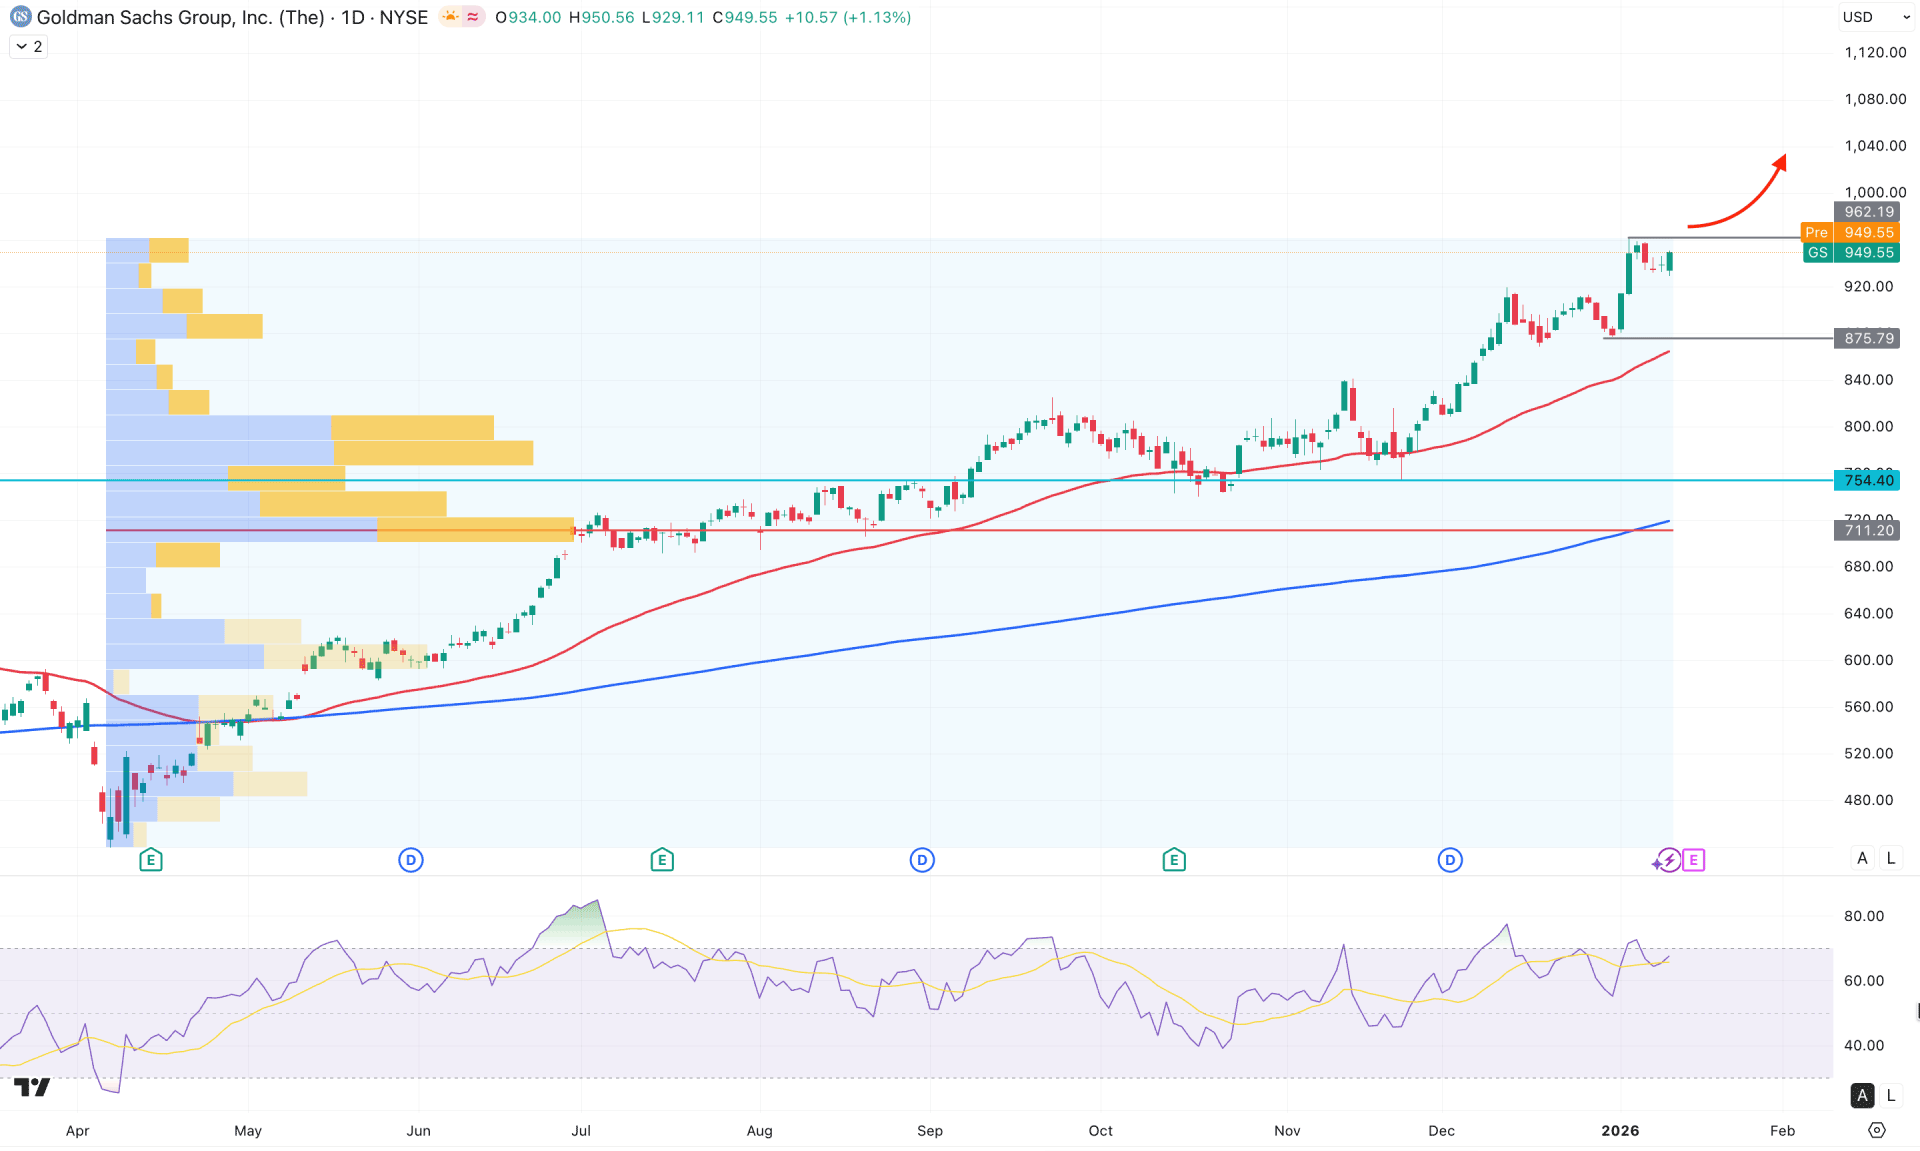
On the daily chart of Goldman Sachs (GS), the primary market momentum is bullish, indicated by a series of higher highs since the April 2025 crash. Therefore, the main plan for this stock is to look for long entries, even as the price trades in a premium zone.
On the higher timeframe, three consecutive bullish monthly candles are visible following the inside bar breakout in November 2025. As long as the price holds above the December 2025 high, we may anticipate a bullish continuation. The weekly chart further shows a strong bullish trend with no significant exhaustion visible at current highs.
Regarding volume profile, the largest activity area since April 2025 is at the 711.20 level, approximately 25% below the current price. Although the price trades above this high-volume area, the substantial gap suggests a possibility of a near-term correction, even within the broader bullish context.
On the main price chart, the 200-day SMA has performed a bullish crossover above its signal line and maintains a positive slope. Even though the 200-day SMA remains below the 754.40 resistance, its strength suggests any pullback could be a buying opportunity.
On the other hand, the 50-day EMA is acting as support near the 875.75 level, providing a bullish confluence signal.
The Relative Strength Index (RSI) is in a volatile position above the 70.00 overbought zone, forming a potential bearish divergence. A price decline coinciding with this divergence could present a potential long opportunity upon stabilization, even within the bullish momentum.
Based on the broader market structure, investors should closely monitor the upcoming earnings report. An immediate breakout and daily close above the 950.67 level would extend buying pressure toward the 1000.00 psychological level. However, a potential downside correction may find support in the 875.70 area, which could offer another bullish setup depending on price action.
On the other hand, a sustained selling pressure below the 50-day EMA could increase the likelihood of a test of the 711.20 key support level before another long opportunity emerges.
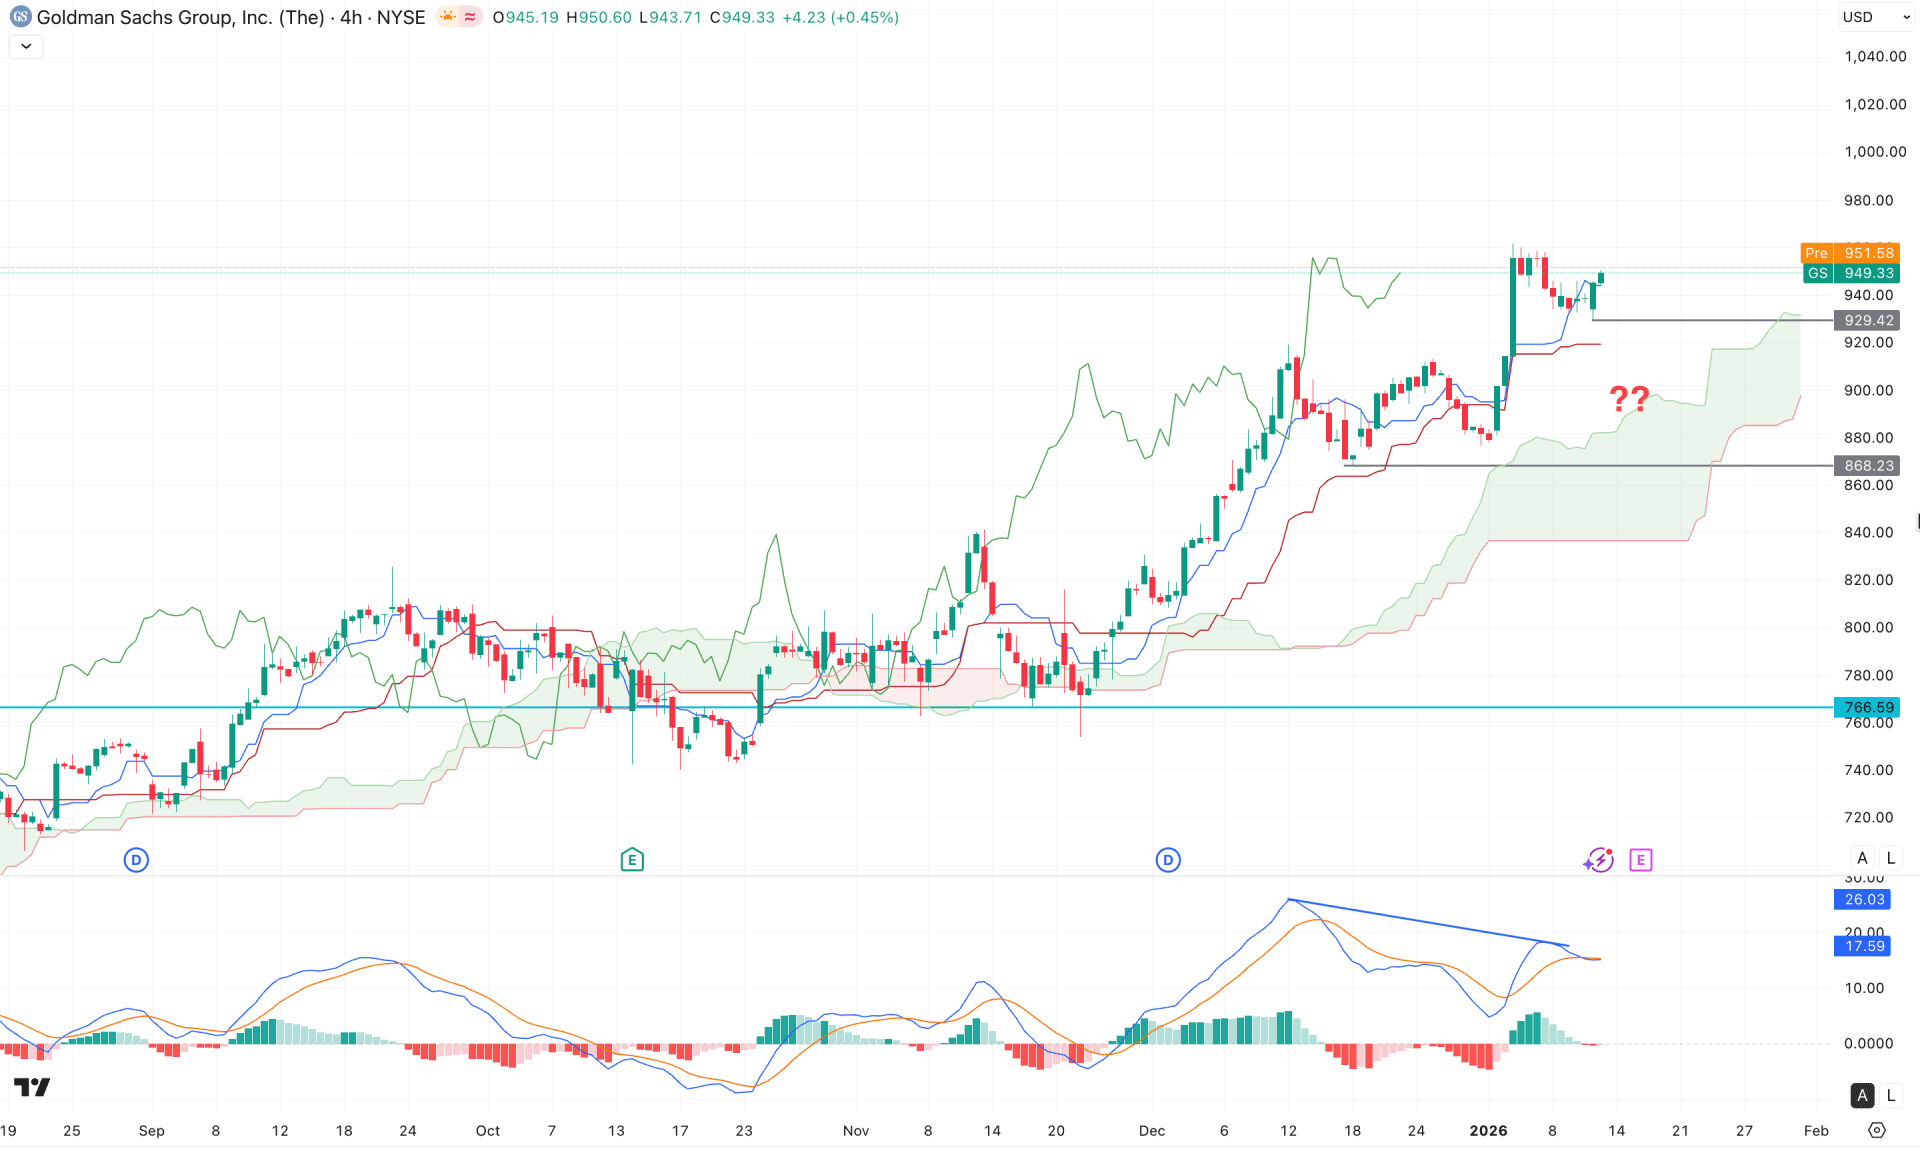
In the H4 timeframe, the ongoing market momentum is bullish as the price keeps moving higher above the dynamic Cloud area. Moreover, the Senkou Span A and Senkou Span Bare heading upwards, suggesting a bullish continuation.
In the secondary indicator window, the MACD Signal line shows a potential divergence with the main price chart. However, the MACD Histogram failed to sustain the positive momentum and reached the neutral point.
Based on the H4 outlook, the ongoing bullish momentum is valid, where the price is likely to make a new swing high above the 961.00 level. However, an immediate dip is possible below the 920.00 level from where a valid bullish reversal could come.
On the other hand, a strong selling pressure could come after a bullish pressure above the current swing high with an immediate downside recovery below the Kijun Sen level.
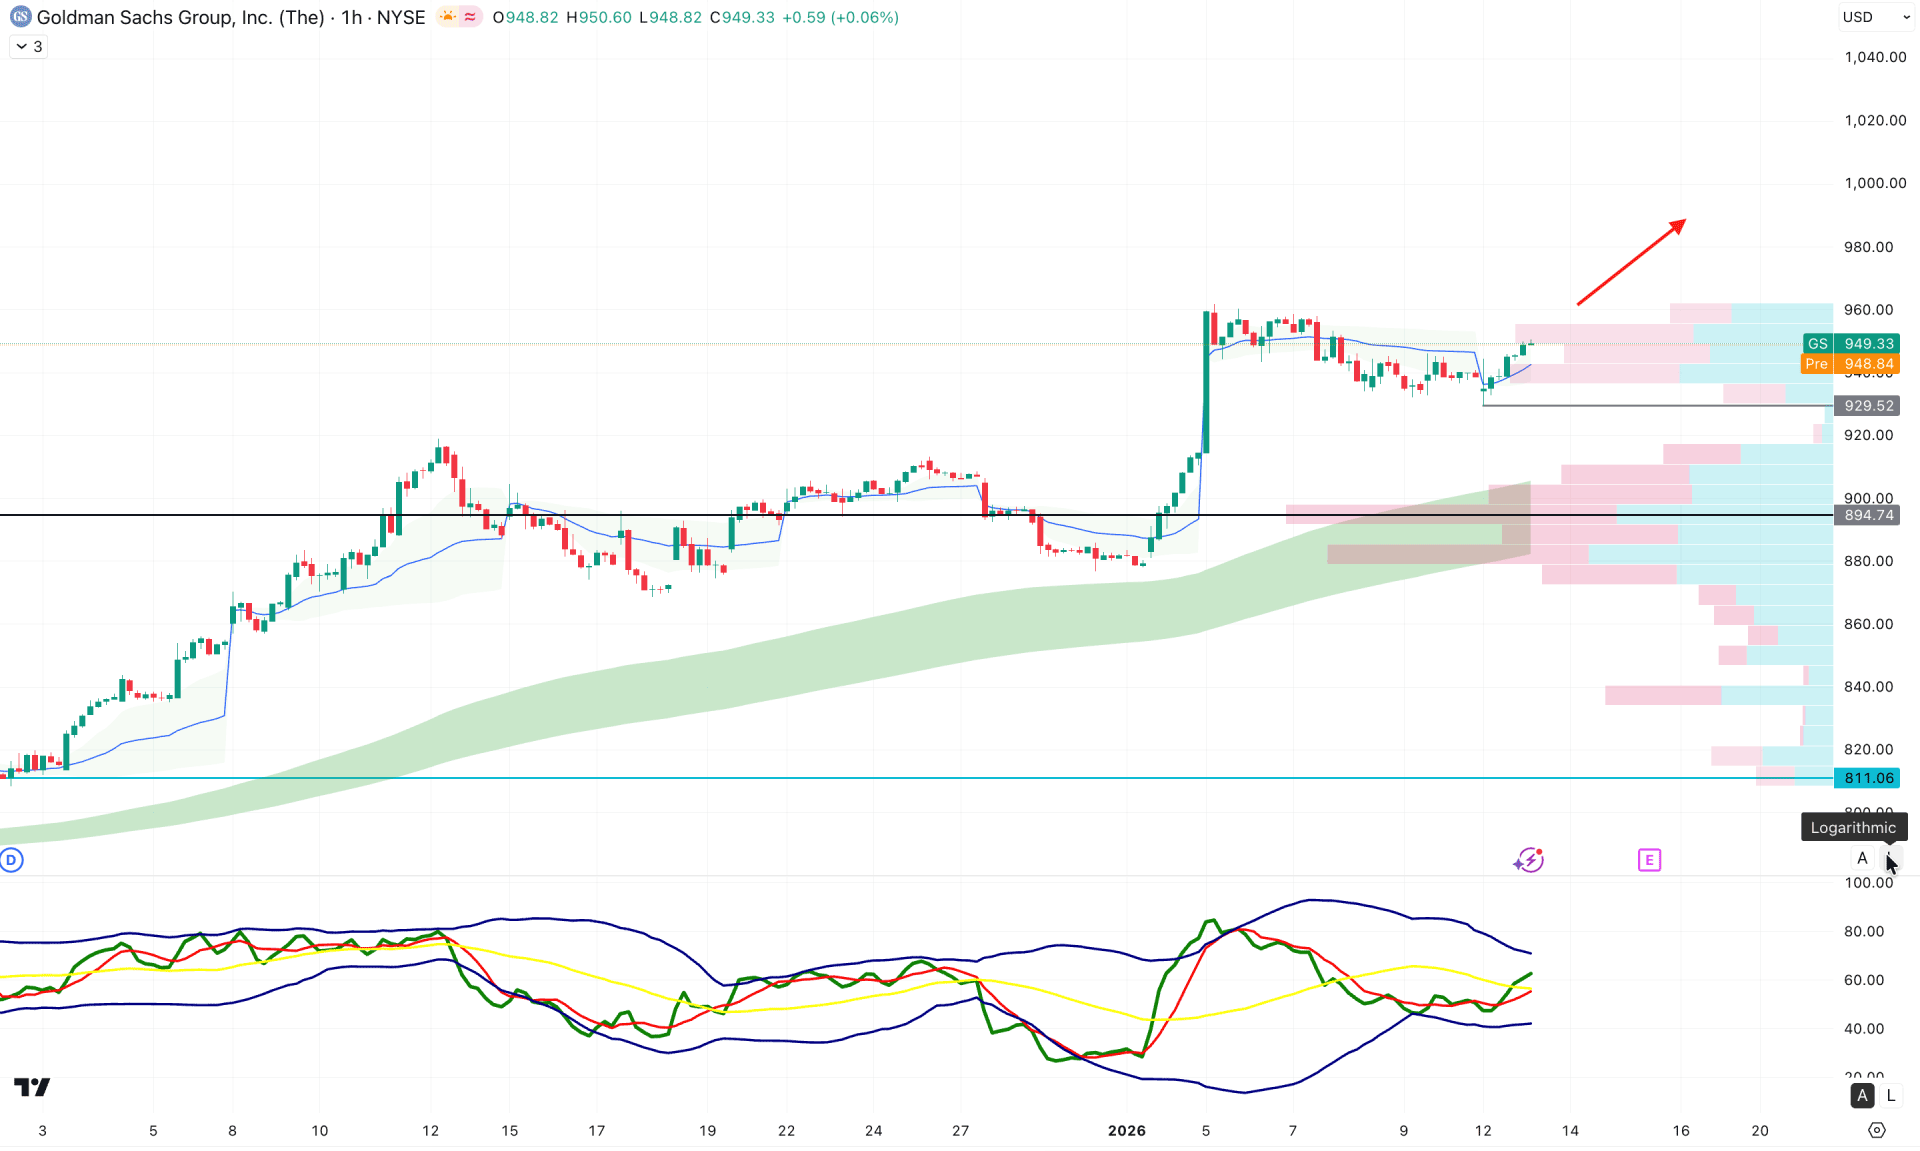
On the hourly timeframe, the price is currently positioned within a bullish rally-base-rally formation. The most recent price action shows a bullish impulse following a breakout from a descending channel. Furthermore, the high-volume node is situated below the entire structure, where it acts as crucial support.
The Exponential Moving Average wave is also exhibiting a bullish alignment, following the weekly VWAP level.
In the secondary indicator window, the Traders Dynamic Index maintains a bullish slope above the 50.00 neutral line, indicating sustained buying pressure.
Based on this structure, the ideal approach is to look for long entries, provided the price remains above the visible VWAP level.
However, investors should remain cautious of intraday volatility. Taking additional long entries at premium price levels requires careful discretion and added attention.
An immediate sell-off with a sustained close below the 920.00 level could encourage the price to test 894.74, which would be a critical barrier for the bulls. Stable price action below the 900.00 level could increase the possibility of a move toward the 840.00 area.
Based on the overall market structure, Goldman Sachs (GS) is trading in a stable uptrend with no clear signs of a major downturn from the record highs. As long as the broader price structure remains bullish, investors should anticipate long opportunities until clear exhaustion appears at the top.


