Published: January 8th, 2025
Despite the lack of follow-up or bullish confidence, the gold rate (XAUUSD) attracted some dip-buying. Bulls in the nation's dollar (USD) became cautious and held off on making further wagers until the FOMC meeting moments were released. In addition, concerns about a trade war, geopolitical tensions, the unpredictability around American President-elect Donald Trump's tariff proposals, and a more relaxed risk stance are significant drivers of the safe-haven bullion.
In the meantime, US yields on Treasury bonds are still rising due to the Fed's (Fed) hawkish warning that it could slow down rate decreases in 2025. Consequently, this should serve as an upward breeze for the USD and prevent traders from making excessive, optimistic wagers on the non-yielding price of gold.
Strong US statistics confirmed market predictions that the Federal Reserve will delay the speed of its rate-cutting cycle this year, which caused the US dollar and the yields on US Treasury bonds to spike on Tuesday.
According to the Institute for Supply Management, the Prices Paid segment reached a nearly two-year record high during December, while the non-manufacturing Purchasing Managers' Index (PMI) increased to 54.1.
According to the Job Opportunities and Labor Turnover Survey data, or JOLTS, job opportunities unexpectedly jumped from 7.839 million to 8.098 million by the end of November.
However, the FOMC meeting results continue to be the major focus, as they will significantly impact the structure of the USD price and provide the gold price with a new boost later in the US period.
Let's see the future price action of Gold from the XAUUSD technical analysis:

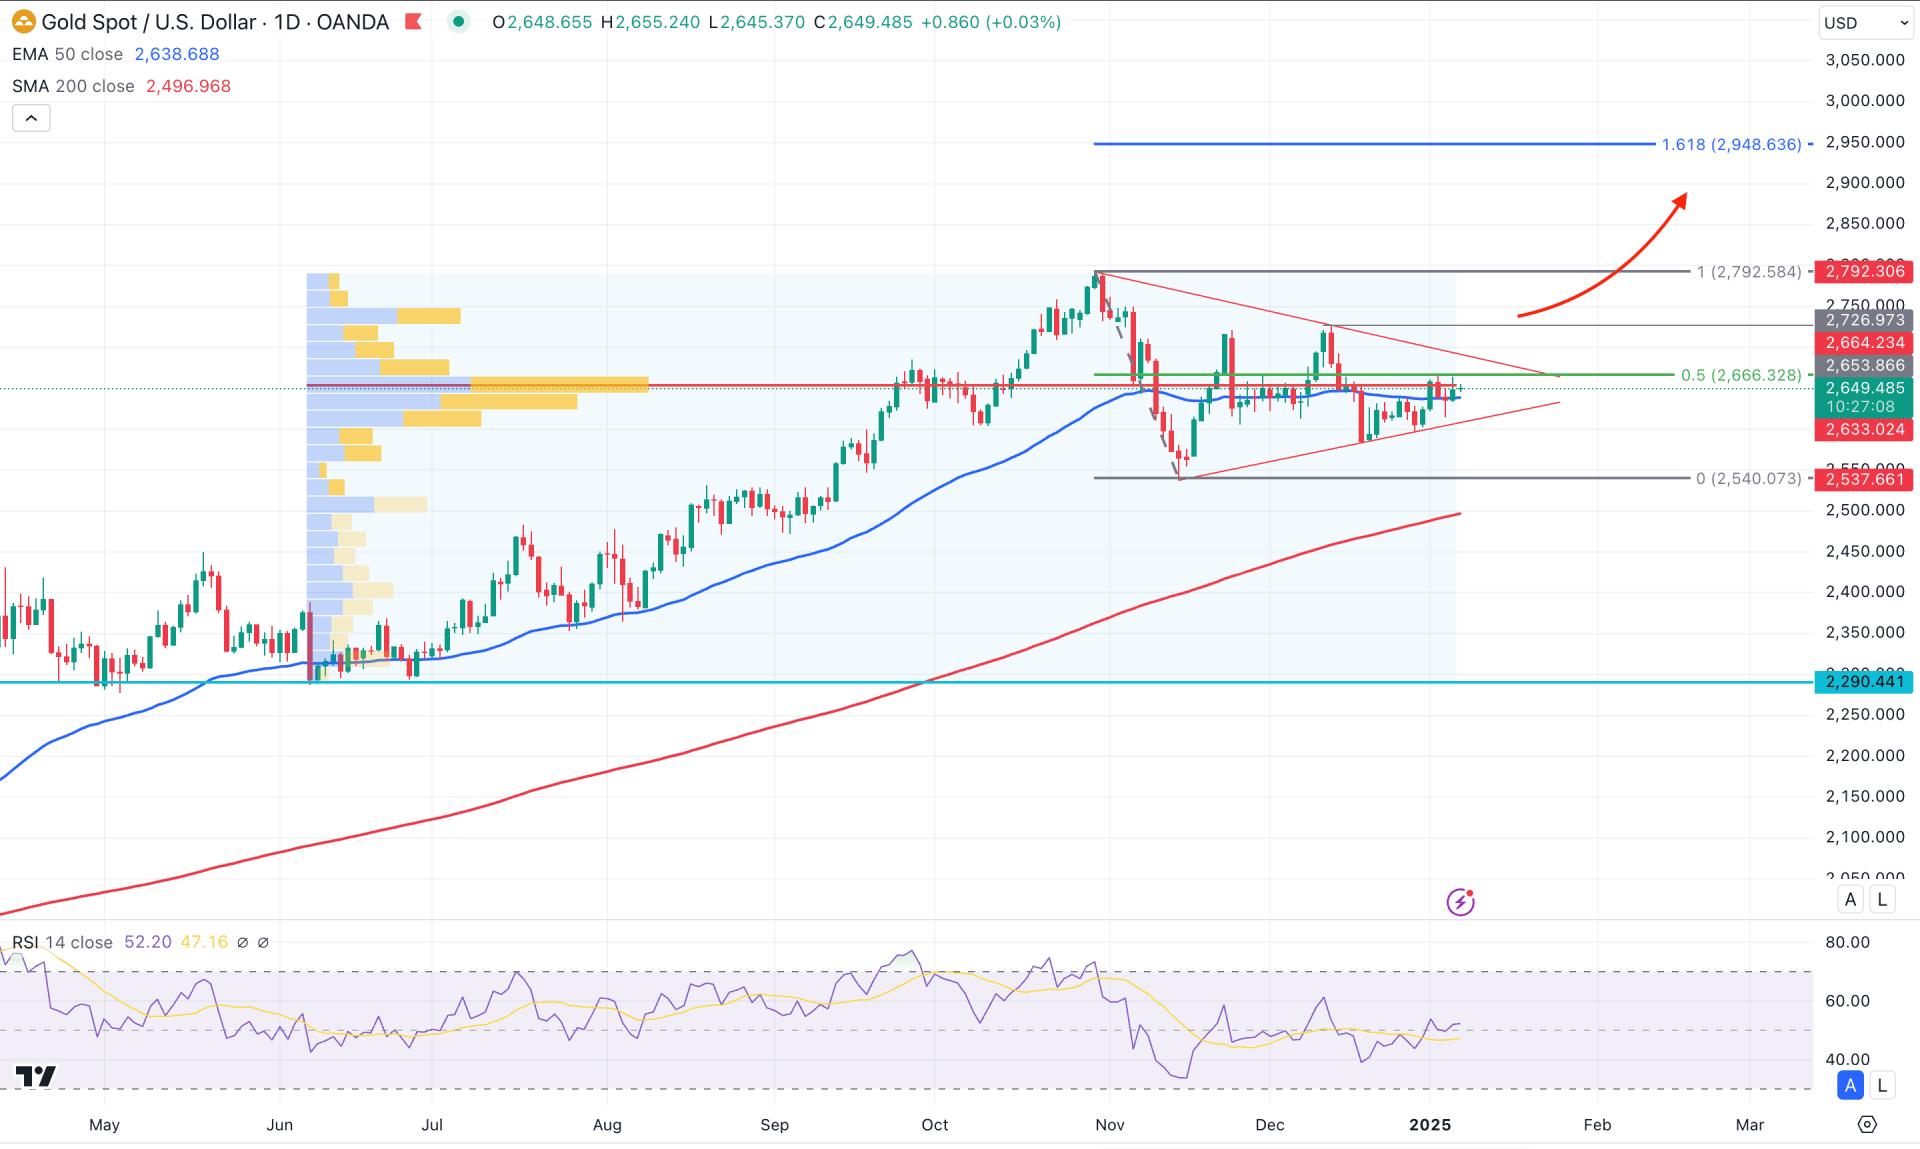
In the daily chart of XAUUSD, the overall market momentum is bullish as the price showed a bullish continuation from left to right. Also, the price is trading at a record-high level with no sign of a sufficient bearish correction in the last three years.
In the broader context, the price remained sideways after the October 2024 high, from where a bearish 2-bar reversal has come. However, the price still trades above the near-term crucial low, from where a proper break is needed before validating the top.
In the volume structure, the highest activity in the last six months was recorded at the 2653.86 level, which is closer to the current price. Because the current price is trading at a high activity level, investors might expect a stable trend after a valid breakout.
The main price chart shows the sideways momentum from the ongoing symmetrical triangle formation, backed by a stable bullish trend. Primarily, this pair aim to anticipate a bullish continuation after having a solid triangle breakout.
On the other hand, the 200-day Simple Moving Average is working as a major support line, which could be a strong barrier for a downside possibility. As long as the current price hovers above this line, the price will likely extend and form a new all-time high.
However, the near-term price action shows a different story where the 50-day Exponential Moving Average is in line with the current price with a sideways momentum. Moreover, the 14-day Relative Strength Index (RSI) rebounded from the oversold zone and reached the neutral 50.00 area.
Based on the daily outlook of XAUUSD, the price is more likely to extend the ongoing bullish pressure as there is no sign of exhaustion at the top. In that case, the classic approach is to wait for a bullish trendline breakout with a valid retest before aiming for the 2948.63 Fibonacci Extension level.
On the other hand, the long, bullish wave has more room to form a bearish correction. In that case, a selling pressure below the 200-day SMA line could validate the short opportunity, aiming for the 2540.07 support line.

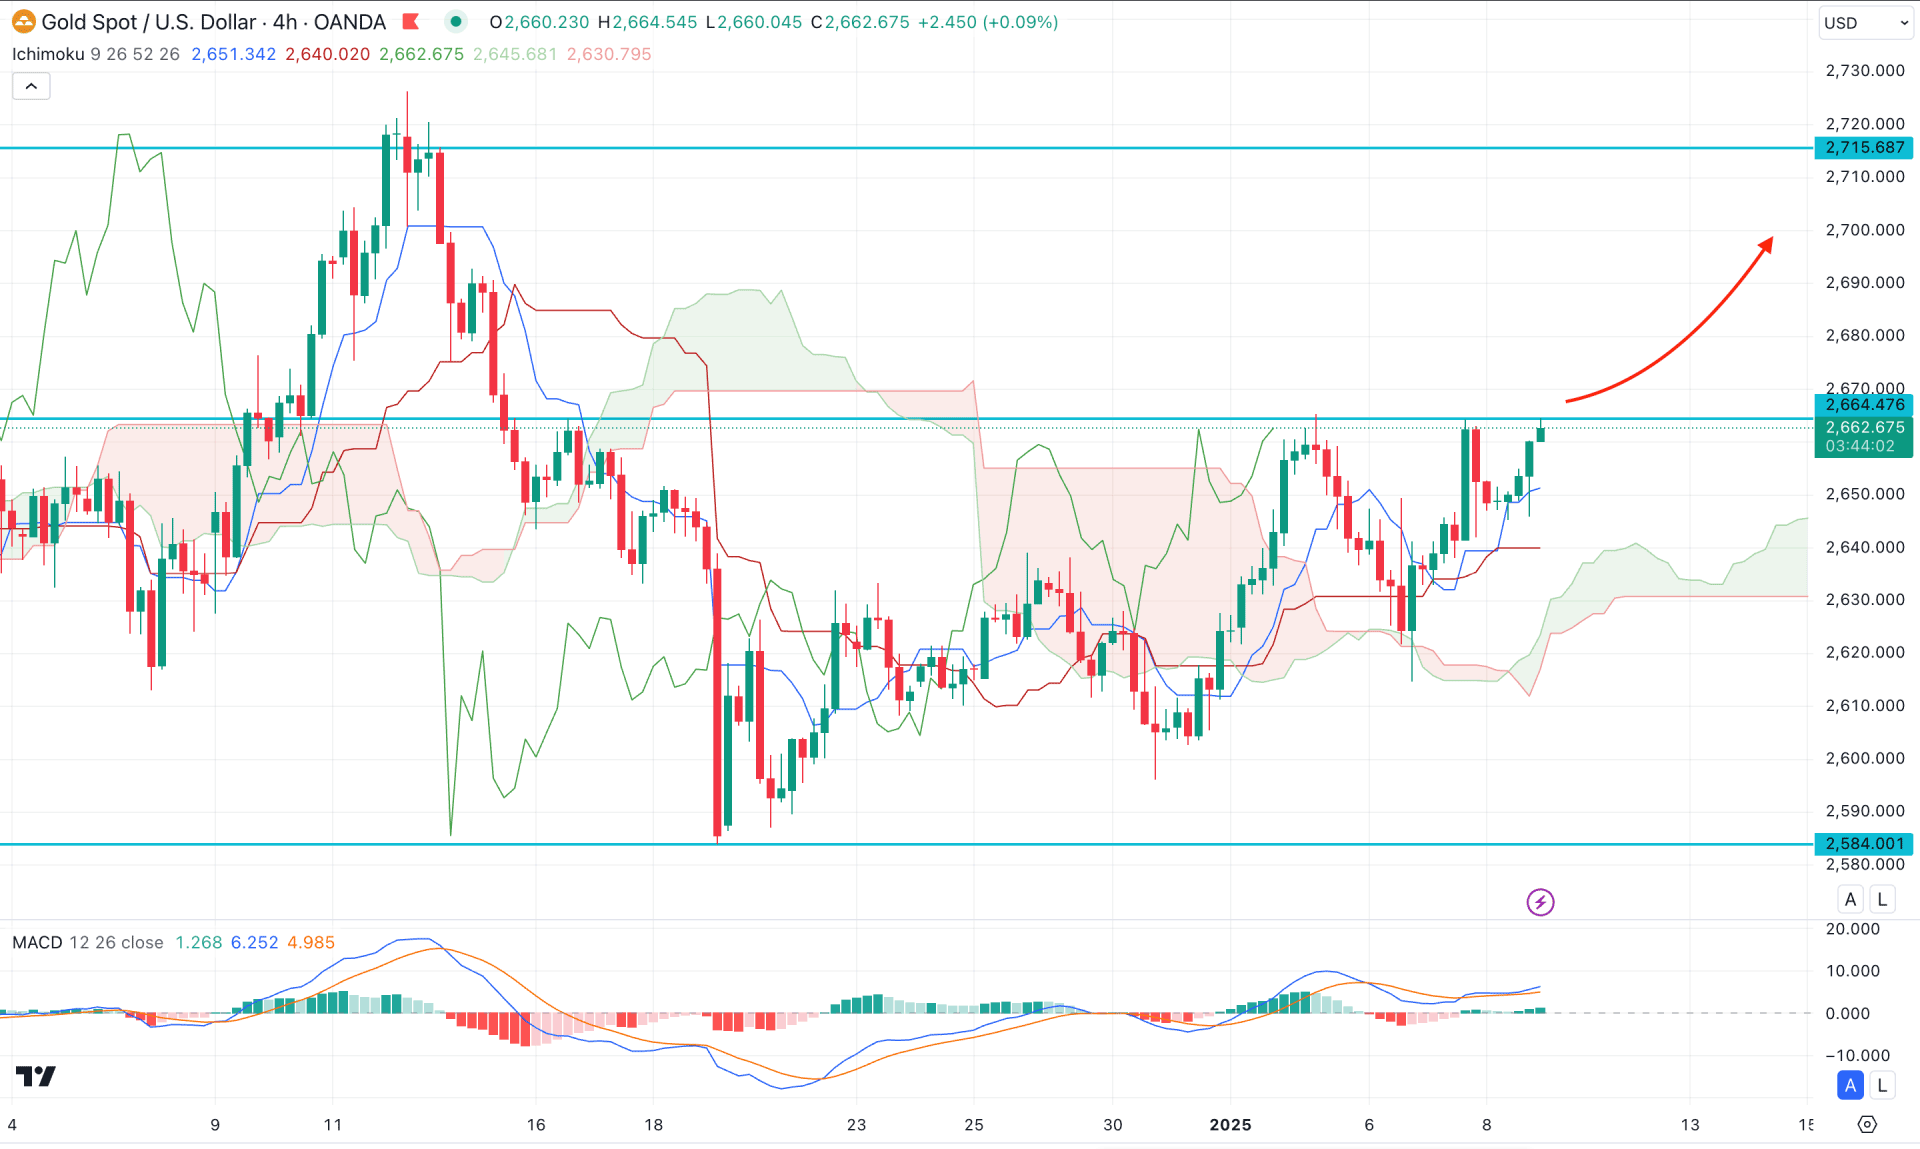
In the h4 chart of XAUUSD, the ongoing market momentum is bullish, where a strong bullish recovery is possible from the valid Cup & Handle pattern breakout.
In the Ichimoku Cloud indicator, the thickness of the Future Cloud is positive to bulls as both lines aim higher. Moreover, the dynamic Tenkan Sen and Kijun Sen are below the current price, working as a major support.
The indicator window shows the same structure, where the MACD Histogram maintained the positive Histogram even if there is a selling pressure. Moreover, the Signal line showed a bullish crossover above the neutral zone, which signals additional bullish pressure in the market.
Based on this outlook, a valid bullish H4 candle above the 2664.47 triple top line could be a remarkable achievement, extending the upward pressure above the 1745.56 resistance line.
The alternative approach is to wait for a bearish reversal below the dynamic Kijun Sen level, which could offer another long opportunity from the 2630.00 to 2600.00 zone.

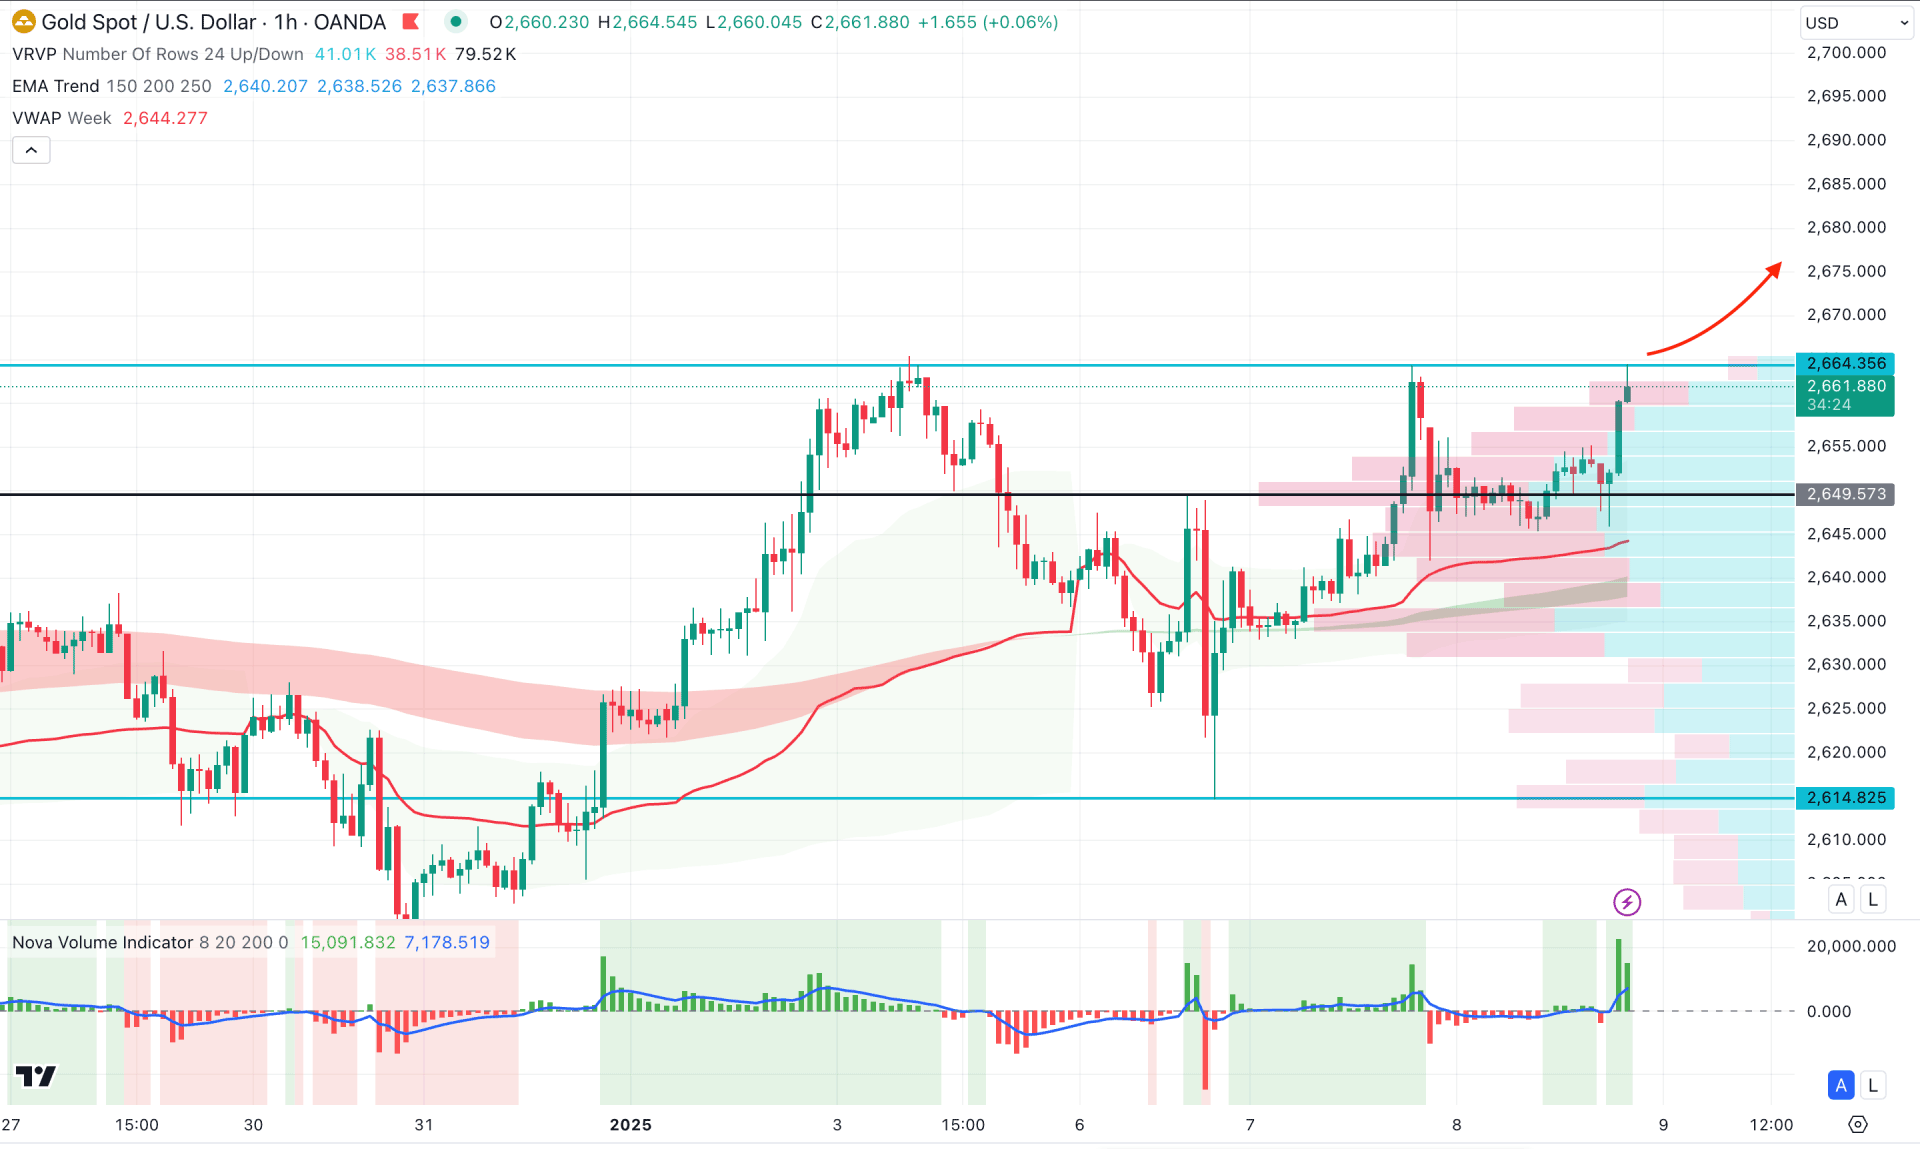
In the hourly time frame, the recent price shows an intraday bullish pressure after the ADP report. However, the bullish momentum is still struggling to overcome the crucial resistance of the 2644.34 static line.
In the volume structure, the Volume Histogram represents a higher activity after three calm sessions, which could be an involvement of institutions.
Overall, the moving average wave is below the current price, working as a major support, which is in line with the dynamic weekly VWAP level.
In that case, a bullish continuation is likely to appear, where the main aim is to test the 2680.00 line in the coming sessions.
On the other hand, a failure to hold the price above the near-term static resistance line could extend the downside correction, aiming for the MA wave area.
Based on the current market scenario, XAUUSD has a higher possibility of showing a bullish continuation in the coming days. Investors should closely monitor how the price breaks out from the current sideways momentum as a valid trendline breakout could be a trend trading opportunity.