
Published: May 11th, 2020
With the economy crisis gaining more and more traction, no wonder investors will be looking for assets to store the value. Proven by centuries, Gold still remains one of the safe-heavens and a great store of value. The US continues to print more money to stimulate the economy, which obviously will result in further devaluation of the USD. This should stimulate the price of Gold which should yet again produce another strong move to the upside. Let’s have a look at what is price potential in the medium and long term for the yellow metal.
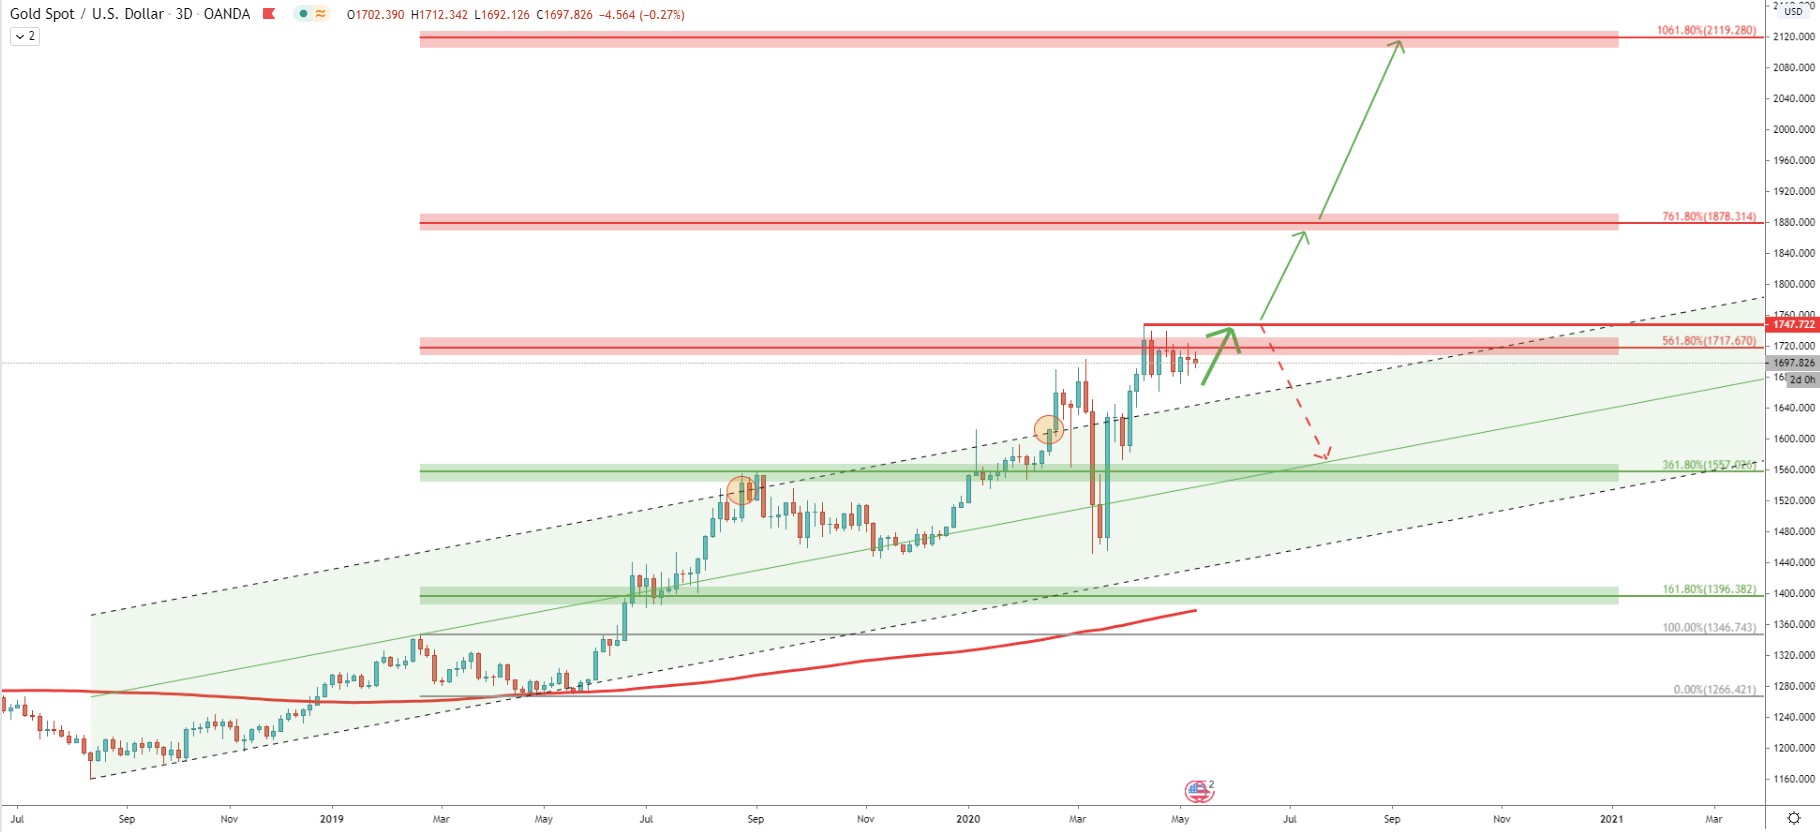
The long term perspective in general and 3-Day chart, in particular, shows a clear uptrend. Since August 2015 till now, the price has increased by over 46%, and actually, there are no signs that the trend is reversing down any time soon. When XAU/USD broke above the ascending channel for the first time, it rejected the 361.8% Fibonacci retracement level (applied to the corrective wave down after the 200 EMA breakout). But when for the second time Gold broke above the ascending channel, it also broke above the nearest resistance at 561.8% Fibs, which is $1717. It shows that the uptrend is still intact and could get accelerated at any time. After 561.8% Fibonacci breakout, the price has reached the $1747 high and corrected down slightly.
We can see that currently there is not enough selling power to push the price down. Gold continues to range between $1747 resistance and $1660 support. Keeping in mind the validity of the uptrend, XAU/USD can be expected to re-test previously high at $1747 in the very near future. But, if there will be a break above, the price can go ballistic. In this case, it might reach either $1878 or even $2120 Fibonacci resistance levels, which are 761.8% and 1061.8%. In the next chart, we will go deeper as to why we pay attention to these particular Fibonacci levels.
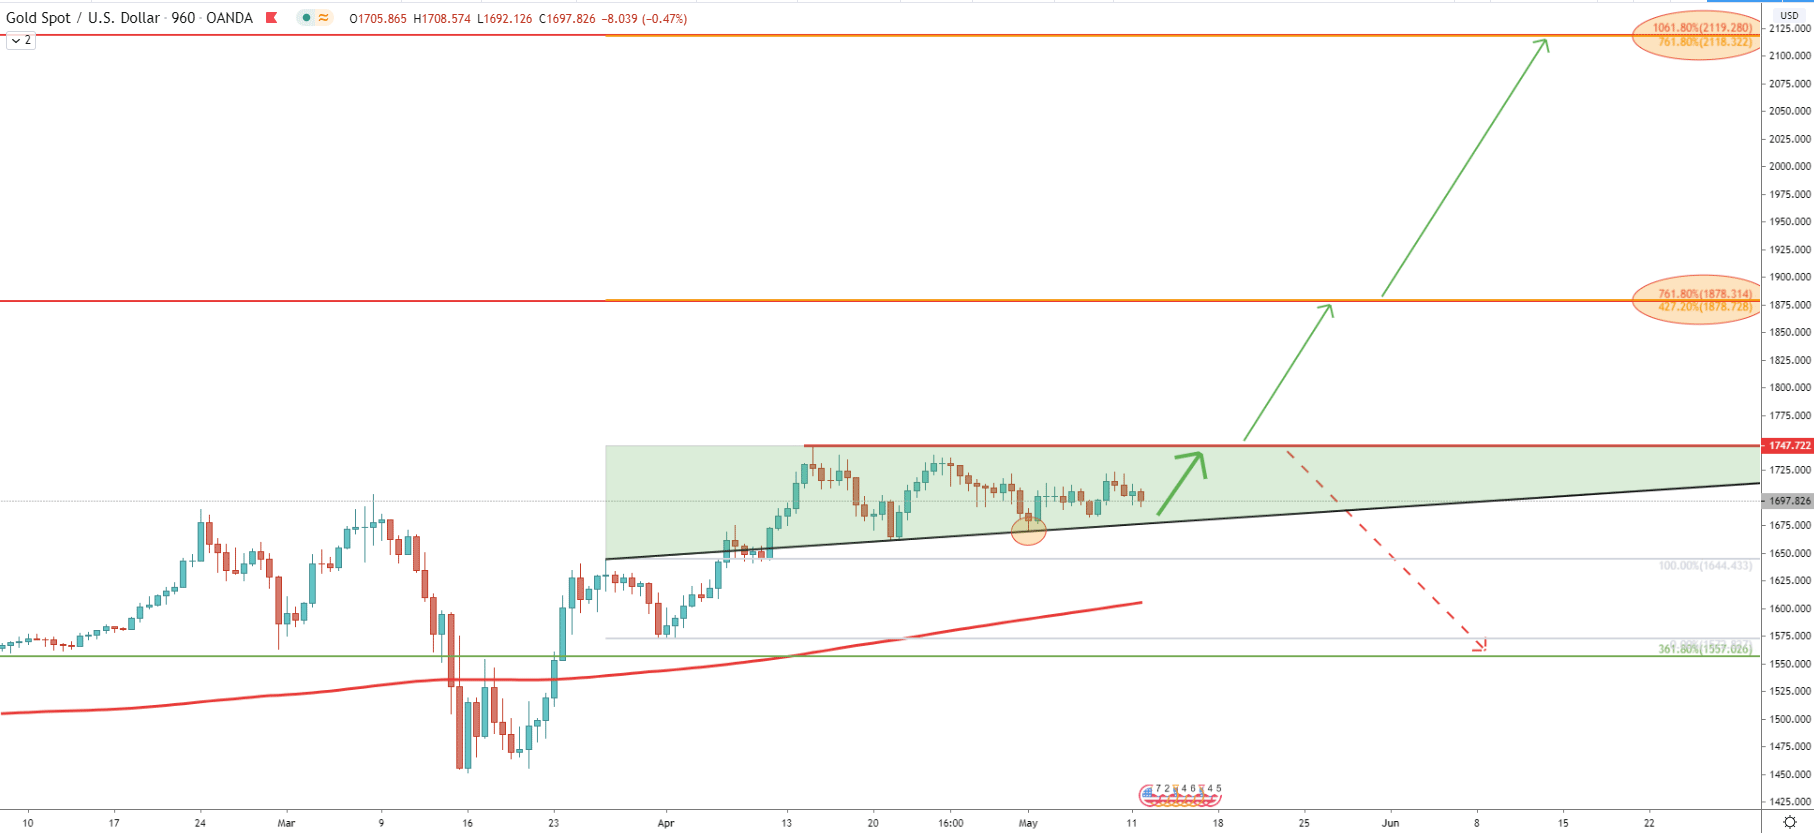
On the 16H chart, we have applied the Fibonacci retracement indicator to the corrective wave down after the breakout of the 200 EMA. It shows, that 761.8% and 1061.8% Fibs from the 3-Day chart, very cleanly correspond to the 427.2% and 761.8% Fibs. It makes these levels extremely important in the long run and must be monitored very closely. At the same time, XAU/USD formed a bullish triangle pattern, where the uptrend trendline has been rejected recently. The very clean bounce off the trendline goes to show that bulls are in control and right now just taking a break after the rally.
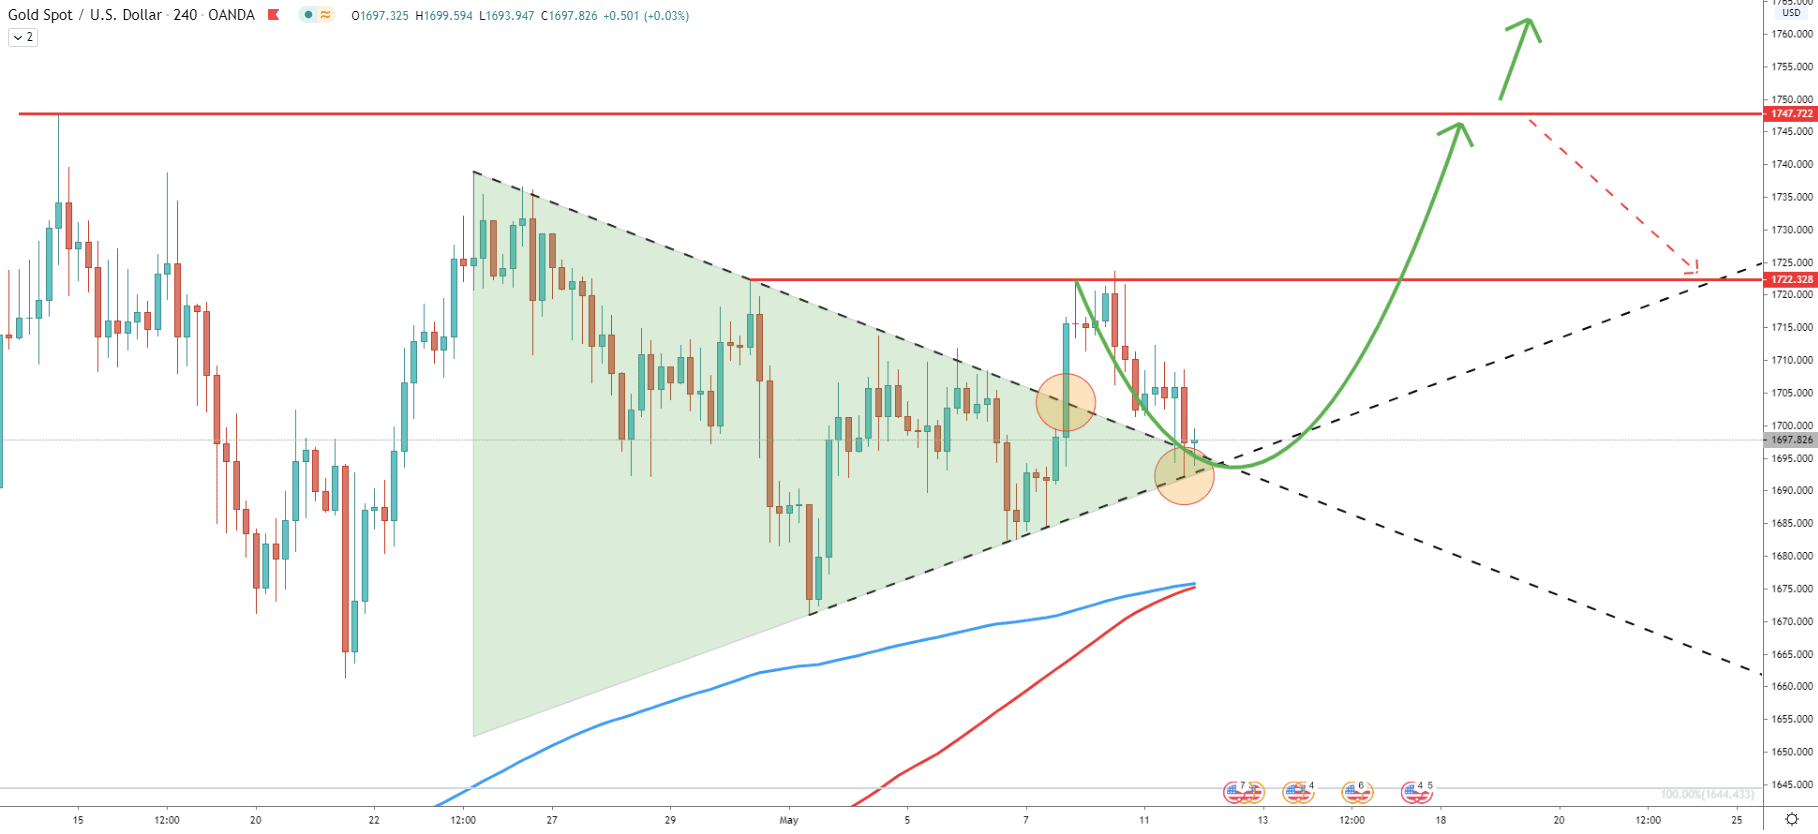
Here we can witness the break above the downtrend trendline where price has reached $1722 resistance area. After the rejection Gold corrected down, which was very expected, considering the ongoing range trading. On the correction, the price has reached the $1692 low, where it rejected cleanly the uptrend trendline. In the short term, Gold continues to consolidate, which means that it still might test the 200 EMA or SMA this weeks. Nevertheless, the long term trend remains extremely bullish and it seems that it is just a matter of time before Gold breaks above the $1722 level and will test $1747 resistance.
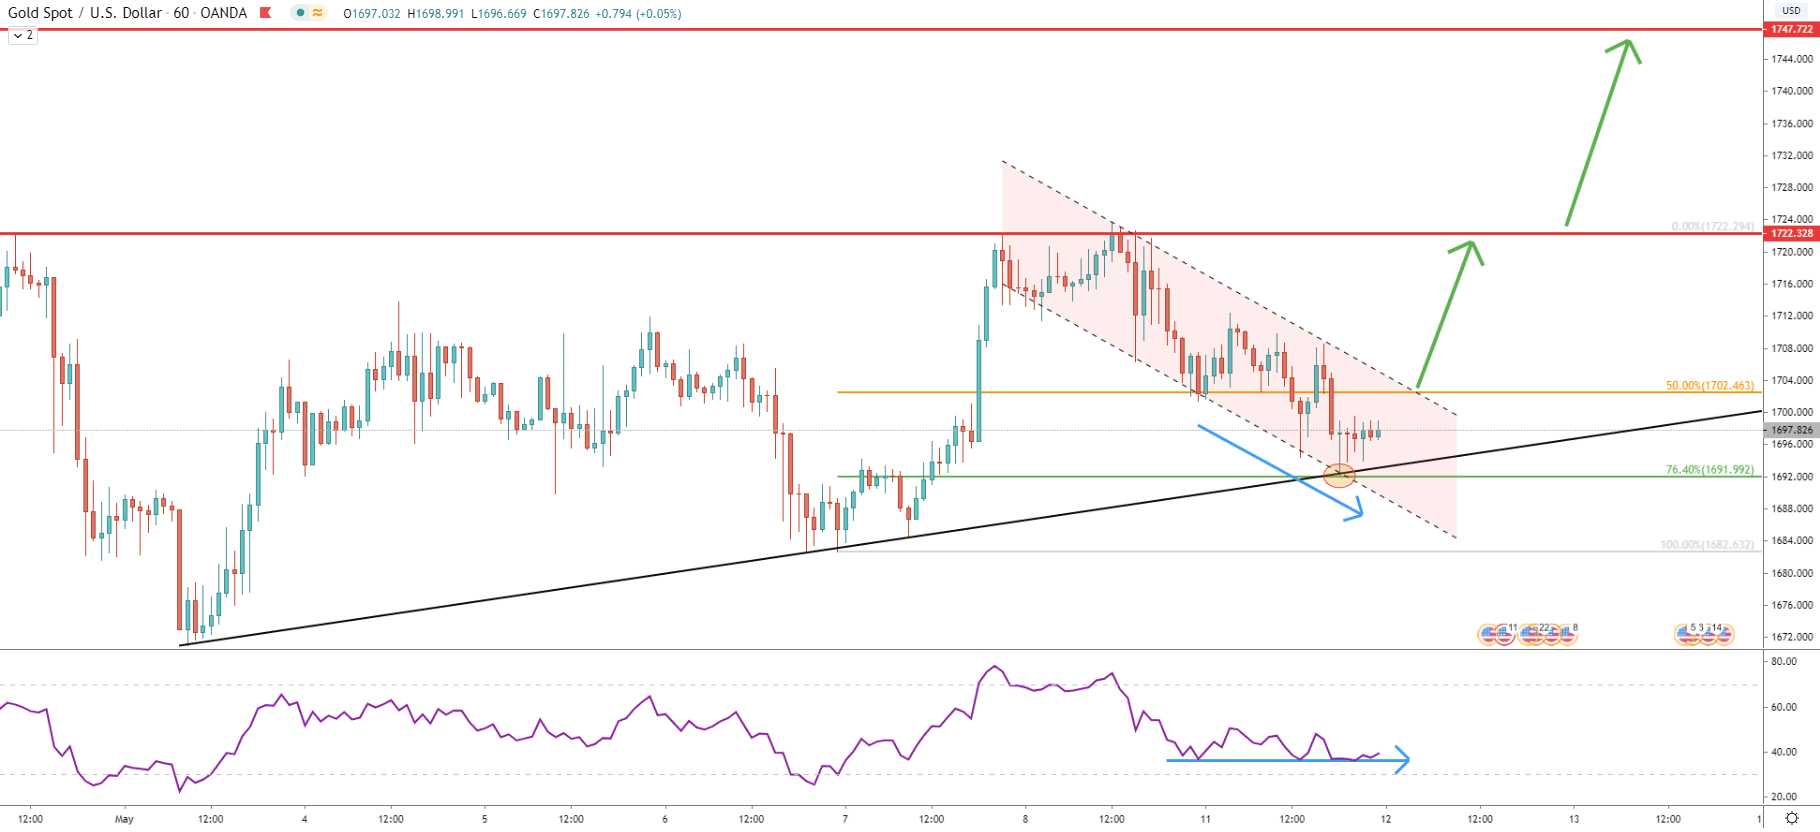
The 1H chart shows the price decline within the descending channel during the past 48 hours. While the price was moving lower, the RSI oscillator was moving sideways, thus forming a bullish divergence. Another point to consider is that today XAU/USD has rejected the 76.4% Fibs at $1692 along with the uptrend trendline. Most likely $1690, will be the final price area where bulls and bears will decide the medium and long term faith of the Gold. Because if XAU will close below the $1692 on the Daily timeframe, bears are likely to take control over the trend or at least prolong the consolidation phase. This is why it might be best to wait for the break above the descending channel in order to take any action in relation to buying XAU/USD.
The gold consolidation phase is coming to an end, where the price is about to make the next move. Technically and fundamentally Gold price is highly probable to increase further, potentially breaking the $2000 psychological price barrier.
As per the 16H chart, there are 3 main upside targets. The first one and the key resistance is based at $1747, which is the previous high established on April 14. If this level gets penetrated, buyers should step in with extreme power, sending price either to $1878 or even $2120, which is the final upside target.
There are no definitive signs of an incoming trend reversal in the long term. Although stronger downside correction can be expected. If the uptrend trendline will be broken, XAU/USD could aim either for 200 EMA near $1670 or drop down to 361.8% Fibs at $1557
Support: 1682, 1692, 1570
Resistance: 1747, 1878, 2120


