
Published: February 1st, 2023
General Motors (GM) reported impressive results in the fourth quarter, surpassing its performance from the previous year. The automaker recorded adjusted earnings per share (EPS) of $1.35 and revenue of $33.58 billion for the final quarter.
For the entire year of 2022, GM's revenue reached $156.7 billion, with a net income attributed to stockholders of $9.9 billion and a record high of $14.5 billion in adjusted earnings before interest and taxes (EBIT). These results met the upper limit of the company's revised projections.
Looking ahead to 2023, GM anticipates a net income attributed to stockholders ranging from $8.7 billion to $10.1 billion. The company also expects adjusted EBIT of $10.5 billion to $12.5 billion and an adjusted EPS between $6 and $7. While these results may be lower than the previous year, they surpass the average analyst predictions for an EPS of $5.73 this year, according to Refinitv.
Should you invest in General Motors stock (GM)? Let's see the complete price projection from the GM stock technical analysis:
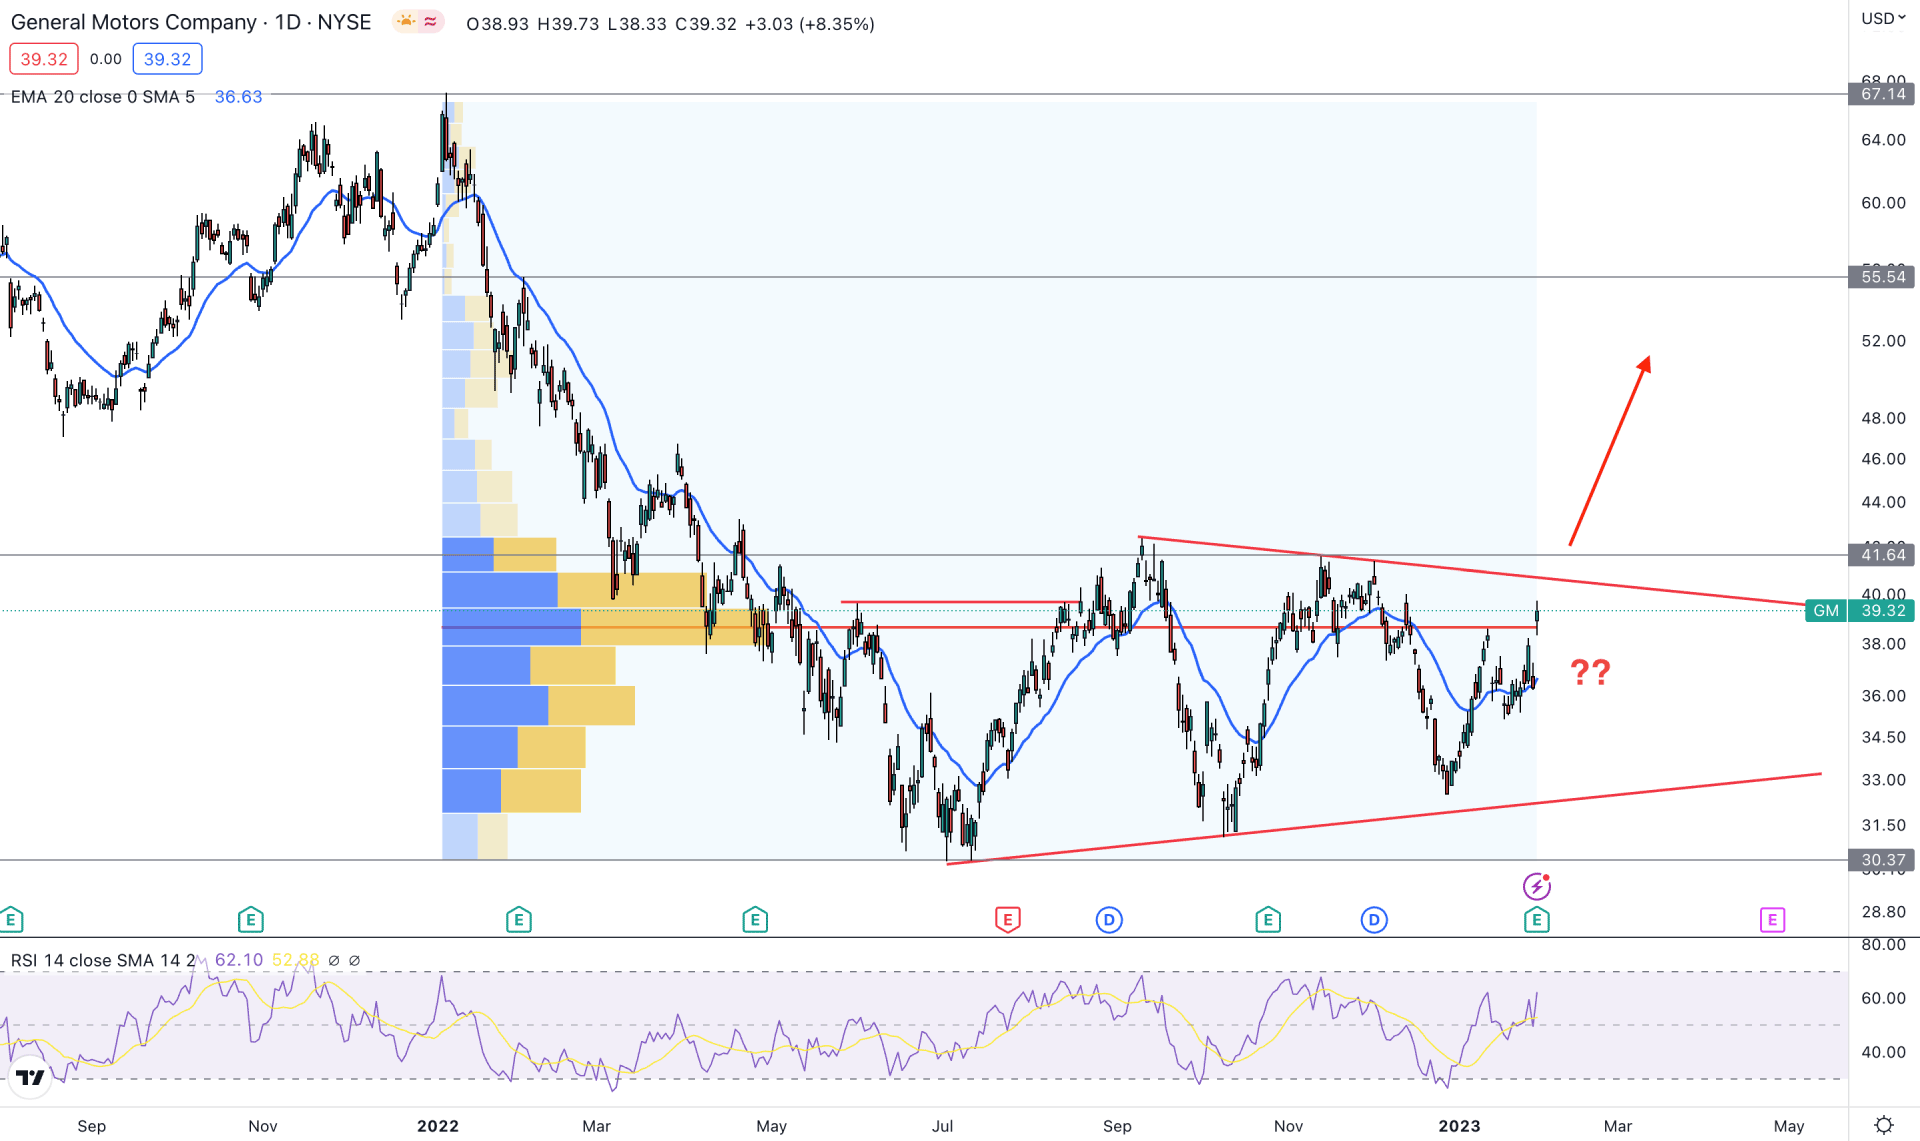
In the daily price, GM stock is trading within a consolidation, which is backed by strong selling pressure from the 67.14 key resistance level. The price dropped sharply with a 54% discount but went corrective after hitting the 30.37 low.
The buying pressure from the 30.37 low was impressive, resulting in a new higher formation at the 42.45 level. In that case, we can consider the 30.37 level as a strong bottom, which will be the lower limit of the current tradable range. On the upside, the strong buy-side liquidity grab and a bearish pressure from the 67.14 level will be the top of this tradable area.
In that case, bulls have a higher possibility of winning the battle as the current price trades at a discounted zone, with more room to move higher.
In the main chart, the highest activity level from the beginning of 2022 is spotted at 38.65 level, which is below the current price. It is a sign that long-term bulls might have joined the market, and any bullish technical signal could come with institutional investors' support.
The dynamic 20-day Exponential Moving Average is below the current price and working as a support. Moreover, the current RSI is also supportive of bulls as it is holding a strong position above the 50% neutral zone.
Based on the daily outlook of GM stock, a bullish break with a daily close above the 41.64 resistance level could increase a buying possibility in this instrument, targeting the 55.54 resistance level.
On the other hand, any significant selling pressure from the 40.00 to 41.50 area with a daily close below the 38.50 level could lower the price towards the 30.37 level.
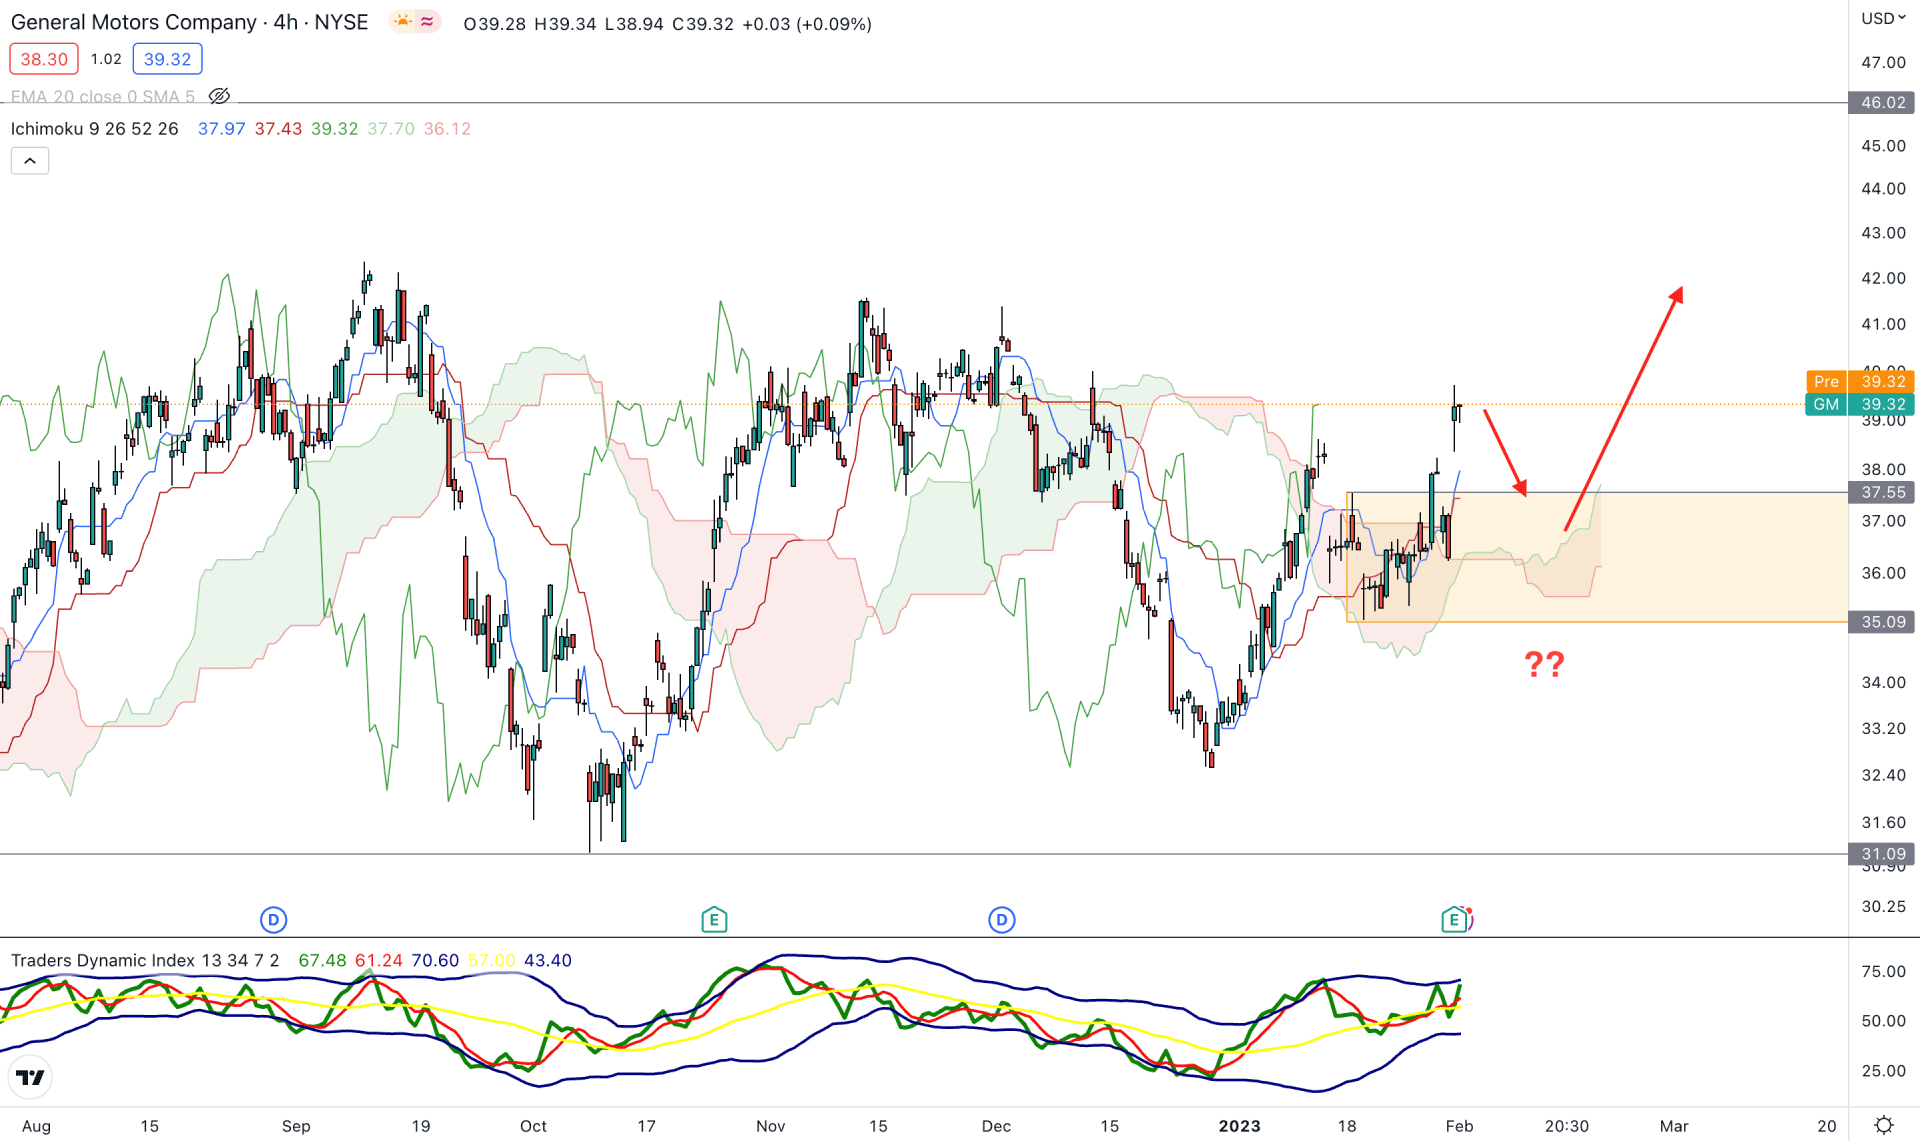
In the H4 chart, the current market outlook is extremely corrective. There are multiple violations below and above Kumo Cloud where the current price is trading about that recent dynamic support. In the future cloud, the gap between the Senkou Span A and B is towards the buyers’ side as both of these lines are moving higher.
In the indicator window, the Traders Dynamic Index is aiming higher, where a stable position above the 50% level signals buyers’ dominance in the market.
A minor bearish correction is still pending as the current price is above the Cloud zone. Therefore, any bullish rejection from the 37.55 to 35.00 area could offer a long opportunity, where the primary aim is to test the 46.00 level.
On the bearish side, any downside pressure and a bearish H4 candle below the 35.00 area could lower the price toward the 31.00 level.
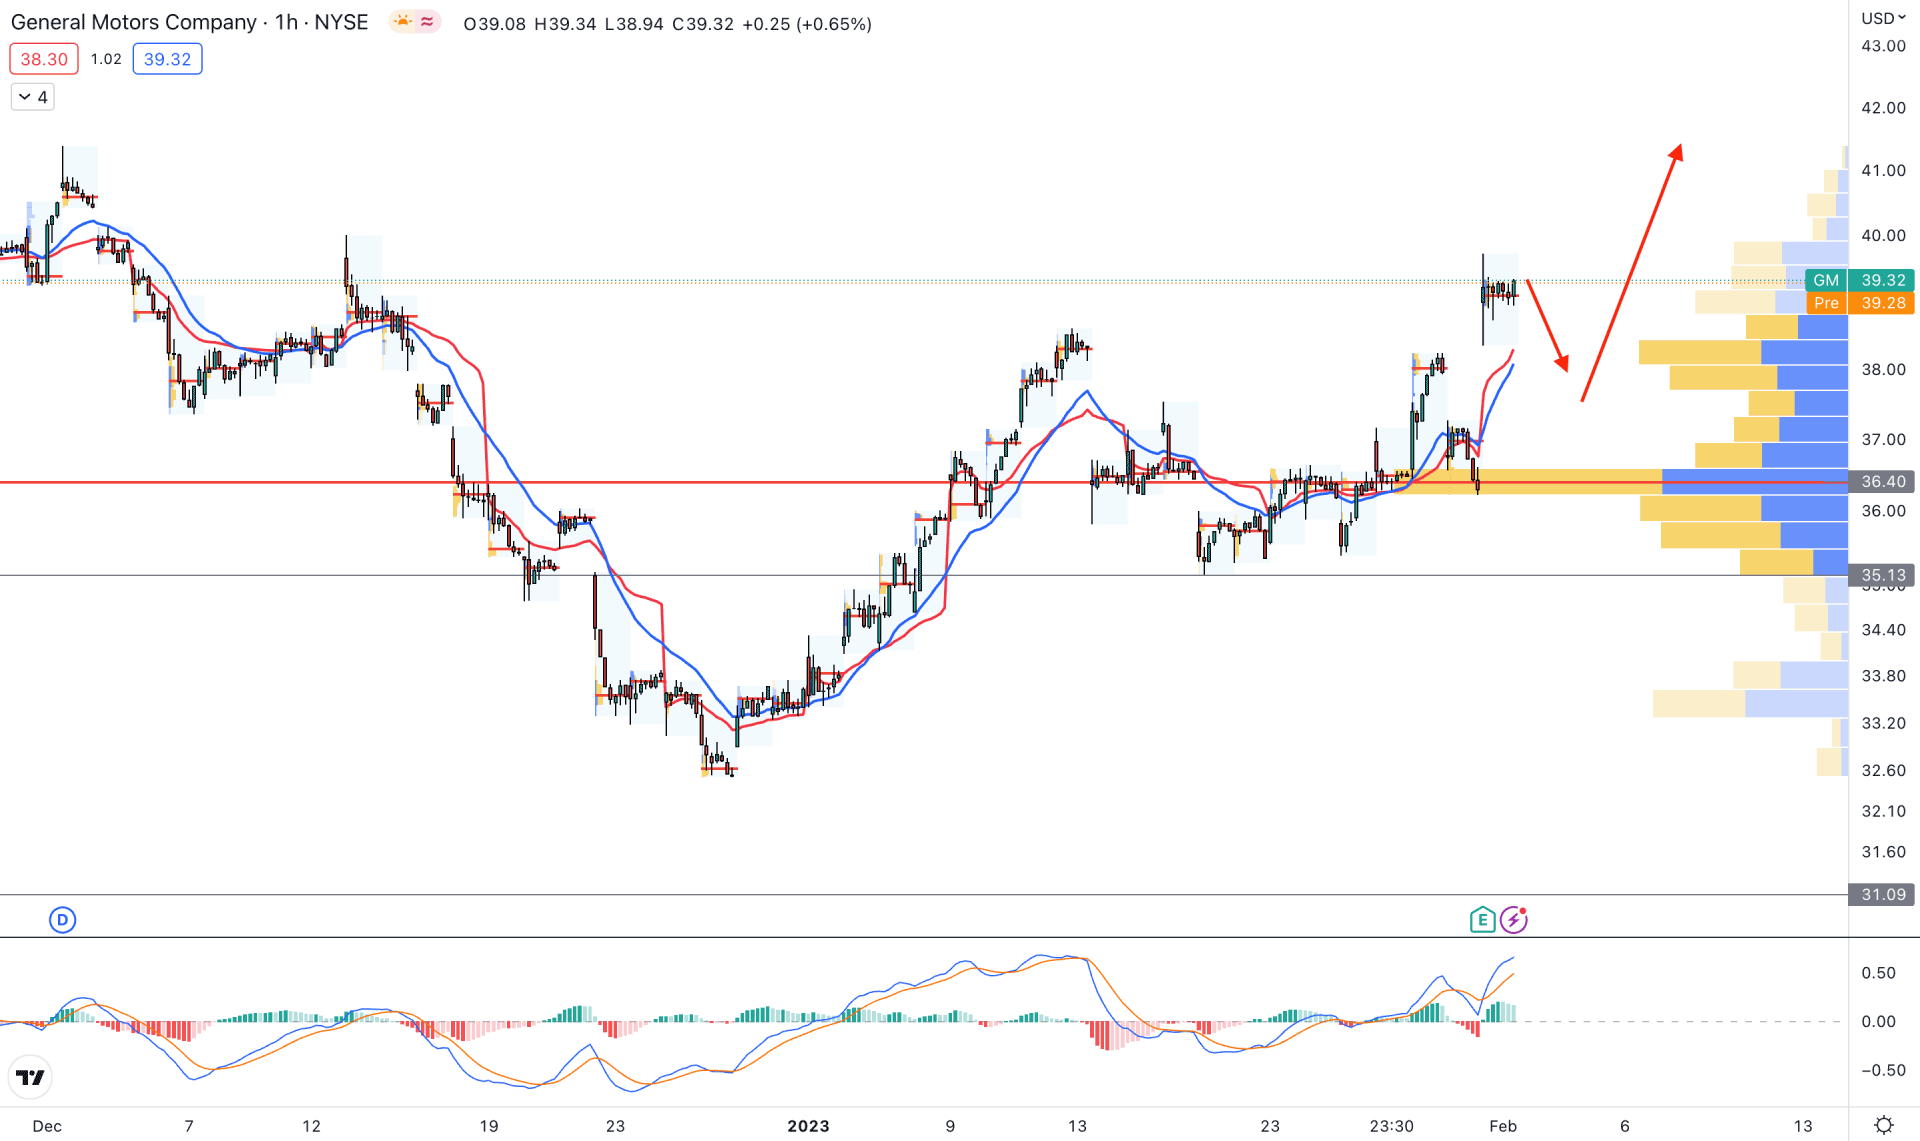
In the hourly chart, the current visible range high volume level is at 36.40 level, which is below the current price. Therefore, the primary aim of this instrument is to look for a long opportunity as long as bulls hold the price above the high volume level.
The dynamic 20 EMA and weekly VWAP are below the price, whereas the near-term static support level is a t 35.14 level.
Based on the hourly price prediction, any minor bearish correction could offer a long opportunity, but a stable price above the 20 EMA is needed to find a long conservative approach.
On the other hand, a stable break below the 35.00 level could eliminate the bullish possibility and lower the price toward the 31.00 support level.
Based on the current multi-timeframe analysis, bulls have a higher possibility of taking control over the price. However, a valid bullish breakout is still pending, and investors should closely monitor how the price trades at the 41.64 resistance level.


