
Published: June 30th, 2026
General Mills GIS, a packaged foods firm, will release its profits this week prior to market hours.
Last quarter, General Mills reported sales of $4.44 billion, dropping 8.4% year over year, meeting analysts' revenue projections. The company had a weaker quarter, missing both analysts' EPS and EBITDA projections by a large margin.
In contrast to the 3.3% decline it saw in the same period last year, the market anticipates General Mills's revenue to be unchanged year over year this quarter.
Stronger competition and seasonal merchandising opportunities are projected to support an increase in organic revenue during the final quarter, according to management.
It is anticipated that General Mills' Global Transformation efforts and Holistic Margin Management initiative will boost earnings. To support a sequential rise in operating efficiency and earnings, management also anticipates that several short-term headwinds that affected results earlier in the fiscal year will continue.
Despite stronger underlying business trends, profitability may have been moderated throughout the quarter due to prolonged consumer caution, high input costs, tariff-related inflation, and ongoing value investments aimed at boosting competitiveness.
Let's see the complete price projection from the GIS technical analysis:
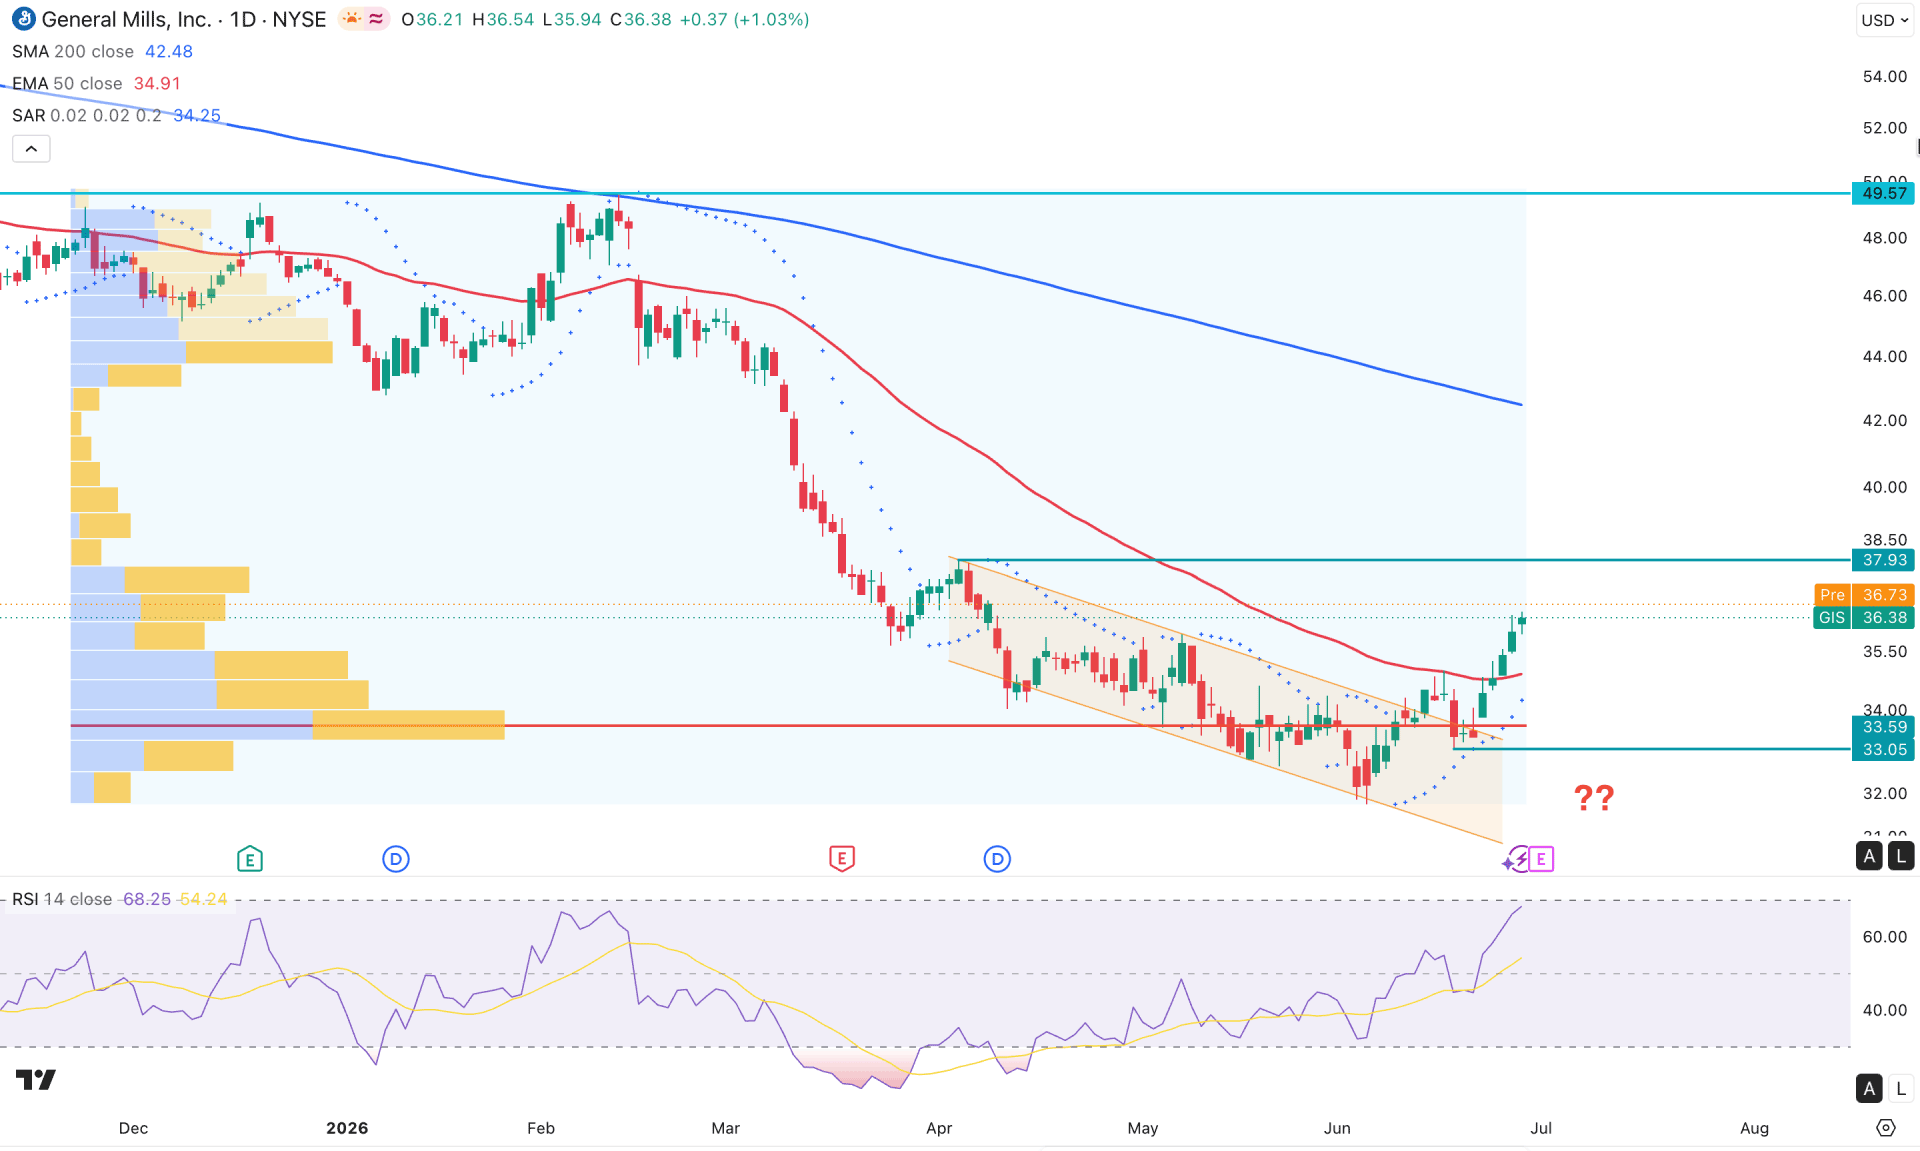
In the daily chart of General Mills stock, the recent price shows a bullish price action from the multi-year low price, which is a primary sign of a trend reversal.
Looking at the higher timeframe, the monthly candle suggests a bullish impulsive pattern from higher levels. The recent recovery came from the 2018 low. Moreover, the price recovered the loss incurred in May 2026 and is extending the buying pressure in the lower timeframe. The weekly timeframe shows a bullish inside bar breakout, which is an early sign of a bullish reversal.
In terms of volume, buyers are currently in a favorable position as the largest activity level since November 2025 is marked below the current price. As long as buyers hold the market momentum above this crucial line, the main anticipation would be to test the near resistance level.
In the main price chart, a descending channel breakout is present, followed by a recovery above the 50-day EMA. Rising Parabolic SAR at the bottom, along with a bullish crossover at the high-volume support, signals ongoing buying pressure.
On the other hand, the 200-day SMA is still above the current price with a bearish slope. In this context, a bullish continuation is possible, but the entire structure needs proper validation after testing the 200-day Simple Moving Average.
The Relative Strength Index (RSI) shows buying pressure reaching the highest level in a year. It is a sign of active momentum in the market that can take the price towards the near-term resistance level.
Based on the current market outlook, the entire structure is still bearish. Any immediate downside recovery with a daily close below the 33.59 support line could resume the existing trend towards the 30.00 area.
On the other hand, more clues are needed before anticipating a bullish trend reversal. The immediate resistance to look at is the 37.93 level. Breaking out from this line could be a positive achievement for buyers, as it could open room for testing the 49.57 key resistance level.
However, a minor downside recovery is possible from the current price area, and a bullish rebound from the high-volume 33.50 support level could be a short-term opportunity targeting the 37.93 level.
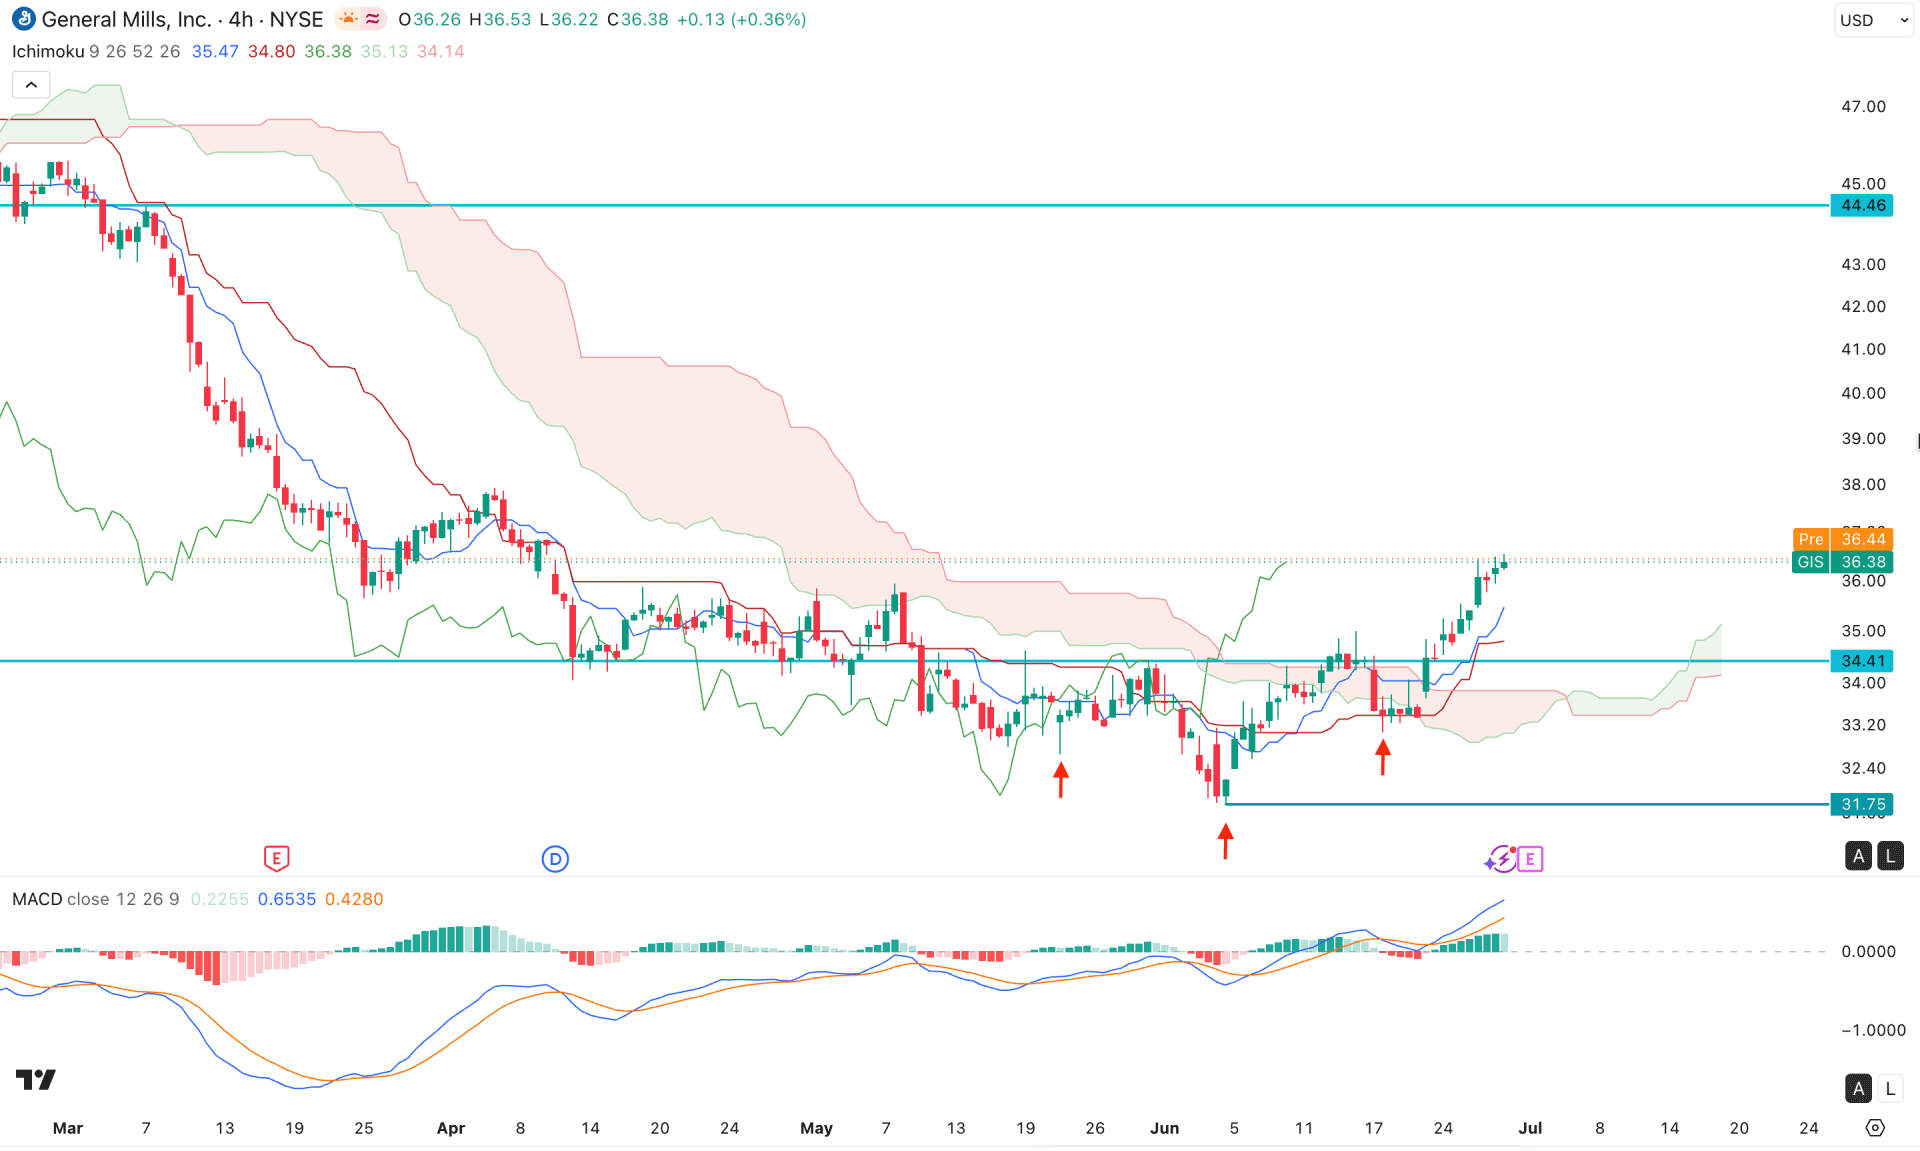
In the four-hour timeframe, the current price is trading above the cloud support, signaling a valid bullish trend reversal. Most of the buying is supported by an inverse Head and Shoulders breakout, and the current price is expected to retest the support line to validate the reversal.
In the future cloud, both lines are heading up, signaling a stable trend along with the rising signal line in the MACD indicator.
Based on the overall market structure, the price is trading above the 35.83 crucial swing high, from where valid buying pressure is possible. Investors should closely monitor how the price holds the bullish momentum in this area, as any immediate bearish reversal below the cloud support could invalidate the bullish structure.
On the other hand, a corrective downside pressure with a recovery from the dynamic support area could increase the possibility of testing the 44.46 key resistance level.
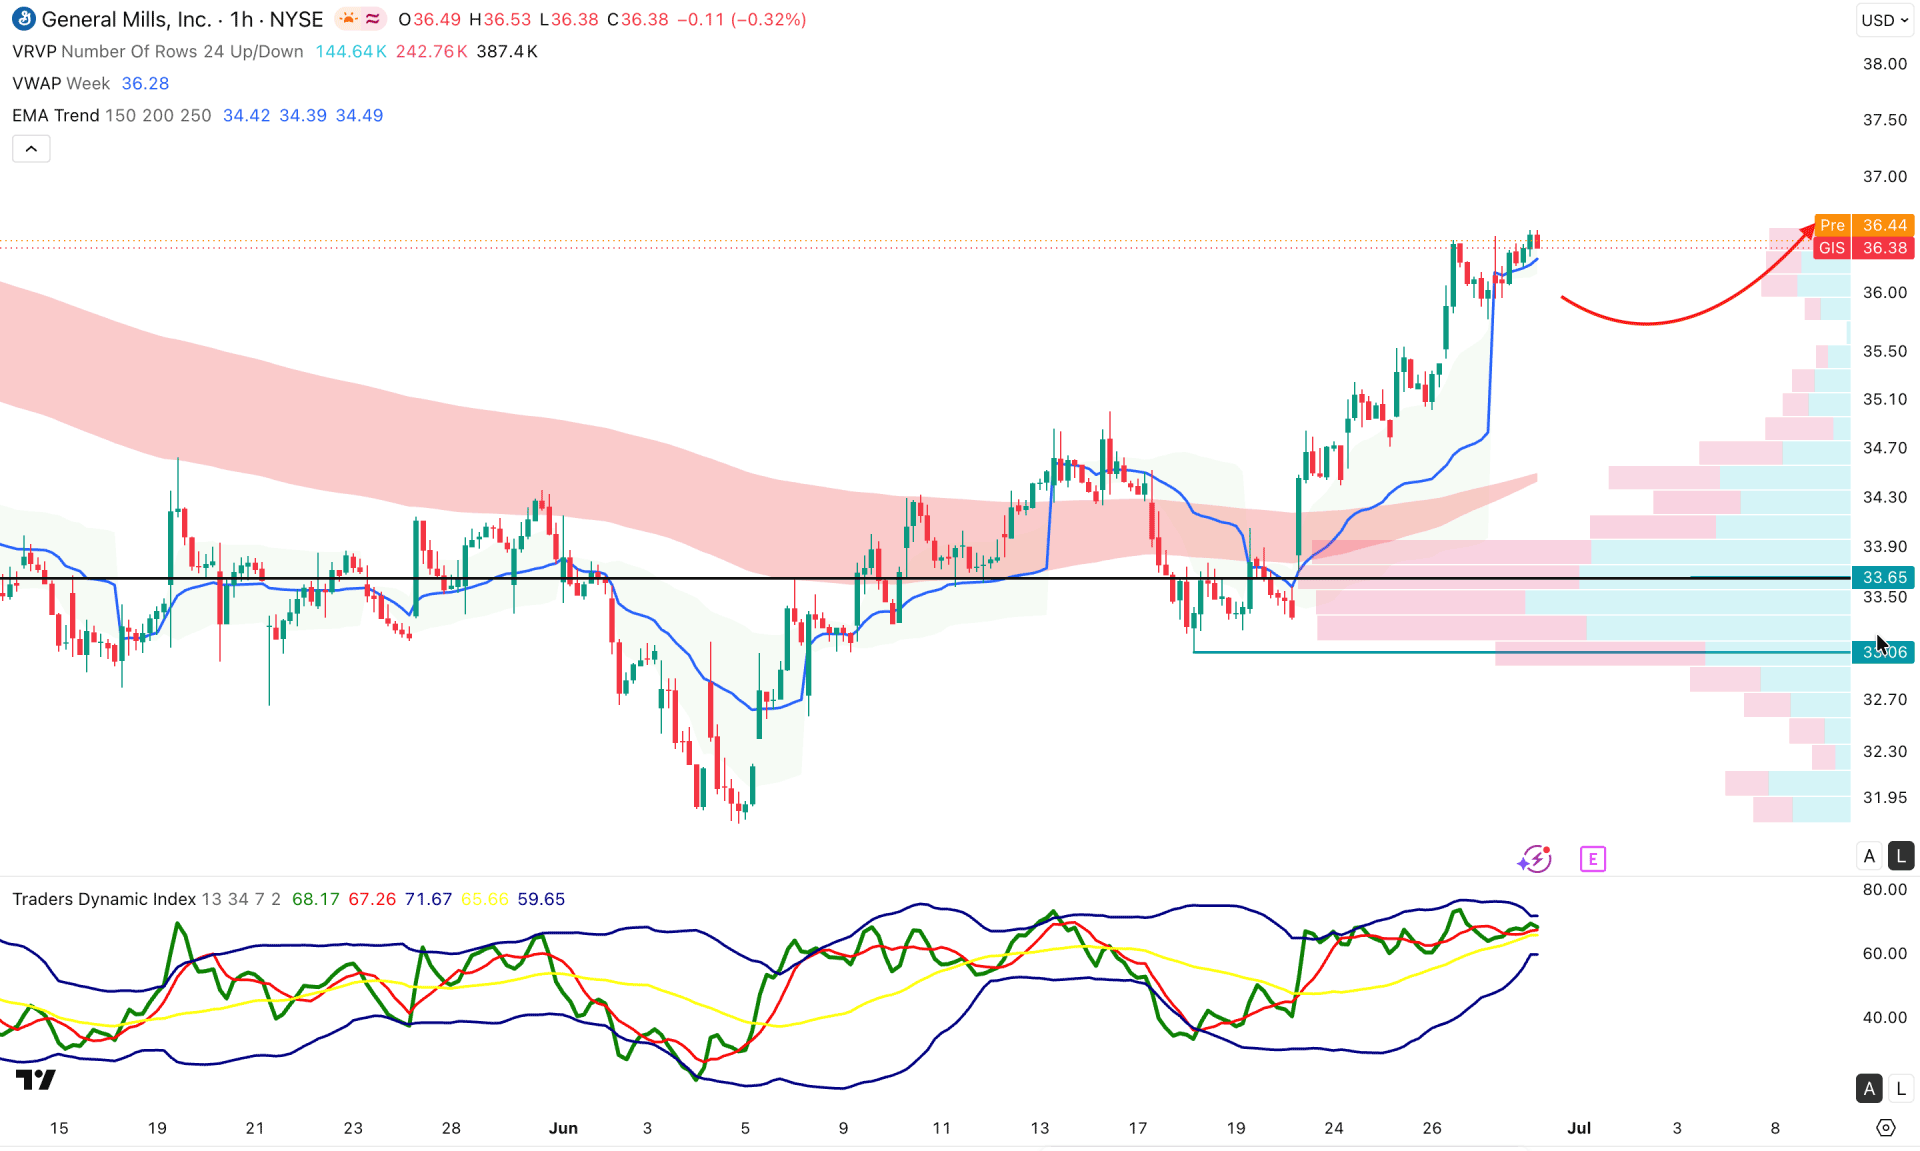
The hourly timeframe shows a similar outlook, as the current price is having buying pressure after forming a minor downside recovery at the 33.06 bottom. As the current price is hovering above the intra high-volume line and EMA wave, we may expect the buying pressure to remain valid.
Moreover, the weekly VWAP line is closer to the current price and is working as an immediate support level.
The Traders Dynamic Index is above the 50.00 neutral line for a considerable time, but shows no significant bullish pressure. It is a sign of a corrective market momentum from which a considerable correction could appear.
Based on this market structure, investors should closely monitor the price behavior at the weekly VWAP area. The gap between the current price and the EMA wave increases the possibility of forming an extended downside correction towards the 34.50 area before forming a bullish move.
On the other hand, any immediate bearish pressure with a stable price below the 33.06 line could be an alarming sign for buyers. In that case, the price might extend the long-term bearish strength and make a new swing low below the 30.00 psychological line.
Based on the overall market structure, General Mills Stock (GIS) is trading within a possible bullish pre-breakout structure. Although a solid bottom is not formed, the bias is bullish with sufficient buying pressure. However, investors should monitor the upcoming earnings report, as better-than-expected earnings could help this stock recover from the multi-year low price.


