

Published: October 27th, 2026
Energy transition firm GE Vernova (GEV) is scheduled to release its quarterly earnings this week, and investors are keen to know the actual outcome.
Last quarter, GE Vernova reported revenue of $11.1 billion, up 21.9% year on year, exceeding analysts' expectations. However, its overall performance was uneven. The company's full-year revenue outlook came in slightly above market forecasts, while earnings per share (EPS) fell considerably short of expectations. For the upcoming quarter, analysts anticipate 20.5% year-on-year revenue growth, up from 11.8% in the same period last year.
Over the past year, investor sentiment has shifted between several major themes, including the potential disruption of businesses by AI, rising AI-related capital expenditure, geopolitical tensions, interest rate expectations and concerns about the broader economic outlook. Against this uncertain backdrop, electrical systems stocks have struggled to maintain momentum, declining by an average of 4.2% over the past month.
GE Vernova has underperformed the wider group, with its share price falling 9.5% over the same period. Ahead of its earnings announcement, the stock carries an average analyst price target of $1,224.
Let's see the full outlook from the GEV multi-timeframe analysis:
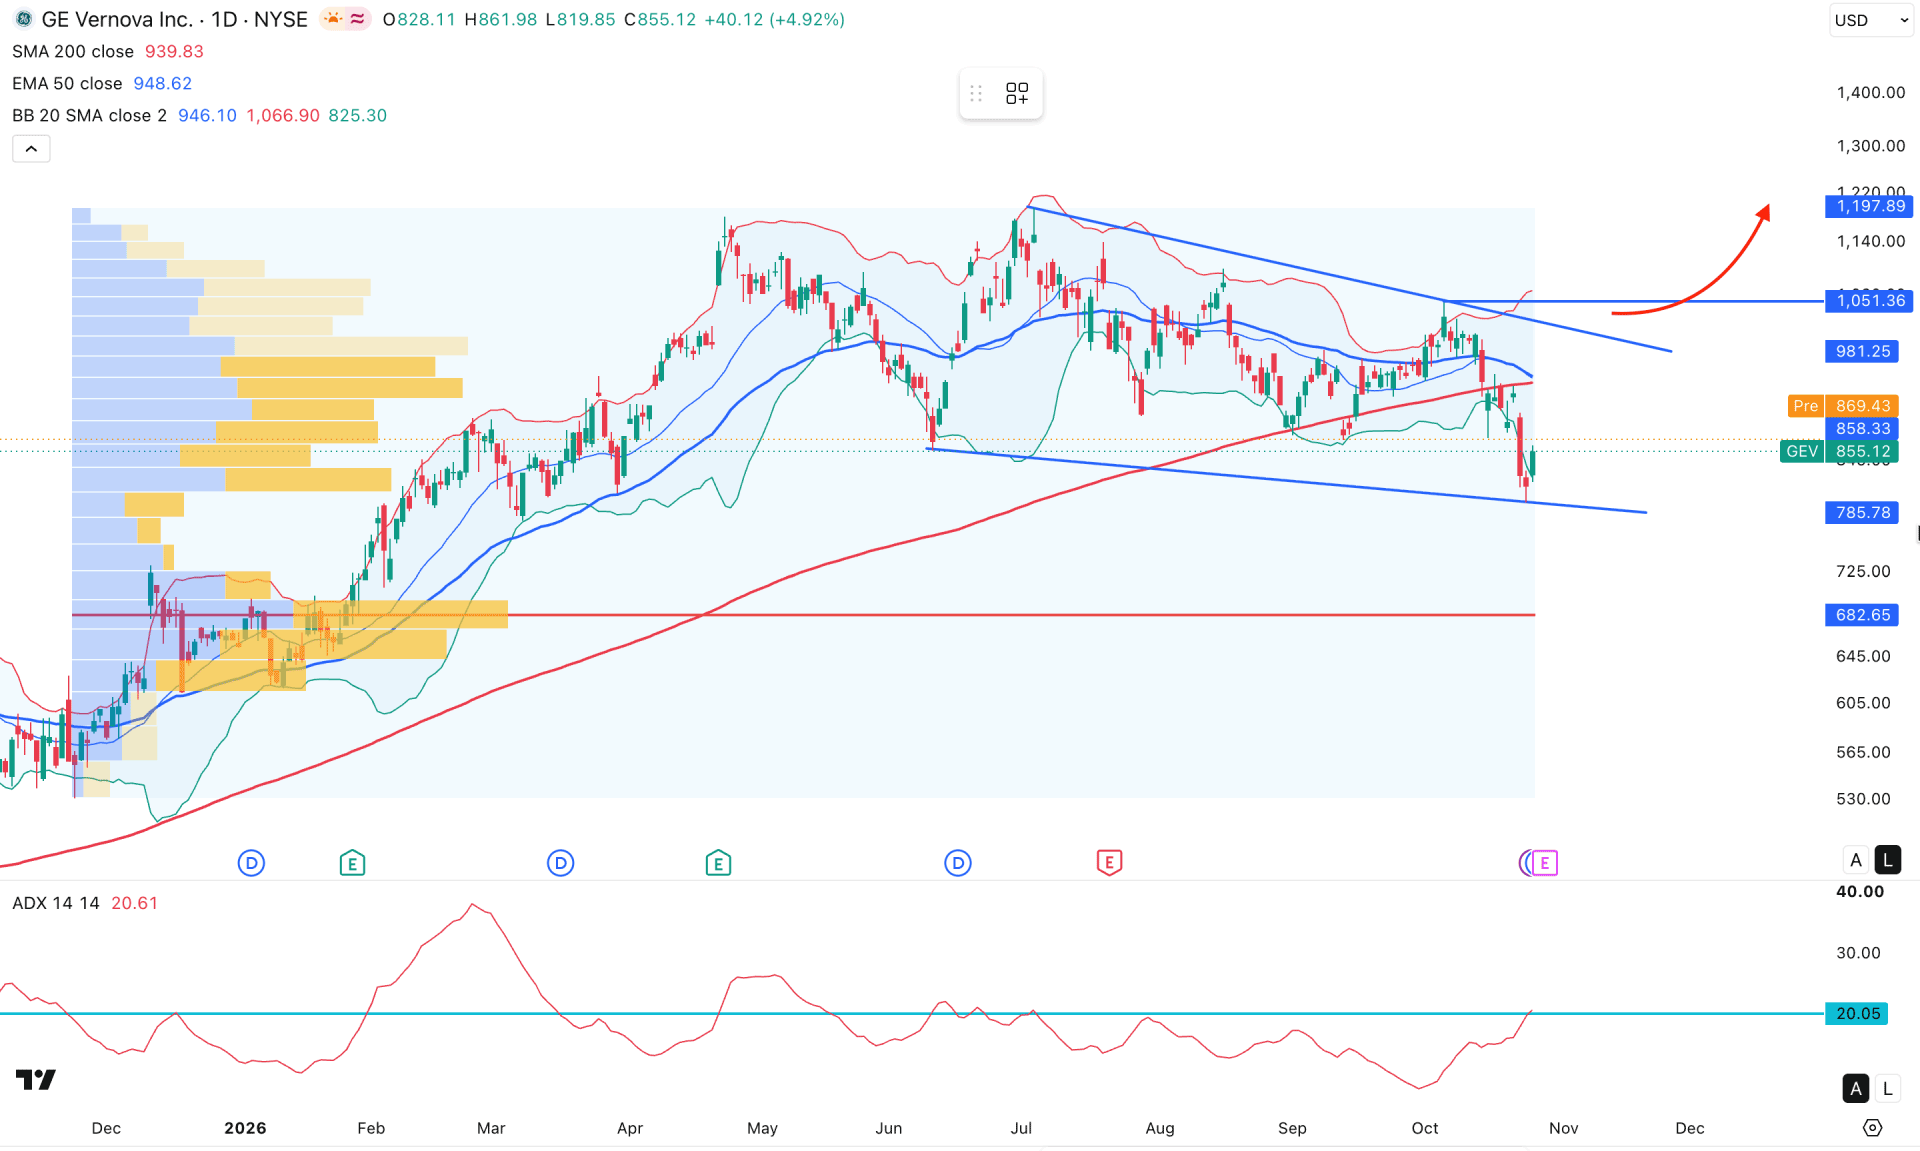
On the daily chart of GE Vernova stock, market momentum is sideways, and existing buying pressure remains valid. In that case, the traditional approach for this stock is to look for bullish trend-continuation momentum as long as the sideways structure remains intact.
Looking at the higher timeframe, corrective momentum is clear. The monthly candle suggests sideways pressure from the all-time high area. The weekly chart shows the same outlook, with corrective pressure and no sign of a bearish trend reversal. As price trades sideways with no top exhaustion, it is less likely to rebound lower in a pump-and-dump.
As per the volume structure, the bullish momentum is valid. The most significant level since December 2025 is 682.65, which is well below the current price. The price rebounded lower from the 1197.38 high without significant volume activity, suggesting weaker selling pressure.
In the main price chart, a trend trading opportunity is visible higher. The Average Directional Index (ADX) is marked at the 20.00 level with a bullish rebound.
On the other hand, the main price shows a slightly different structure higher, where the price rebounded lower, below the 200-day SMA and 50-day EMA. Currently, the price has been hovering below these two crucial lines for a considerable time, which signals an alarming sign for buyers. However, the 50-day EMA is still above the 200-day SMA with no sign of a death cross formation. Price is trading within a pennant pattern from higher levels, where the most recent rebound needs proper validation before anticipating a bullish breakout.
Based on the overall market structure, a conservative long approach is to wait for price to move beyond the 1051.36 resistance level, which could open room for a new all-time high. However, an early long signal might come after overcoming the 50-day EMA level with a bullish daily candle.
On the downside, the price is already testing a crucial support level, with the entire structure below the 200-day SMA. In that case, a new swing low formation below the 798.96 level could increase the possibility of testing the 682.65 level.
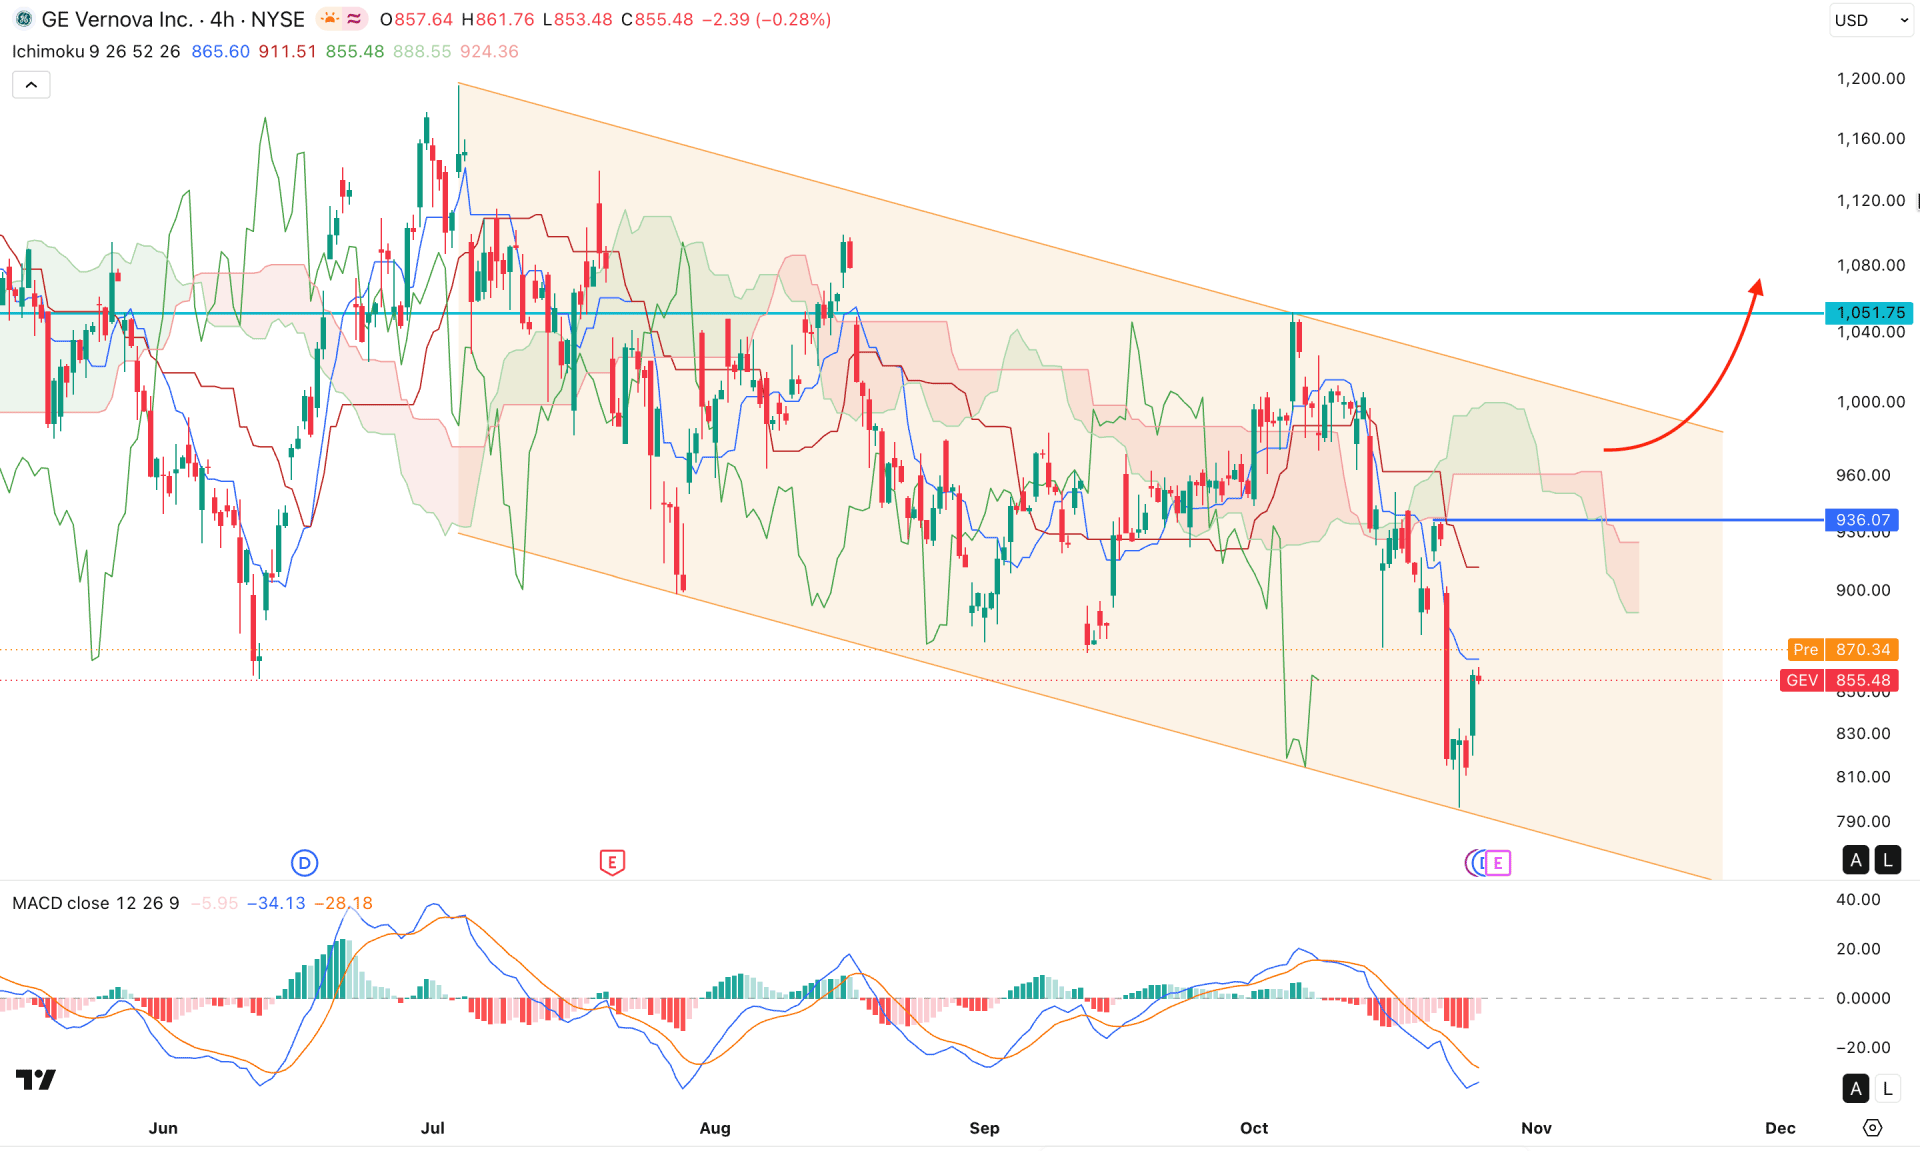
On the four-hour timeframe, market momentum is sideways, with multiple bearish 4-hour candles below the Kumo cloud. The future cloud has also shifted lower, with both lines pointing down and signaling bearish momentum.
In the secondary indicator window, the MACD histogram has recovered its position and reached the neutral area. The signal line has found a bottom with a possible rebound from the lowest area.
Based on this outlook, price action has yet to validate a bottom formation in this stock. A move above the Kumo cloud area could invalidate the entire downside scenario and initiate a highly probable long opportunity at any time. In that case, the immediate resistance target is 1051.75.
On the other hand, the bearish opportunity remains valid as long as the price stays below the 936.07 swing high. In that case, the price is likely to create a new swing low and test the 750.00 level.
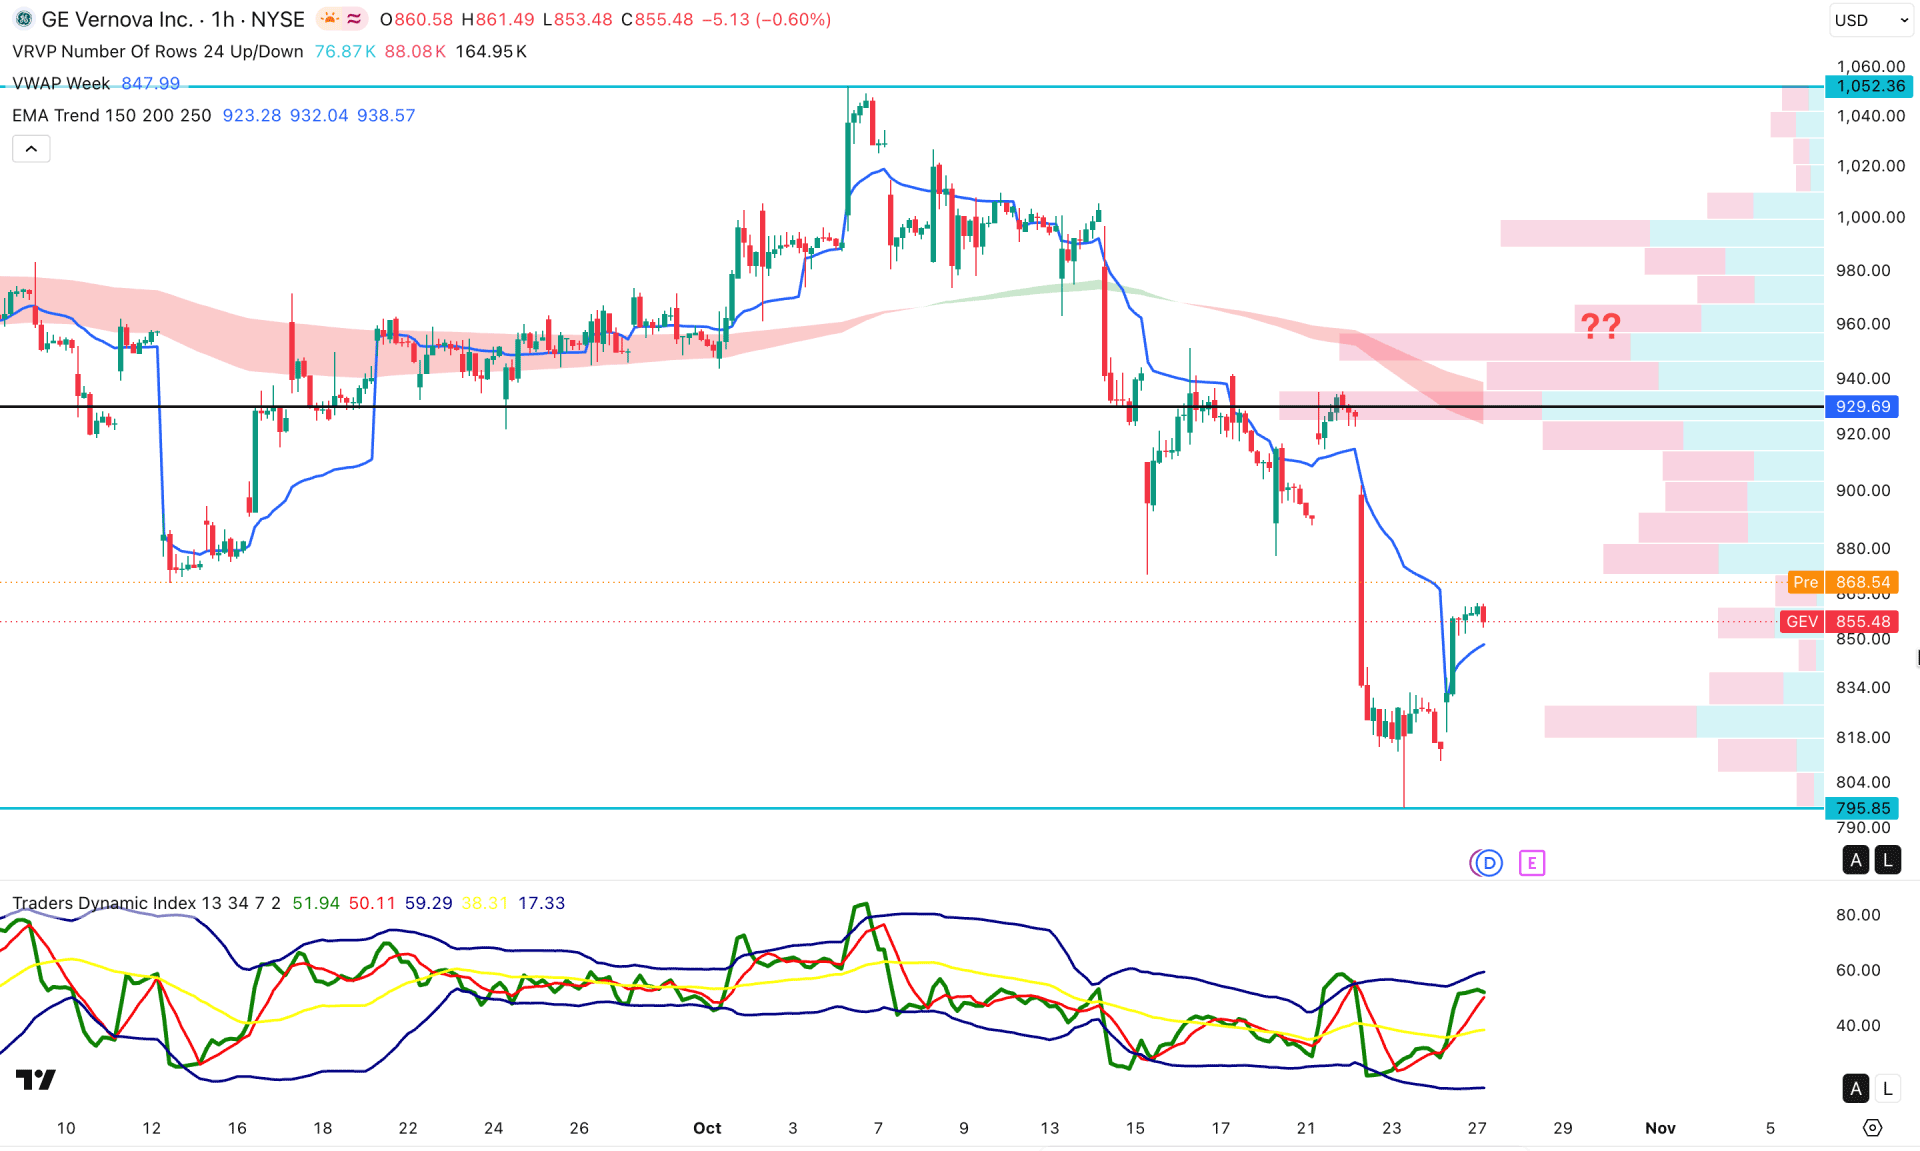
On the hourly timeframe, price is trading in a bearish continuation momentum, with the EMA wave above the current structure. Moreover, the high-volume level at 929.69 is above the current price and is acting as a key resistance.
On the other hand, the recent rebound above the VWAP line, along with the Traders Dynamic Index moving above the 50 level, signals bullish activity in the market.
Based on this market structure, a rebound above the VWAP level opens room for more bullish correction in the daily structure. However, the downside possibilities remain valid as long as the 929.69 level is untouched.
A bullish break above this line could invalidate the bearish structure at any time and open a long opportunity targeting 1052.36.
Based on the overall market structure, GEV is trading within a corrective structure while the overall market momentum remains bullish. The price is at a potential bottom for a rebound, where a breakout could resume the existing bullish trend at any time.


