
Published: January 16th, 2024
The US Consumer Price Index (CPI) for December increased by 3.4% year-over-year on Thursday, exceeding market expectations of 3.2% and the November figure of 3.1%, respectively. Excluding the highly volatile food and energy prices, the Core CPI demonstrated a monthly increase of 0.3%.
Despite the initial positive impact of the inflation figures on the US Dollar Index (DXY), they could not persuade the market that the Federal Reserve (Fed) might refrain from implementing a rate cut in March. A 25 bps rate cut in March is predicted by the CME FedWatch Tool with a probability of nearly 70%, while the yield on 10-year US Treasury bonds remains below 4%.
In the UK, an encouraging development came from the Office for National Statistics (ONS) that the Gross Domestic Product (GDP) expanded by 0.3% every month in November. This favorable development contributed to the Pound Sterling's continued strength against the USD.
In anticipation of future developments, the annual producer inflation rate in the US is anticipated to increase from 0.9% in November to 1.3% in December. As per the latest data, a significant increase in PPI would be required to convince investors that the Federal Reserve will delay its policy pivot until the end of the second quarter.
Let’s see the upcoming price direction of the GBPUSD price based on technical analysis:
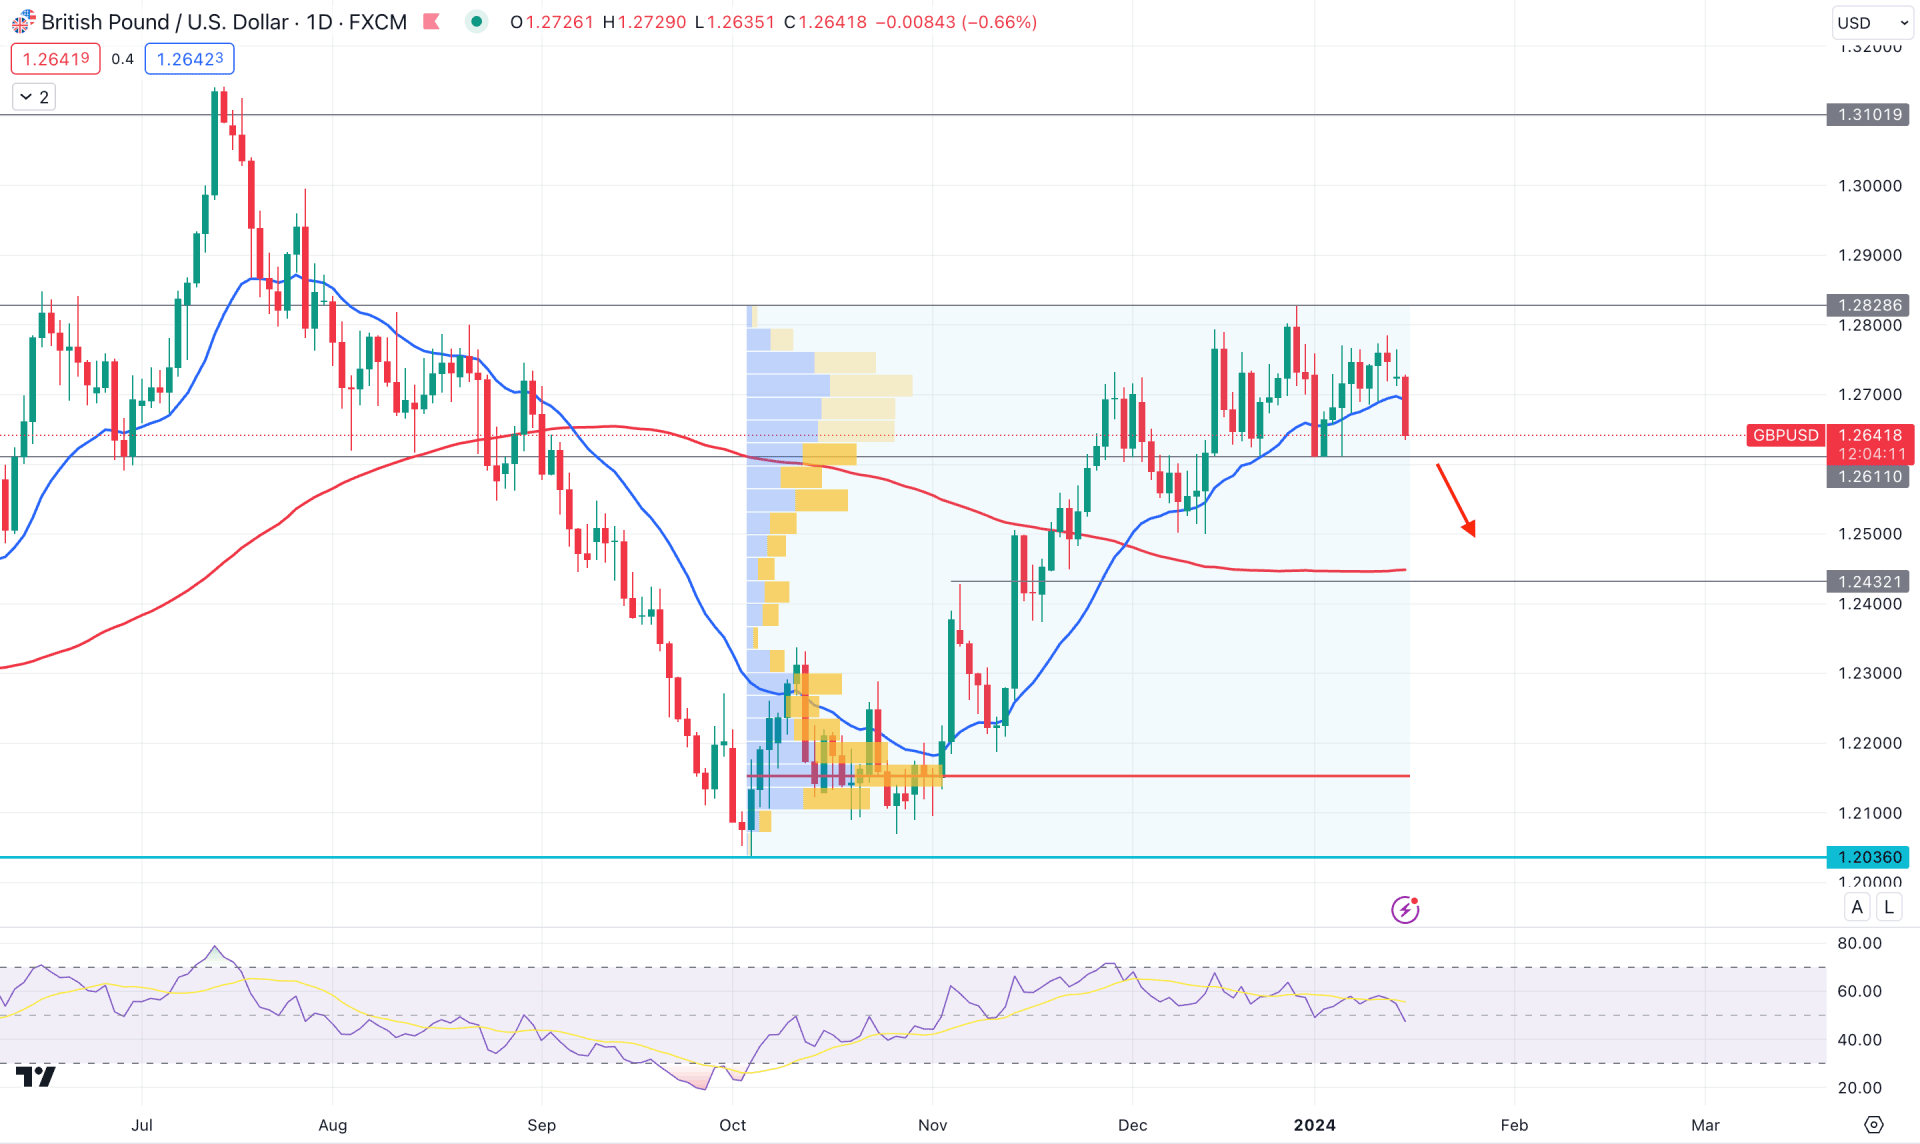
In the daily chart of GBPUSD, the recent price shows a corrective momentum at the top, suggesting that bulls are struggling to keep their gains. In this context, an extensive downside correction might happen.
In the monthly candlestick pattern, the downside correction in January remains within a bullish body of the previous month. Moreover, a V-shape bullish recovery is present, which failed to overcome the near-term resistance. On the other hand, an extreme correction is visible in the weekly timeframe, which remained indecisive for five consecutive weeks. In that case, we may expect a considerable downside correction in this pair, which is within a bullish leg.
In the volume structure, the highest activity level since the October 2023 low is marked at the 1.2161 level, which is way below the current price. As the recent price was overextended from the high volume level, a downside correction is pending as a mean reversion.
In the main chart, the price moved below the 20-day Exponential Moving Average, indicating immediate selling pressure. However, the long-term 100-day SMA support is still protected. The Indicator window suggests a downside continuation as the recent level moved below the 50.00 neutral line.
Based on this outlook, GBPUSD bears might regain momentum after coming below the 1.2611 support level. A daily candle below this level could offer a short opportunity, targeting the 1.2400 psychological level.
On the bullish side, a bullish pressure with a daily candle above the 1.2763 level could offer a long opportunity, targeting the 1.3000 psychological level.
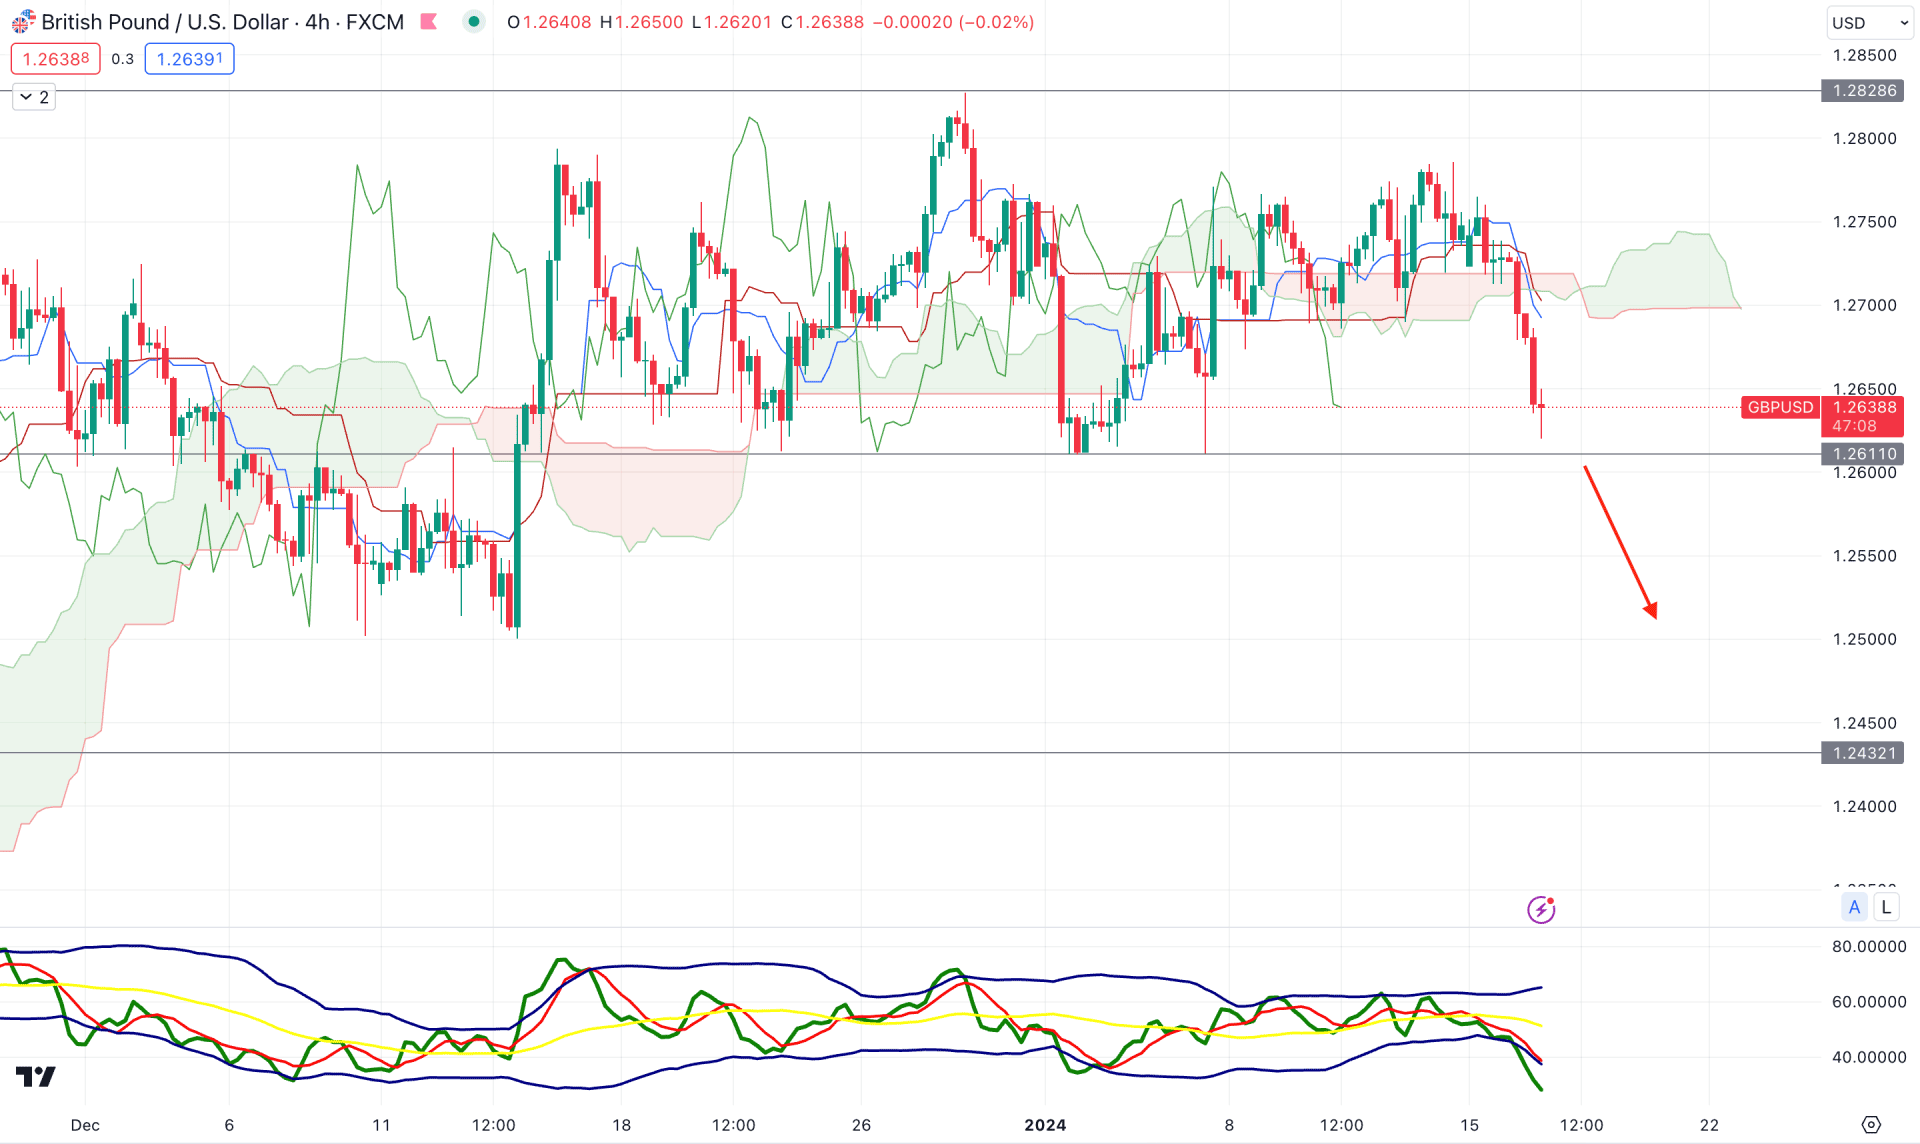
In the H4 timeframe, the corrective market momentum is visible as there are several violations from the Ichimoku Cloud area. However, the most recent price action shows a strong bearish pressure with multiple H4 candles below the cloud support.
In the secondary window, the Traders Dynamic Index (TDI) moved beyond the lower band, which suggests extreme selling pressure. Moreover, the Senkou Span A and B reached a point which suggests a possible downside momentum.
Based on the H4 outlook, investors should monitor how the price reacts to the 1.2611 static support level. The primary trading idea is to find a bearish H4 daily candle below the near-term level, which could lower the price toward the 1.2432 support level.
On the bullish side, an immediate bullish V-shape recovery with a daily candle above the 1.2760 level could offer a long opportunity in this pair.
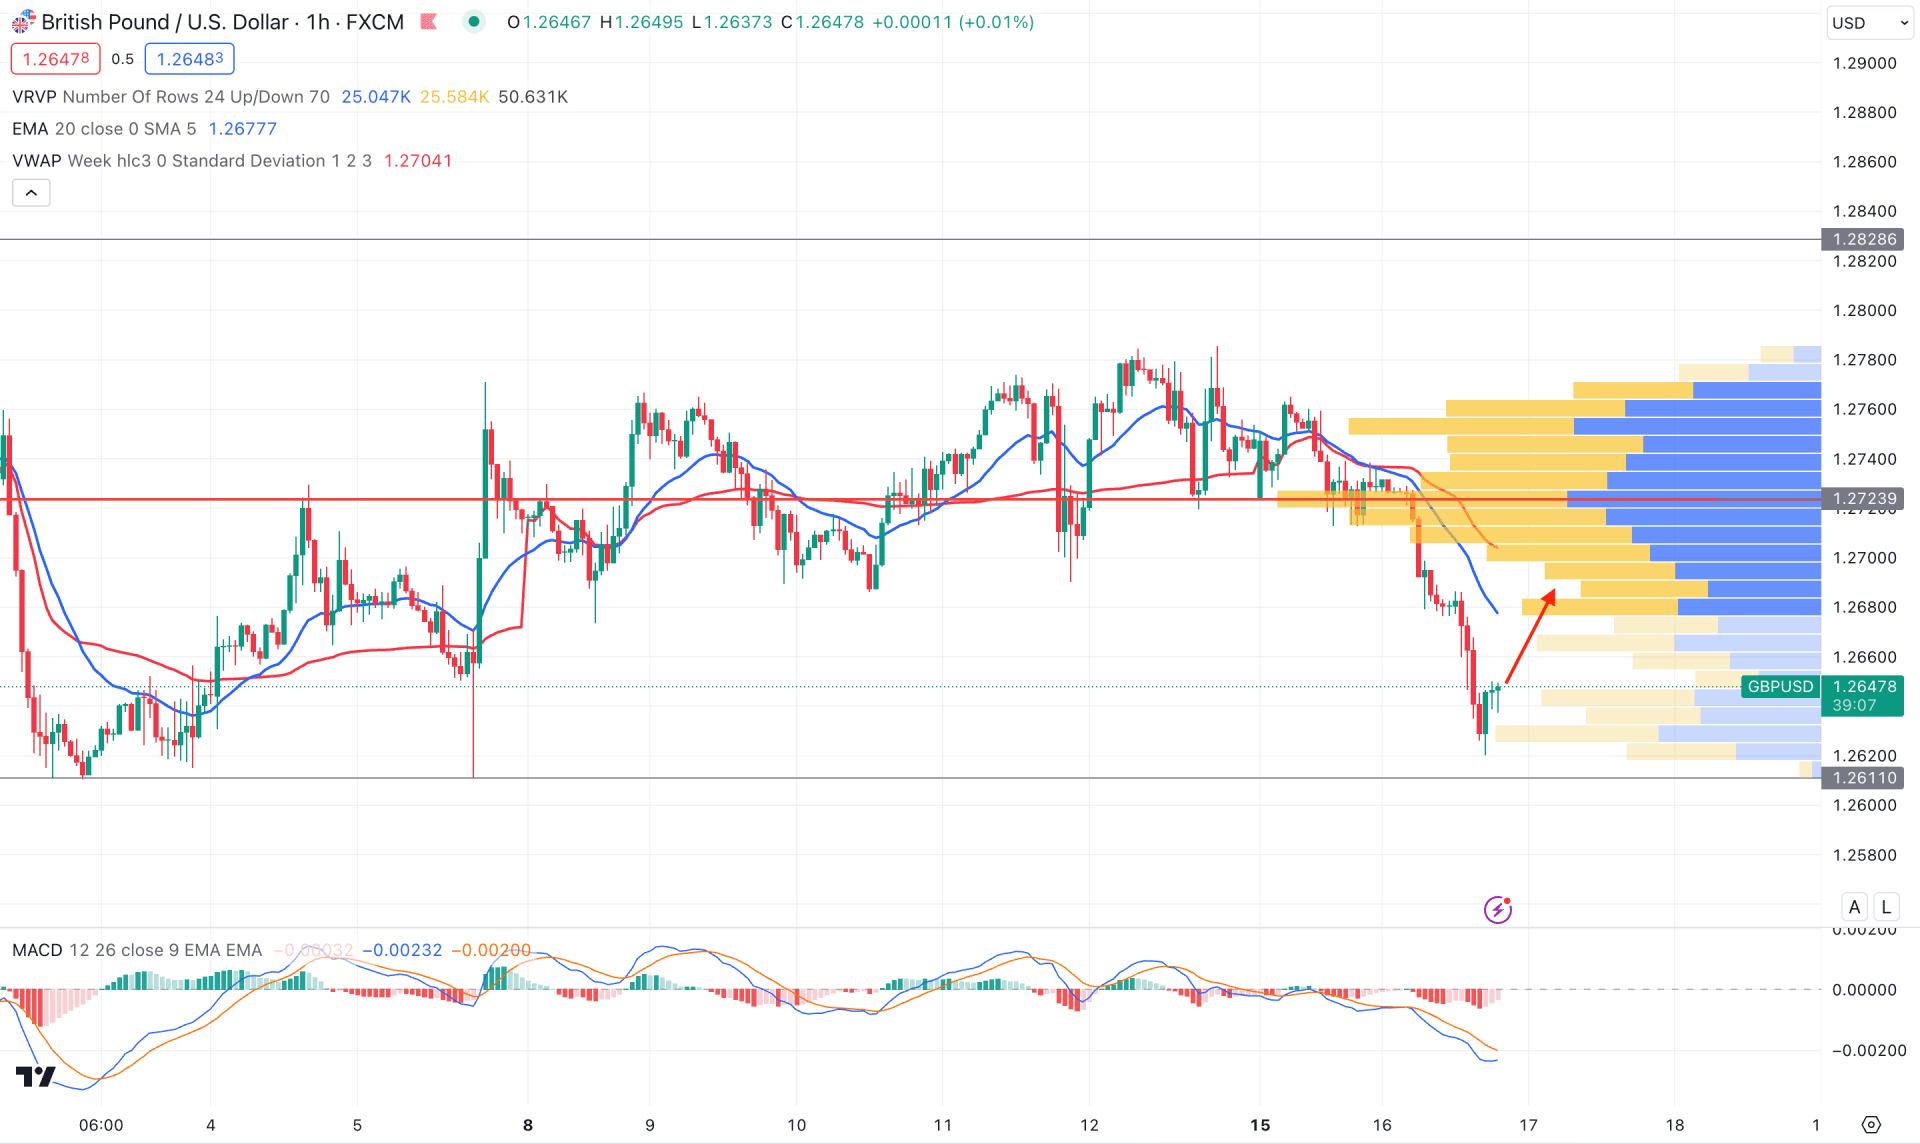
In the hourly chart, the overall market momentum is corrective, with no clear direction. However, the recent price trades below the visible range of high volume, which indicates short-term sellers' presence in the market.
Moreover, the dynamic 20 EMA and weekly VWAP are above the current price, with downside pressure, suggesting a confluence of selling pressure in the price.
Based on this outlook, a bullish recovery with an hourly close above the 1.2740 level could be a high probable long opportunity, which could increase the price towards the 1.2900 area.
On the bearish side, further selling pressure might come after coming below the 1.2600 level with an hourly close.
Based on the current multi-timeframe analysis, the overall market pressure is corrective, and investors might expect the downside pressure to extend in the coming days. However, a strong sell signal might come after violating the near-term support level in the intraday chart.


