
Published: December 14th, 2021
The UK is passing a busy week where the main investors’ focus is how the daily cases and hospitalizations rate are coming. The Bank of England will sit on Thursday where the impact of the virus in the UK economy would be a matter of attention after the close call on the rate hike.
Among the other two top-tiered releases, the employment rate aligned with the expectation of 4.2%, with a decline in the average Earnings Index 3m/y to 4.9%. The inflation data is due for Wednesday and is expected to come at 0.5%, down from the 0.6% previous report. However, any hot inflation report would increase the opportunity of the rate hike, boosting the Pound against the US Dollar. Besides, the retail sales figures are due on Friday, which may align with the expectation of 0.8% due to the Black Friday sales.
Lots of volatility may come from the FOMC statement, where the current market is already bullish for the US Dollar. Therefore, any uncertainty regarding the Omicron sentiment would negatively impact the USD. Moreover, the US PPI and Retail Sales would further indicate the US economy.
Let’s see the upcoming price direction from the GBPUSD technical analysis:

GBPUSD bears became strong as soon as the price faced selling pressure from the 1.3820 supply area, pushing the price to break the bearish structure. However, the selling pressure from the 1.3820 level overextended and reached the 1.3200 key support level with extreme volatility. As a result, the price squeezes to a falling wedge pattern and shows a bullish breakout. Therefore, as long as the daily candle stays above the 1.3200 level, the buying pressure may extend towards the 1.3500 area.
The above image shows how the falling wedge pattern formed. Moreover, the price shows a bullish breakout from the pattern with a considerable correction from the trendline support. Meanwhile, the MACD Histogram turned PNP formation with a divergence between the price and Histogram.
Based on the daily structure, the bullish sentiment is valid as long as the price trades above the 1.3200 level. Moreover, any daily candle close above the dynamic 20 EMA would increase the buying pressure with the target of 1.3500 level. Conversely, a break below the 1.3200 level with a strong bearish daily candle may alter the current market structure and initiate a new swing low.
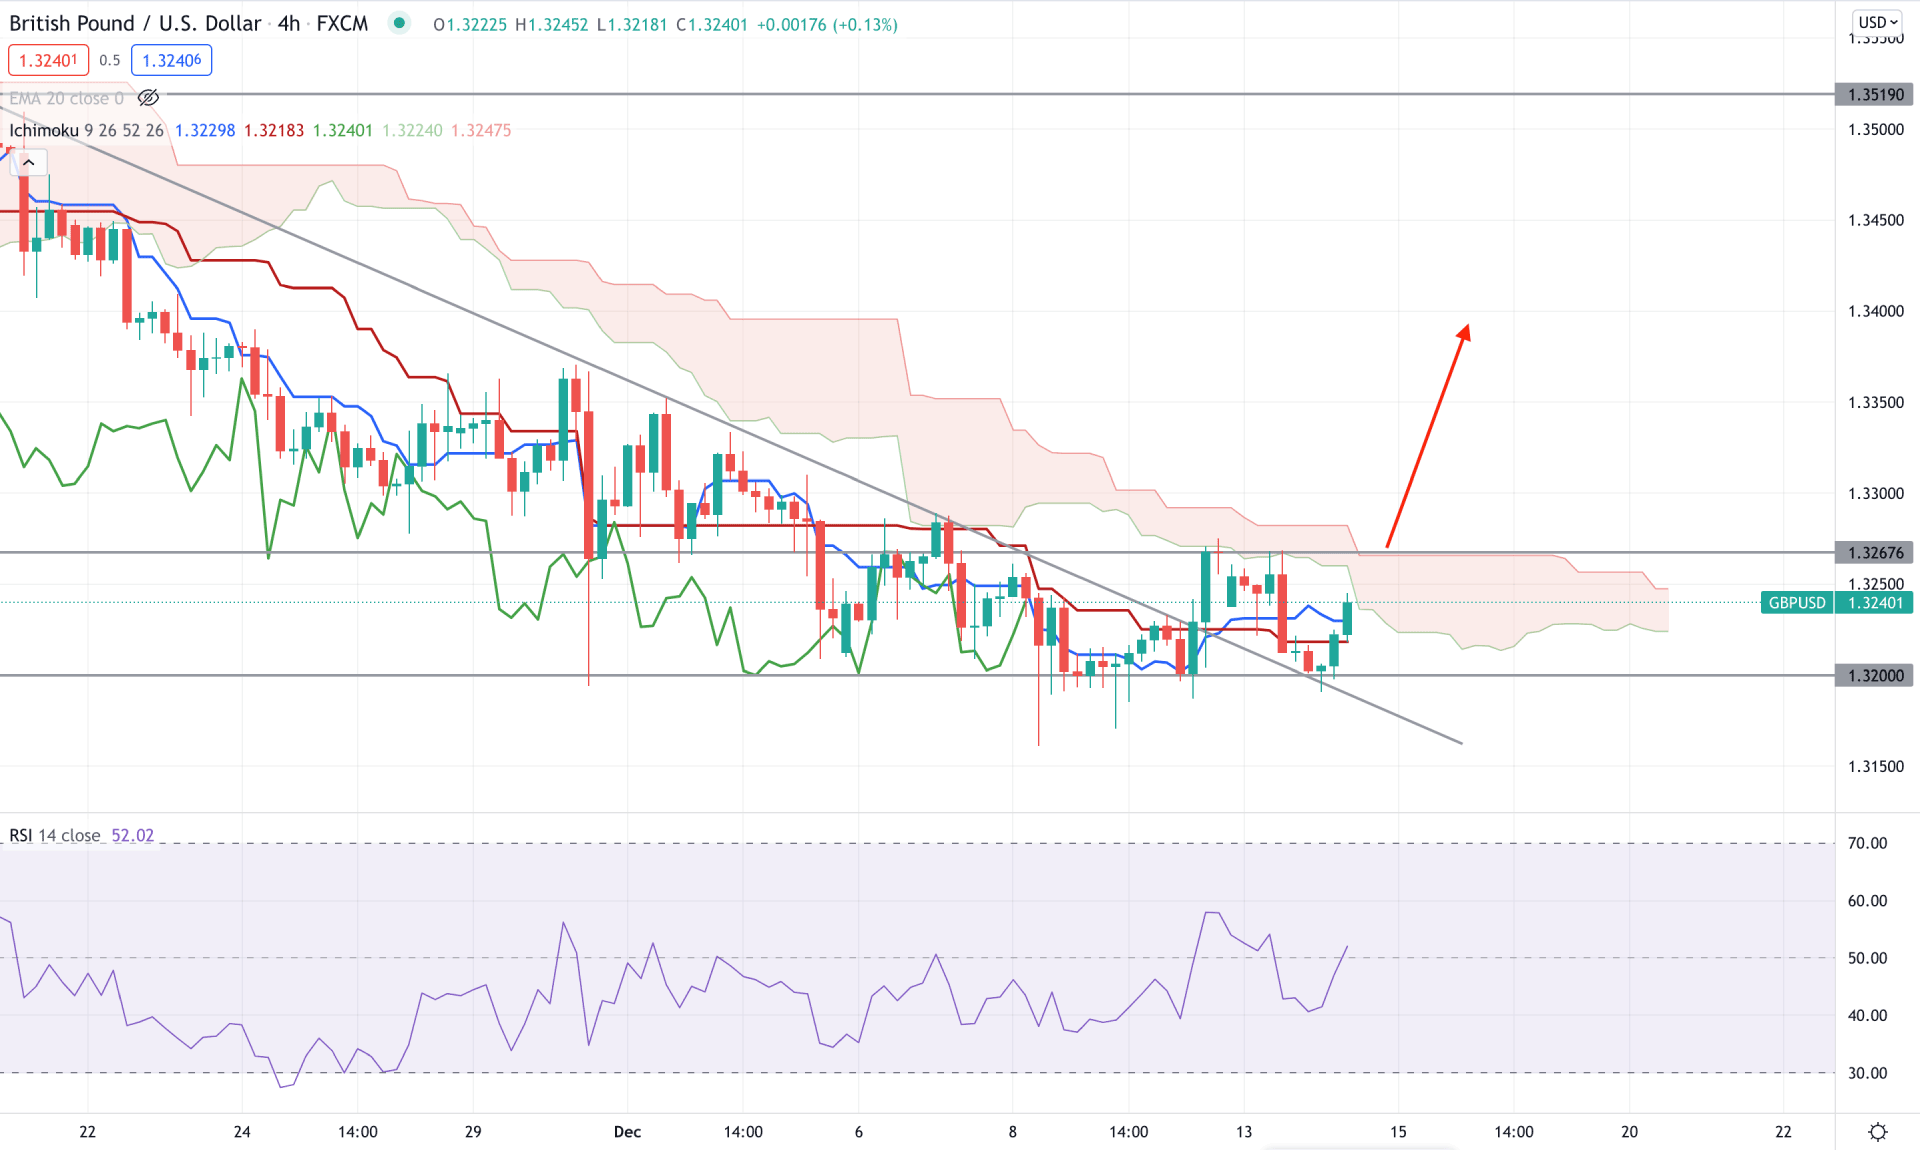
According to the Ichimoku Kinko Hyo, GBPUSD is below the Kumo Cloud, where the overall market direction is bearish. Senkou Span A is below Senkou Span B but getting weaker in the Future Cloud. Meanwhile, the Lagging Span is with the price with no bullish indication.
The RSI is hovering around the 50 levels in the indicator window after testing the oversold 30 levels. Therefore, the RSI level is likely to test the overbought 70 levels in the coming days with a bullish pressure in the price. In the current chart, the price moved above the Tenkan Sen and Kijun Sen, where any bullish H4 close above the 1.3267 would indicate a trend change.
Based on the H4 context, any bullish H4 close above the 1.3267 level would be a decent buying opportunity in this pair with the target of 1.3500 level. On the other hand, a break below the dynamic Kijun Sen with a bearish H4 close may alter the current market structure and lower the price towards the 1.3100 area.
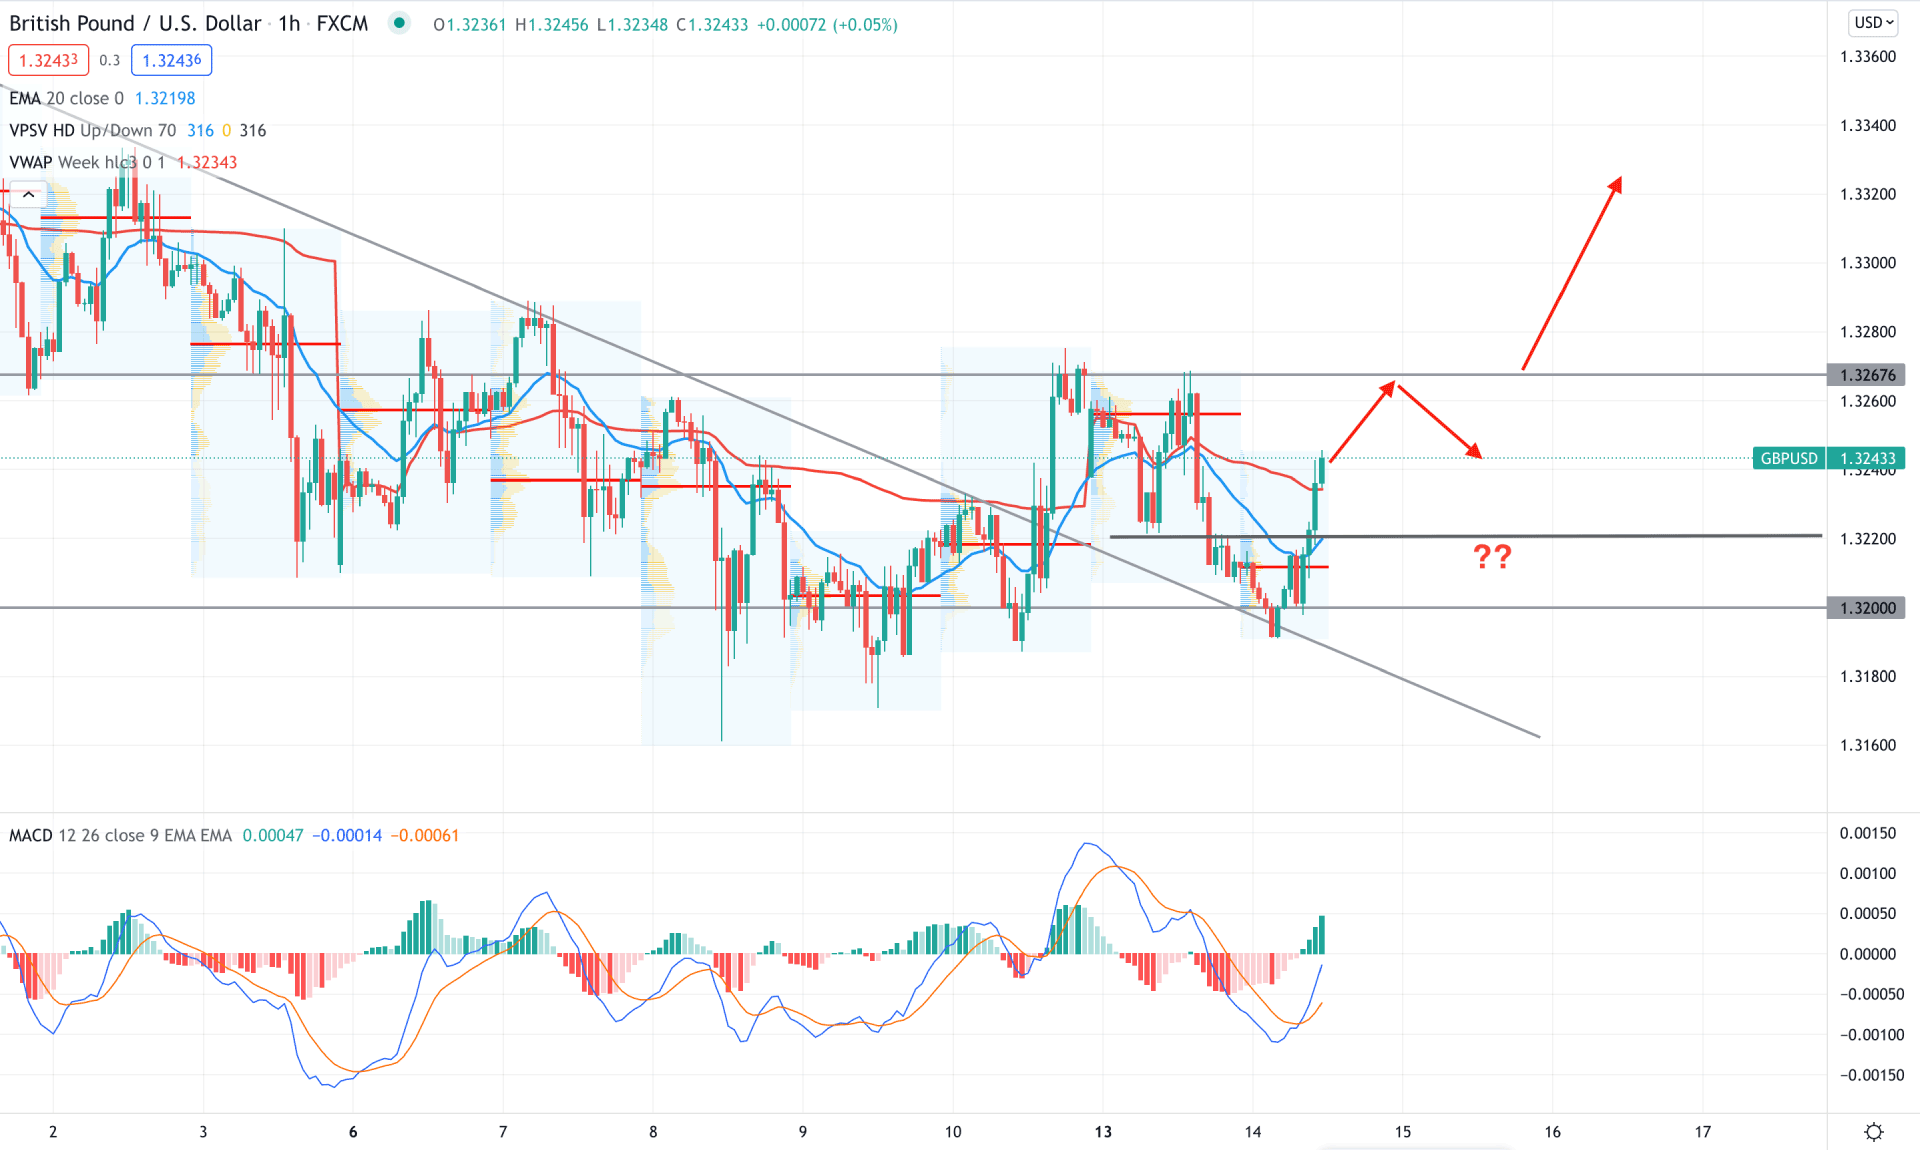
In the intraday chart, GBPUSD bulls are aggressive as they pushed the price up above the 1.3220 intraday event level with a bullish H1 close. Moreover, the price moved above the dynamic 20 EMA and weekly VWAP, where the most recent high volume level is below the price.
The above images show how the price shifted the market trend from the 1.3211 high volume level and moved above the dynamic weekly VWAP. However, the current price is still below the 1.3267 intraday resistance level, where an H1 close above this level is essential to consider it as a bullish break of structure.
Based on the h1 context, the buying opportunity in this pair is valid from 1.3240 to 1.3200 level with the target of 1.3400 area. On the other hand, a break below 1.3200 needs additional confirmation from higher time frames to rely on the possible selling pressure.
As of the current observation, GBPUSD bulls are more likely to take the price up towards the 1.3500 area. In that case, any intraday bullish rejection would be a buying opportunity in this pair. On the other hand, if the price returns below the 1.3200 level with a daily close, it would change the market sentiment from bullish to bearish.