
Published: August 7th, 2025
The GBPUSD pair weakened before the Bank of England's (BoE) later-in-the-day interest rate announcement. When the nation's weekly Initial Unemployment Claims are released at the end of the North American session, traders will turn their attention to them.
As expected, the Monetary Policy Committee (MPC) lowered the Bank of England's main base rate from 4.25% to 4.0%. The outlook for inflation in the United Kingdom over the next two years remains under pressure from tariff discussions and the jobless report.
Ahead of additional developments regarding the next chairman of the US Federal Reserve (Fed), traders exercise caution. On Tuesday, US President Donald Trump declared that he will name Kugler's successor and the Fed's chair before the close of the week. The poorer-than-expected labor market report has increased predictions that the US Fed will implement a 25 basis point rate drop in September, although market sentiment is still cautious.
Despite general success, Mary Daly, president of the Federal Reserve Bank of San Francisco, stated on Wednesday that the Federal Reserve still has some ground to cover in its battle against inflation pressures. Daly emphasised that without knowing the whole picture, the Fed might have to take action quickly.
Furthermore, Lisa Cook, a member of the Fed Board of Governors, and Susan Collins, the president of the Boston Fed, issued a warning that ongoing uncertainty continues to be a significant barrier to efficient policy transmission.
Let's see the further outlook from the GBPUSD technical analysis:
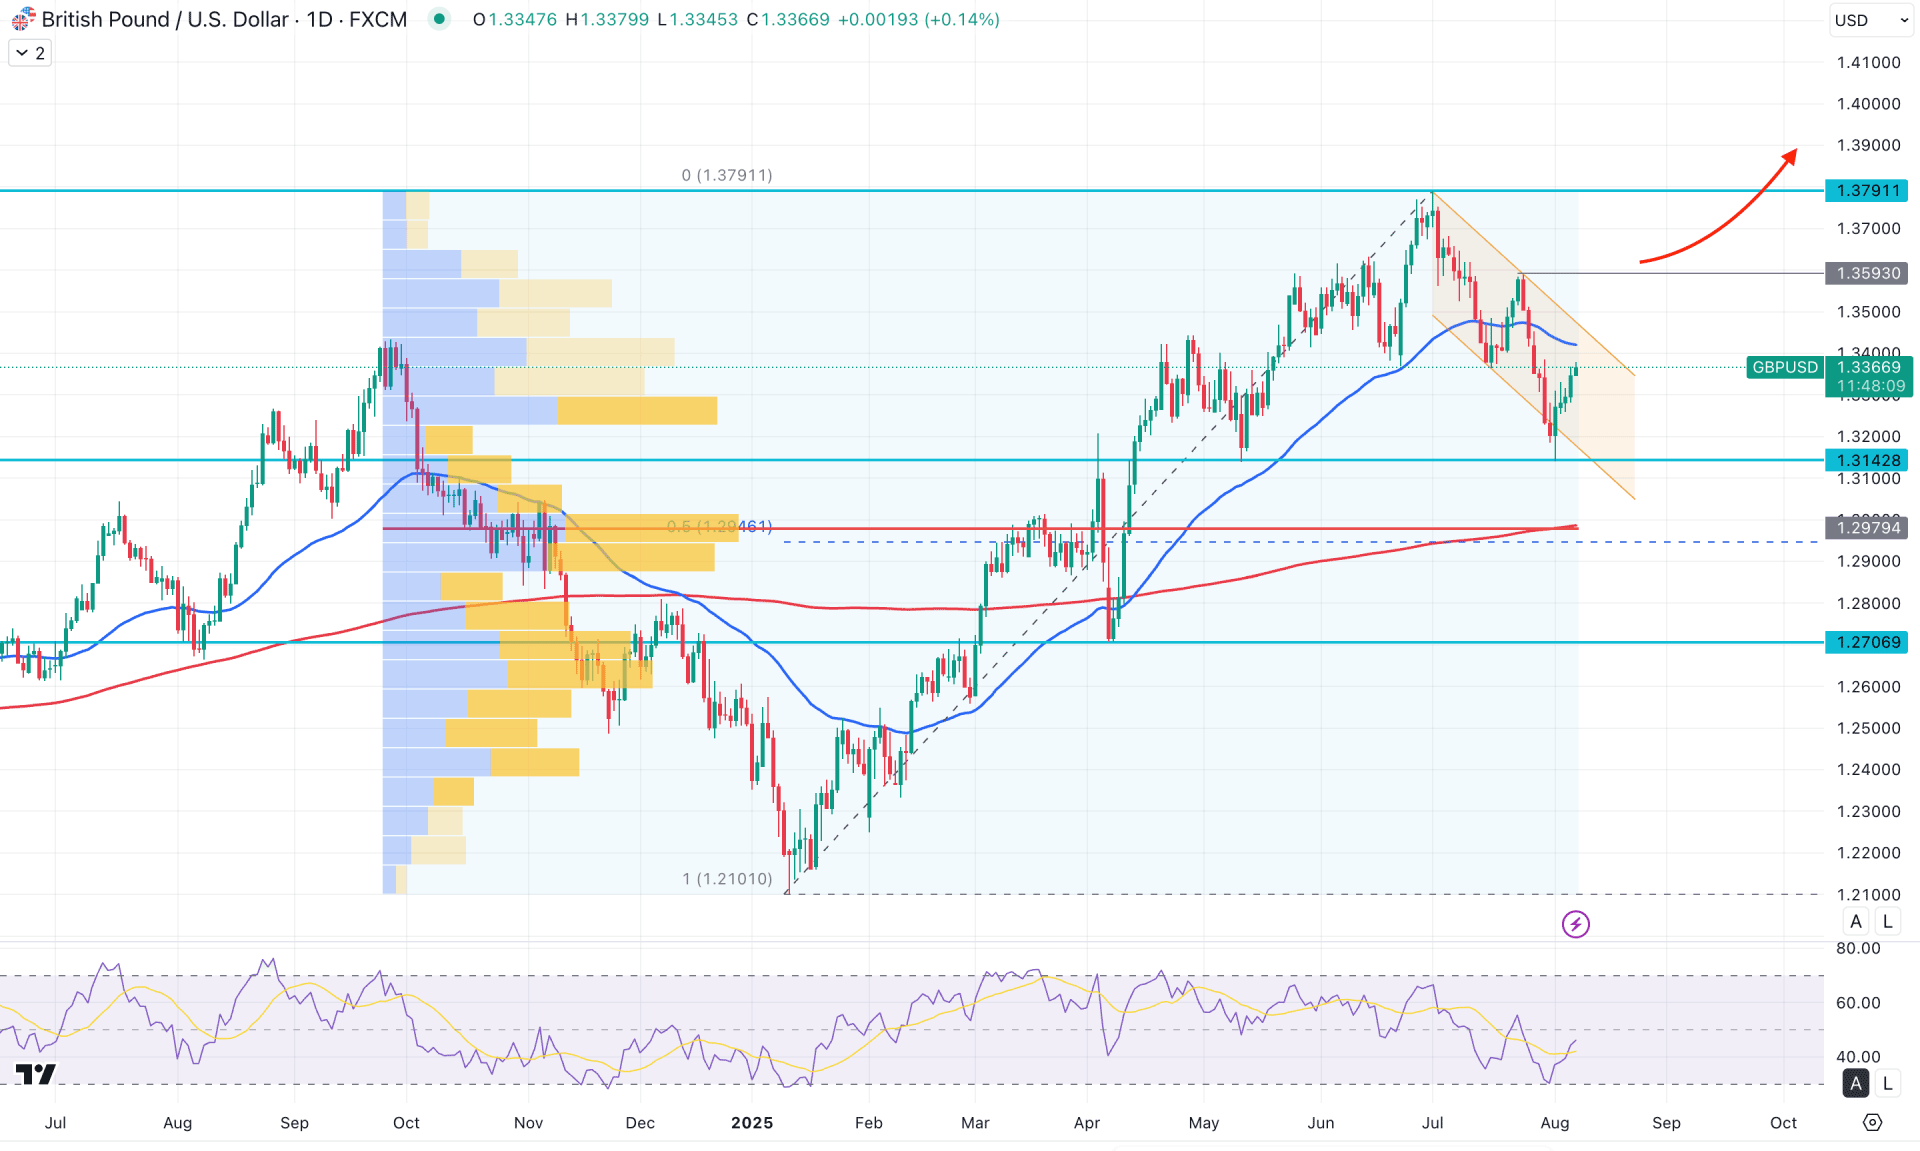
In the daily chart of GBPUSD, an ongoing bullish trend is visible, as the most recent price action is still maintaining momentum from the yearly opening. Although a minor downside correction is evident from the 1.37912 level, the major market structure remains bullish.
In the higher timeframe, the buying pressure appears questionable, as the latest monthly candle closed with a bearish engulfing bar following five consecutive bullish candles. However, the current price is still holding above the July 2025 low, suggesting continued buyer presence. On the weekly chart, signs of exhaustion are visible at the top, with an immediate recovery occurring after a weekly close below the crucial 1.3370 level. Nevertheless, the current price is struggling to hold below this level, indicating a potential bullish recovery.
In terms of volume, the buying pressure appears solid. The highest activity level since September 2024 is located at the 1.2979 mark, which aligns with the 200-day Simple Moving Average.
On the main price chart, selling pressure found resistance at the 1.3791 level, leading to a bearish break below the 50-day EMA. The current price is trading within a descending channel, with the 50-day EMA acting as immediate resistance.
In the secondary indicator window, the Relative Strength Index (RSI) found a bottom at the 30.00 level and has shown signs of recovery. However, a potential divergence is forming, as the RSI failed to maintain a double-bottom formation at the 1.3142 price level. Additionally, the RSI remains below the neutral 50.00 line, which must be breached before confirming a long entry.
Based on the broader market structure, the price continues to trade within a descending channel, with further downside extension possible as the 50-day EMA remains above the current price. In this case, the 1.3400 to 1.3590 area could act as a resistance zone, with the ultimate bearish target being the 1.3142 level.
On the other hand, an immediate bullish recovery with a breakout above the descending channel could soon open up long opportunities. In that scenario, a stable move above the 1.3593 level is needed before anticipating a bullish continuation toward the 1.3791 resistance level.
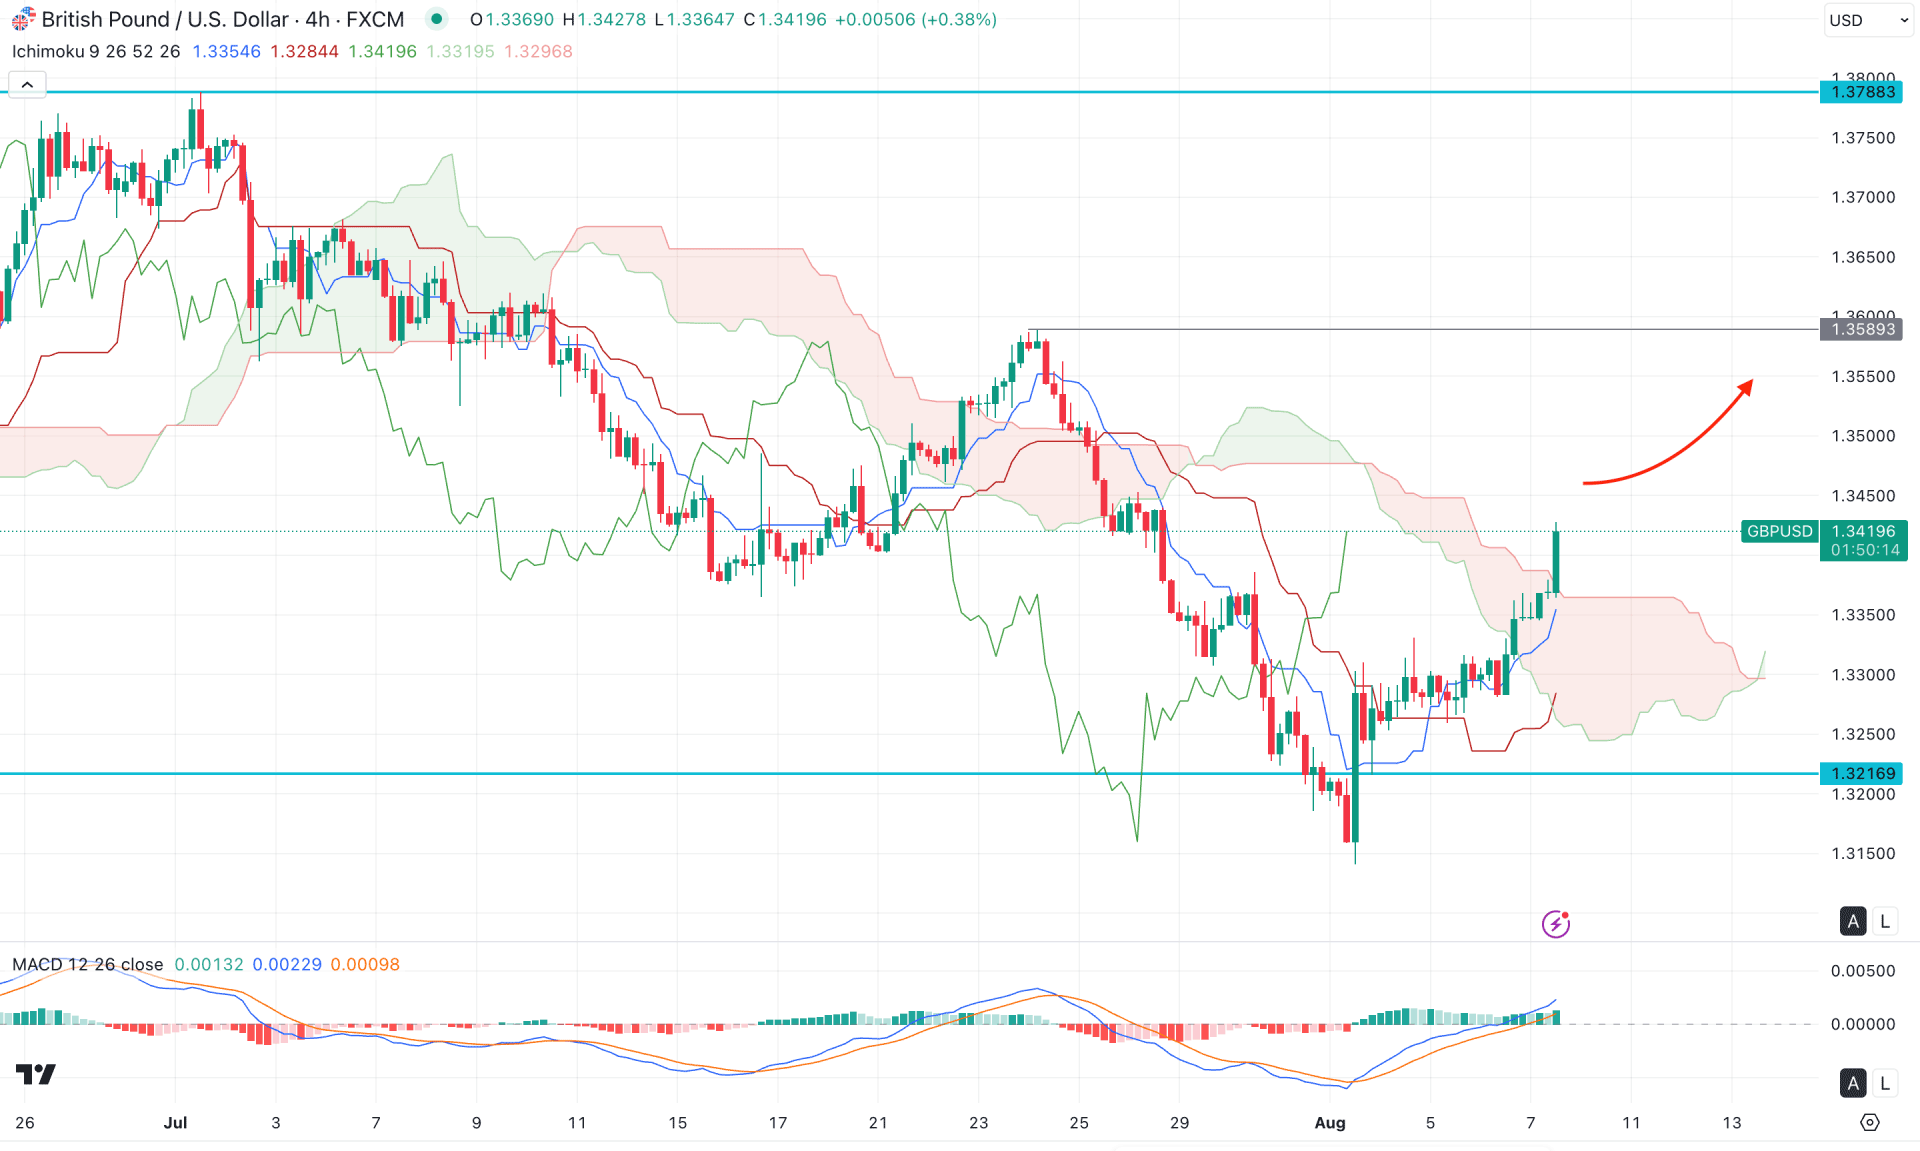
In the four-hour timeframe, the price is trading above the Kumo cloud after two weeks, signaling a potential trend reversal. However, investors should closely monitor the price action around the cloud support, as a consolidation above it could increase the bullish probability.
In other indicators, the future cloud has flipped to a bullish formation, and the Chikou Span is heading upward, suggesting potential bullish continuation. Moreover, the dynamic Tenkan-sen and Kijun-sen lines are positioned below the current price with a bullish slope, supporting the possibility of further upside momentum.
In the secondary indicator window, the MACD histogram has maintained a bullish stance for more than a week, while the signal line has reached the neutral level after bouncing from the bottom with a bullish crossover.
Based on the four-hour outlook, investors might expect the price to extend higher as long as the dynamic support level is protected. In the bullish structure, the ultimate target would be to test the 1.3700 area, while 1.3589 could act as an immediate resistance to watch.
On the other hand, a consolidation below the Ichimoku structure could lower the price toward the 1.3100 level.
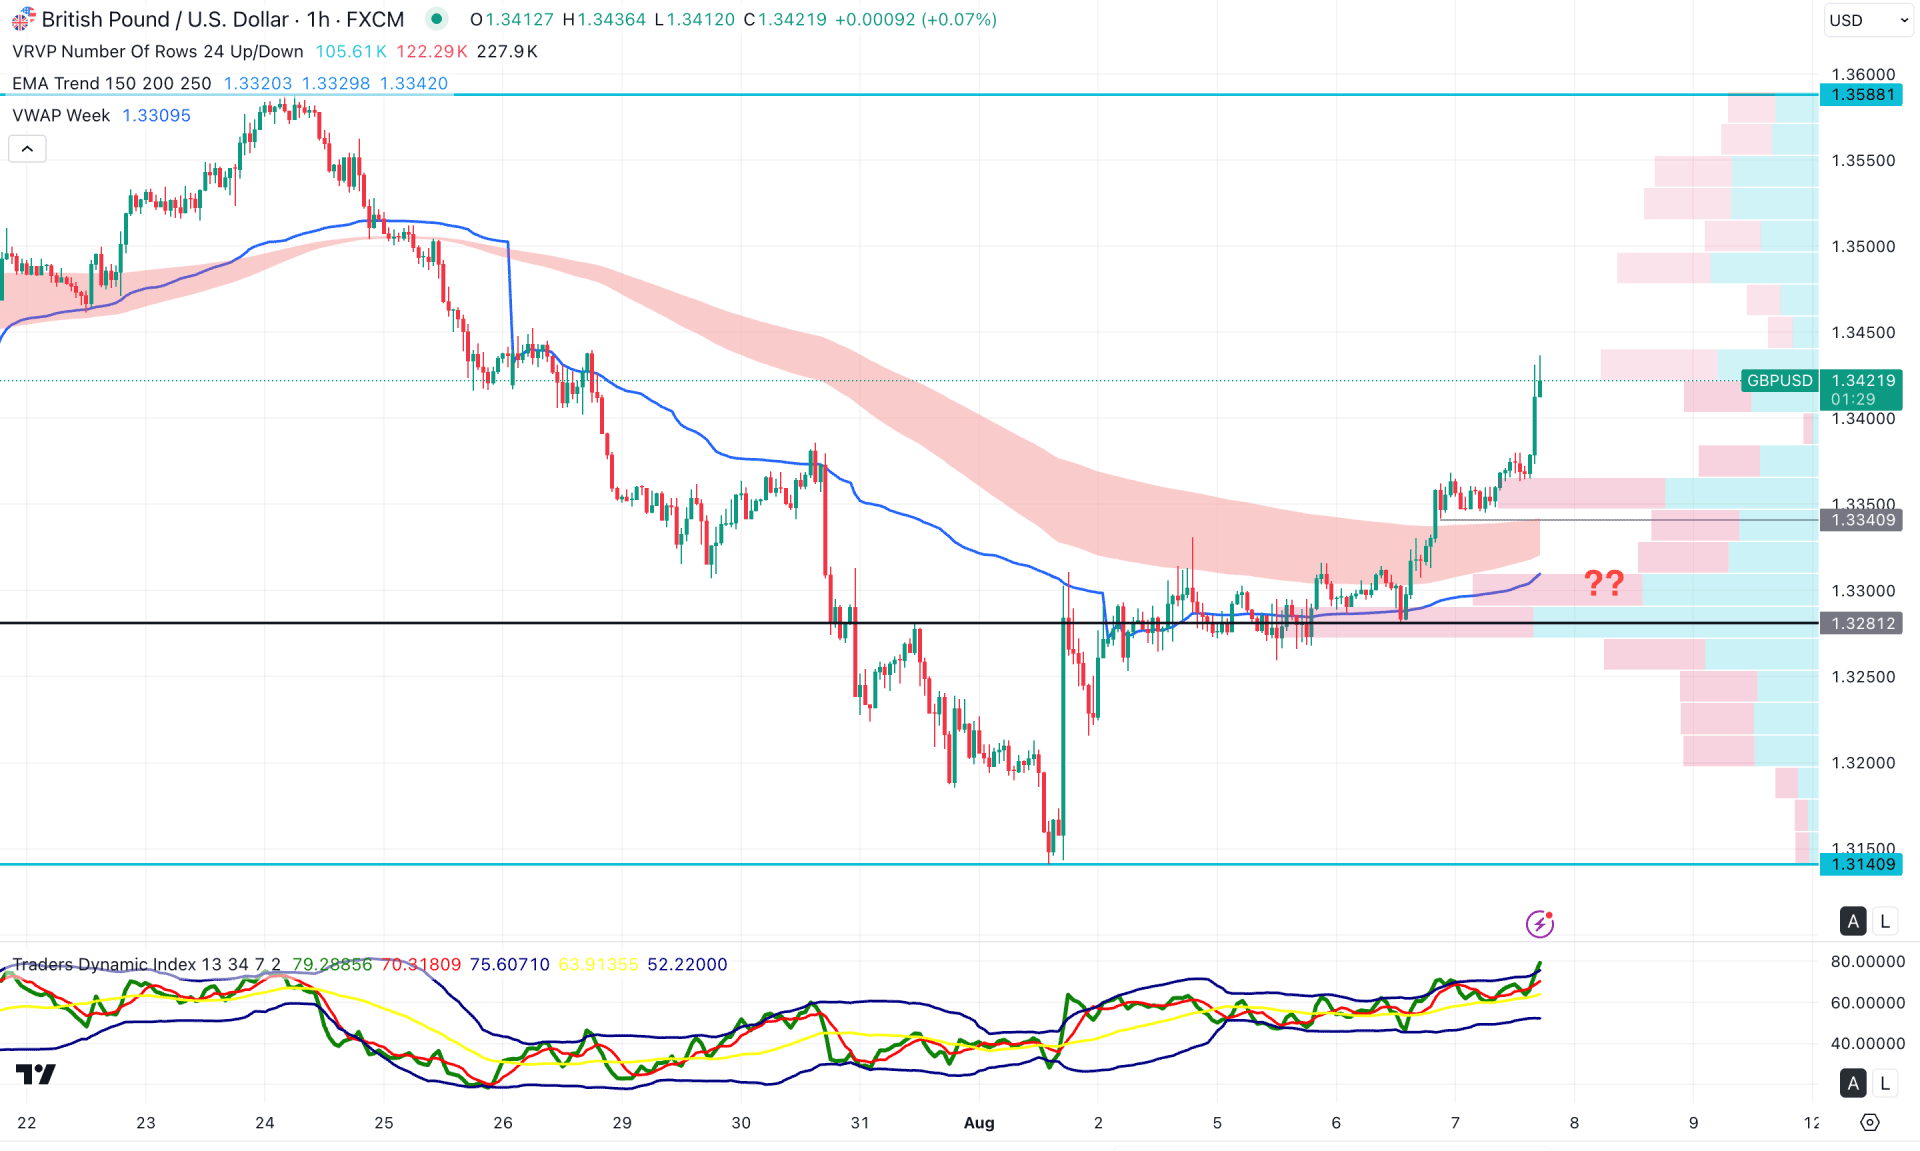
In the given timeframe, the momentum is bullish as the price is trading higher above the Kijun-sen dynamic line. The visible range high-volume node is at the 1.3281 level, which is acting as a major flip point. Primarily, the bullish continuation is likely to extend as long as the price trades above this high-volume level.
In the indicator window, the Traders Dynamic Index (TDI) is at the upper peak, suggesting a possible top formation. However, there is no divergence with the price swing, which indicates the need for additional confirmation before anticipating any short opportunity.
Based on this outlook, the market momentum has shifted from bearish to bullish, as the price is now trading above the dynamic VWAP. However, the price appears overextended above the near-term high, which may require a sufficient downside correction before initiating a stronger bullish move. In that case, investors should monitor how the price reacts after entering a consolidation phase near the EMA. The immediate resistance is located at the 1.3588 level, which could serve as the primary upside target.
On the other hand, failure to hold the price above the 1.3300 level could pose a challenge for bulls, potentially extending losses toward the 1.3140 area.
Based on the broader market outlook, GBPUSD is more likely to extend the current bullish trend after forming a solid bottom in that intraday chart. The bullish recovery above near-term resistance levels could signal the end of the profit taking, from where the price is likely to continue to move higher.


