
Published: March 21st, 2023
The GBPUSD pair fell from its Monday of approximately 1.2285 to the lower and traded sideways on Tuesday, snapping a three-day winning streak.
This drop was caused by the US Dollar (USD) regaining positive momentum due to a recovery in US Treasury bond yields. It reversed some of the overnight losses to a five-week low. Despite market forecasts of a 25 basis point rate hike at the Fed's two-day policy meeting on Wednesday, the potential of a less aggressive policy tightening by the Fed could restrict the USD's upside.
Investors are eagerly watching the accompanying monetary policy statement and Fed Chair Jerome Powell's post-meeting comments for indications of the Fed's future rate-hike path. In particular, investors will monitor in light of the failures of two mid-size US banks, Silicon Valley Bank and Signature Bank. The Bank of England (BoE) policy meeting will also have a significant impact on the direction of the GBPUSD pair.
Despite this, a generally upbeat tone may deter traders from wagering too heavily on the safe-haven USD, giving the major some support. Traders are also searching for short-term chances in the release of US Existing Home Sales data and important central bank event risks.
Let’s see the upcoming price direction from the GBPUSD technical analysis:
In the higher timeframe price action, the broader outlook is strongly bullish as the price is making higher highs with three consecutive bullish weekly closes. Moreover, the current price is still above February 2023 low, with a bullish spike on the monthly candle.
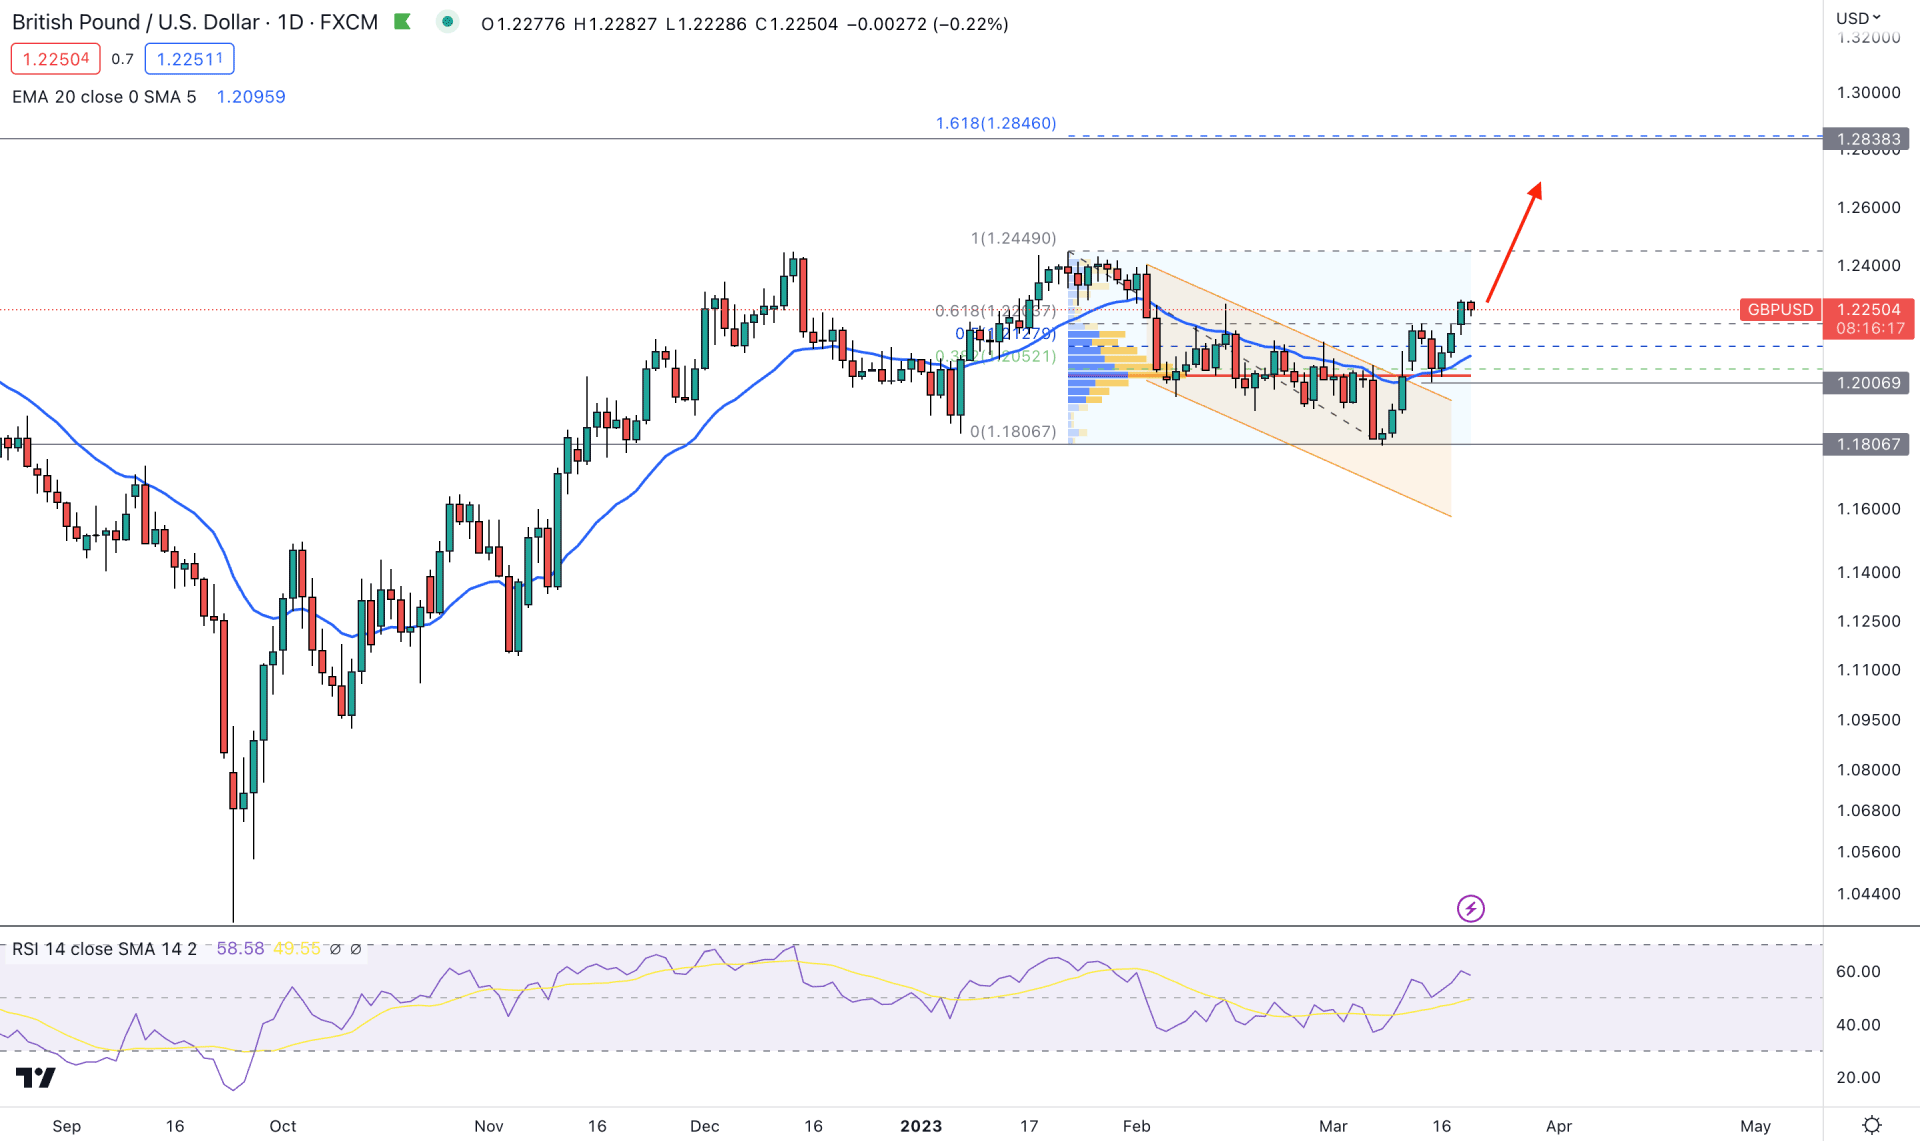
The daily price shows a better version of the buying momentum, where the current price made the descending channel breakout with an impulsive bullish pressure.
If we draw a Fibonacci Extension from the February high to the March low, the 161.8% extension level will come at the 1.2838 level, which would be the primary target of this bull run. Moreover, institutional investors are interested in buying this pair as the current high volume level from February to March is at 1.2031 level, which is below the current price.
The realistic view of this pair should come from the tradable range, where the bottom of the range would be at the 1.1806 level. A strong sell-side liquidity grab happened from this low, which created buying pressure with an impulsive momentum. On the upside, a similar but weaker formation is seen from the 1.2449 level, from where a bearish downside pressure came with a corrective momentum. As the current buying pressure is stable and the price just stepped into the premium zone, more upside pressure may come at any time.
The primary price chart shows a short-term trader's interest from the dynamic 20 DMA level, below the current price. The Relative Strength Index (RSI) shows the same story, where the current level is stable above the 50.00 level, aiming for the overbought 70.00 area.
Based on the daily outlook, the broader market direction is bullish, and any intraday buying possibility could provide a highly probable trading opportunity. Based on this tradable range, the descending channel breakout could lift the price towards the 1.2449 level, from where a downside pressure may come.
On the bearish side, a strong bearish daily candle below the high volume 1.2031 level is needed before aiming for the 1.1806 level.
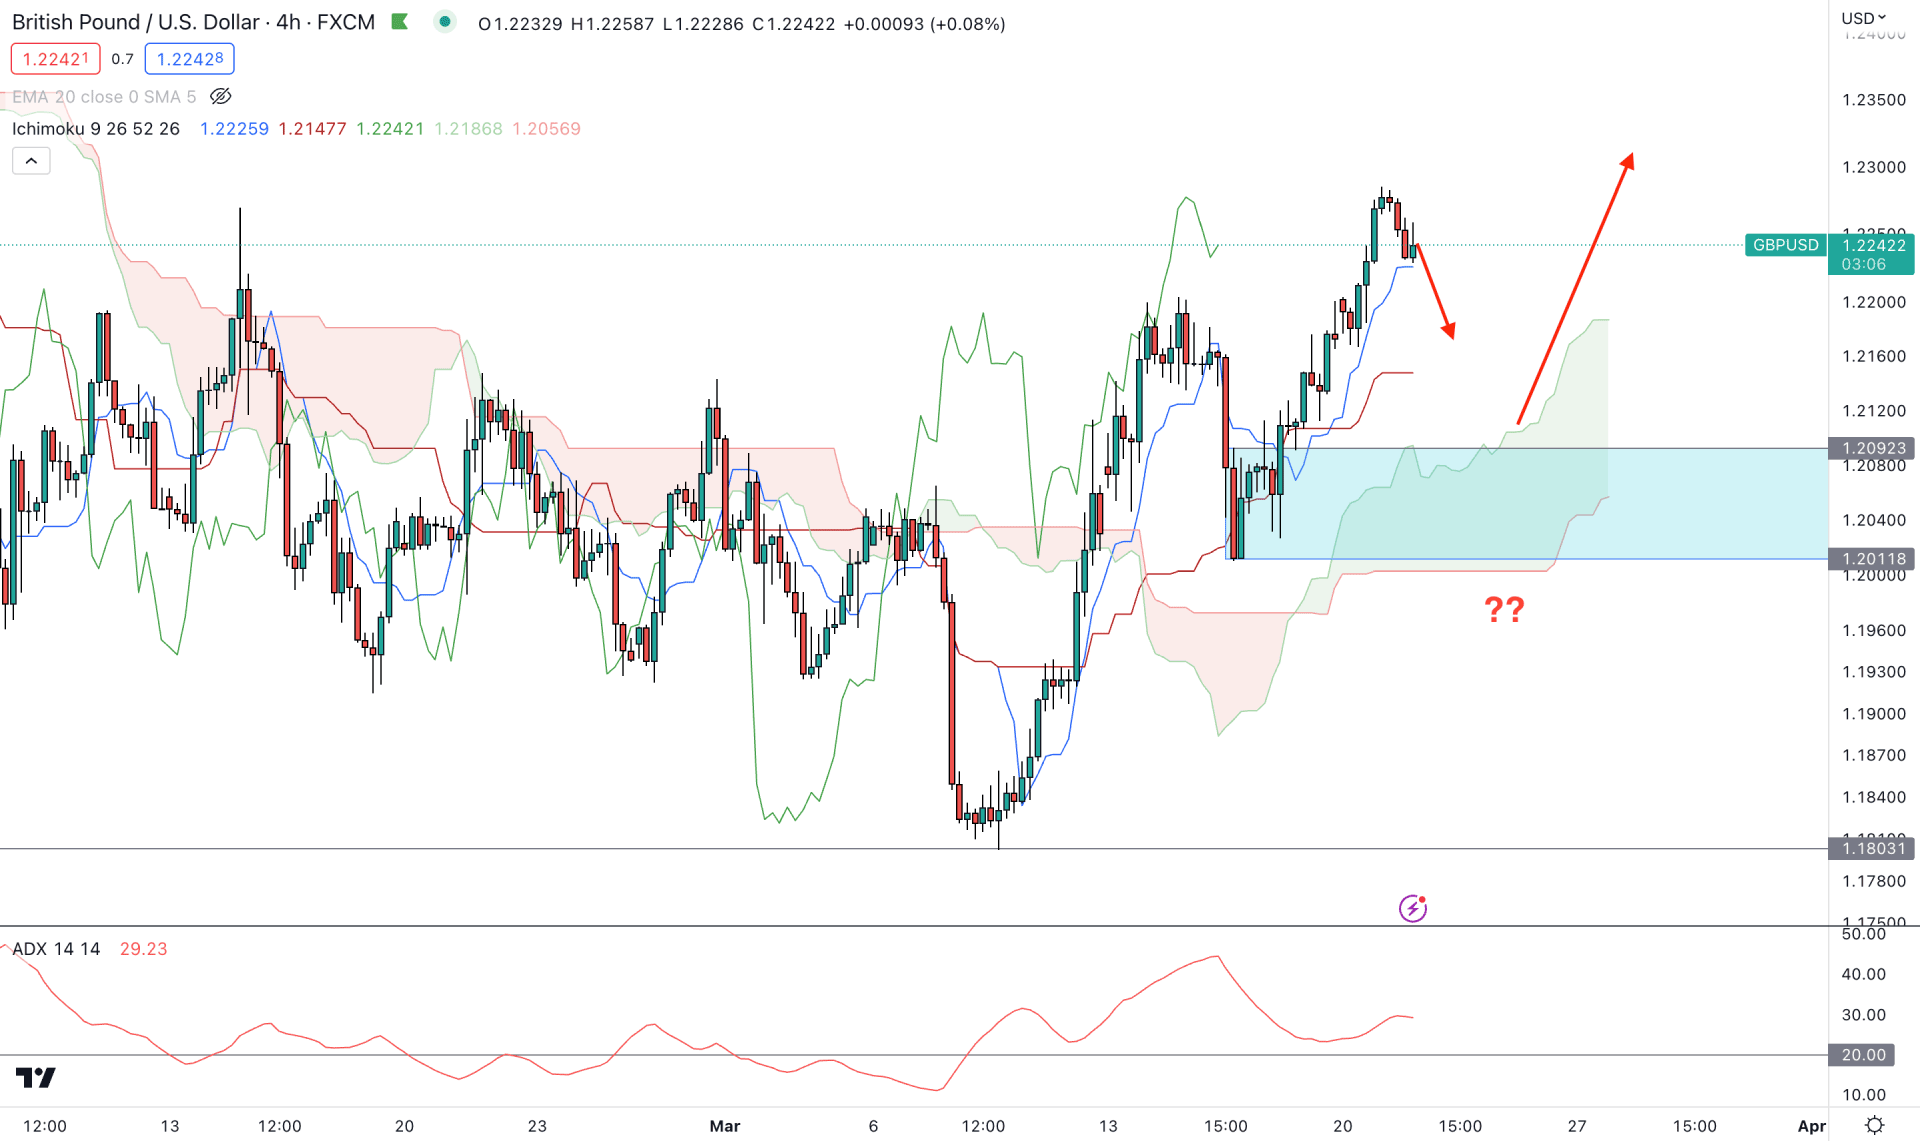
In the H4 chart, a strong buy-side pressure with a stable market above the Ichimoku Kumo Cloud is seen. The primary momentum came after the bullish break of structure above the 1.2143 swing high. After that, a strong downward pressure came but failed to extend the momentum below the Kumo Cloud. As a result, a bullish Rally-base-rally formed in the H4 chart, opening the possibility of a strong bullish trend continuation.
In the future cloud, the structure is bullish from Senkou Span A and B’s position, while the current ADX shows a strongly trending market.
Based on this structure, some bearish correction may come, where any bullish rejection from the dynamic Kijun Sen or 1.2092- 1.2011 area could offer a long opportunity. However, breaking below the 1.2000 level with an H4 candle close could eliminate the buying possibility.
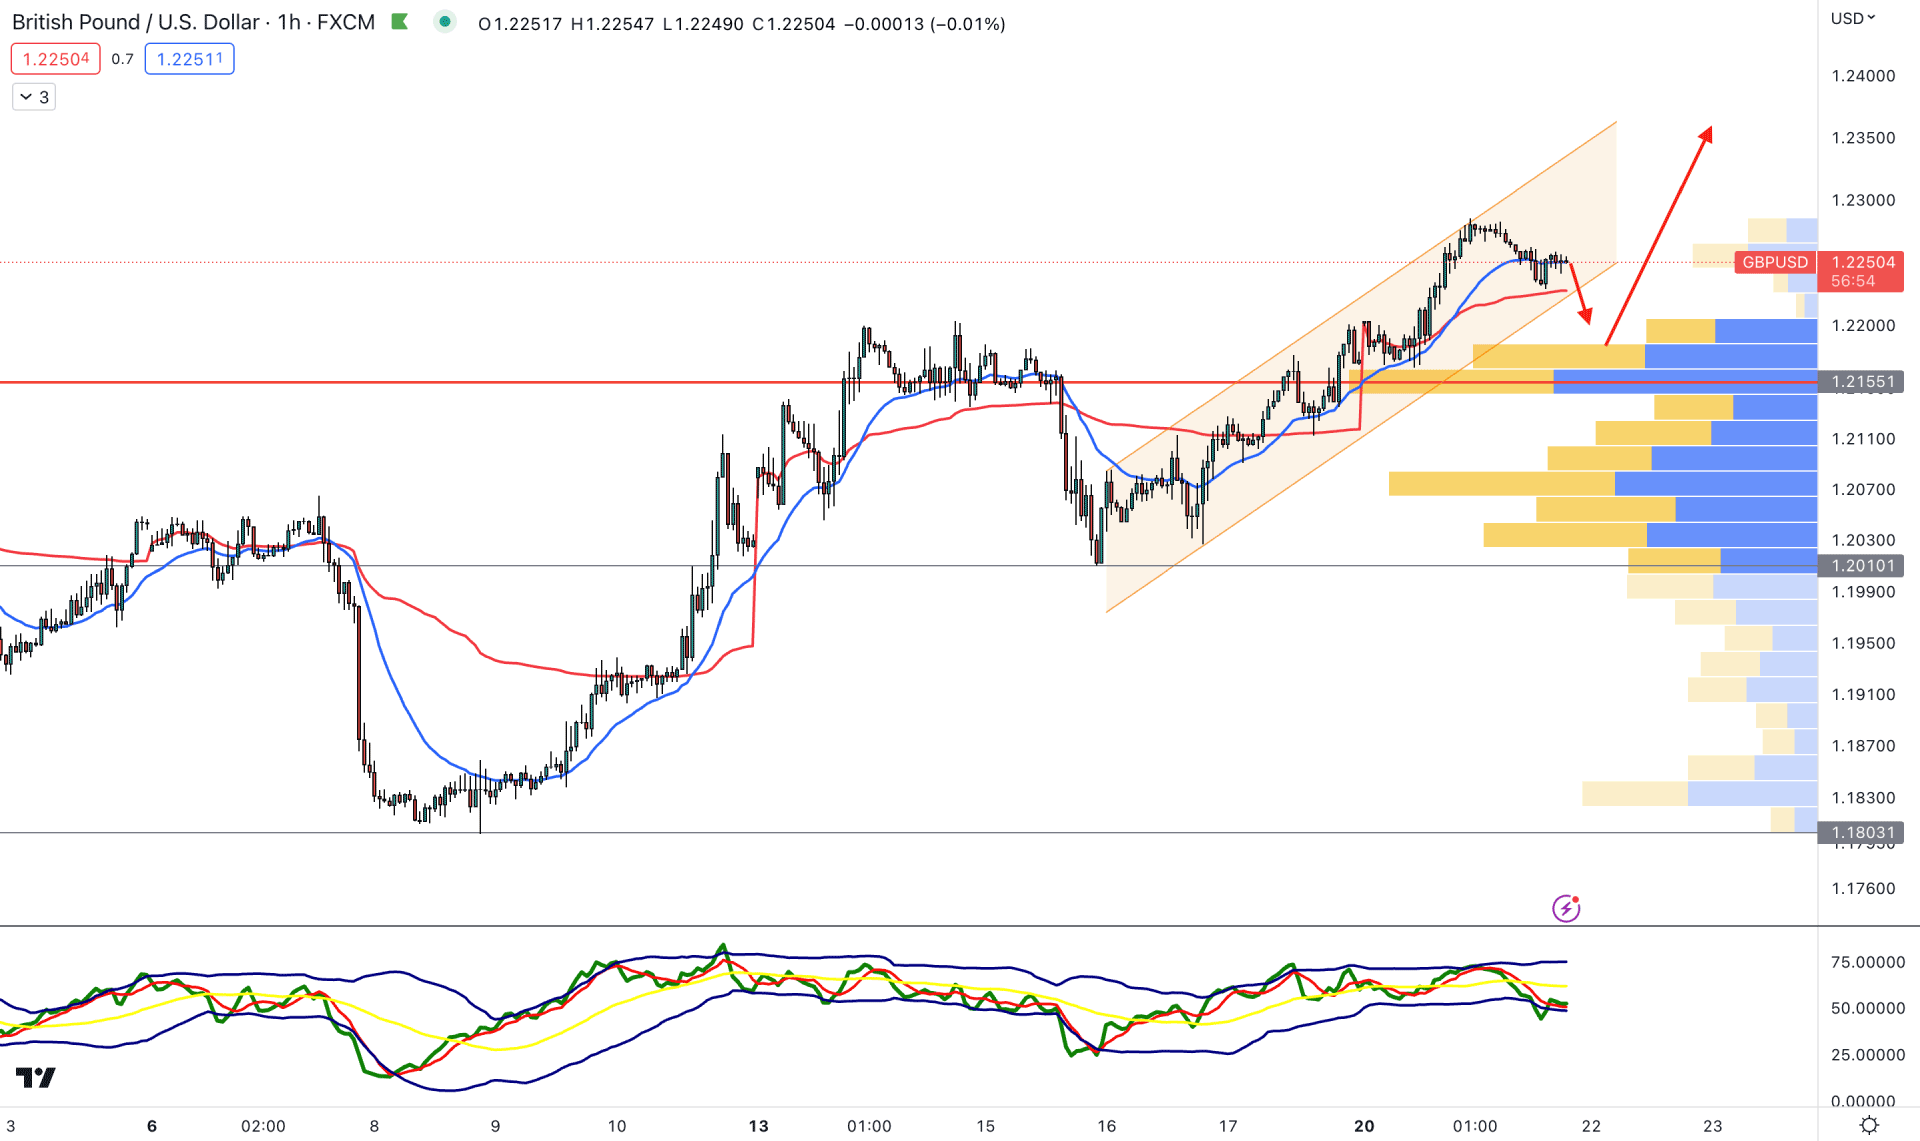
In the H1 chart, the current buying momentum is solid as the visible range high volume level is below the current price.
Moreover, the 20 EMA and weekly VWAP are working as immediate support, while the current price is within an ascending channel formation.
The Traders Dynamic Index (TDI) shows a downside pressure by moving at the lower band, from where a bullish recovery is possible.
Based on the H1 structure, the buying possibility is valid as long as the price trades above the 1.2155 high volume level. However, breaking below the 1.2100 level could lower the price towards the 1.2010 support level.
Based on the current price behavior, GBPUSD could extend the momentum towards the 1.2800 area. However, any surprise from the Fed with a hawkish outlook for the US economy could eliminate the buying possibility.


