
Published: October 26th, 2022
BOE Governor Bailey said over the weekend that the next rate hike would be wider than the market expectation. He defined high inflation as the primary reason for a solid reaction in August. GBPUSD jumped up on the market opening and continued toward the 1.13 level.
In September, inflation rose to 10.1% y/y and returned to double-digit from 9.9% y/y in August. The core inflation in the previous month rose from 6.3% to 6.5% y/y. Services and housing saw the largest gain, next to non-alcoholic beverages and food. BOE will continue its rate hike to tame inflation that shatters people's standard of living. However, a full 100bp rate hike possibility is hanging in, whereas the expected rate hike is 75bp.
In the US, building permits increased from 1542k to 1564k, while in August, housing declined from 1566k to 1439k. Since February this year, existing home sales fell to 4710k vs 4780k in the previous month. As we proceed with rate hikes, housing data can only get awkward with mortgage rates increasing over 7%.
Let’s see the future price of GBP/USD from the GBPUSD technical analysis:
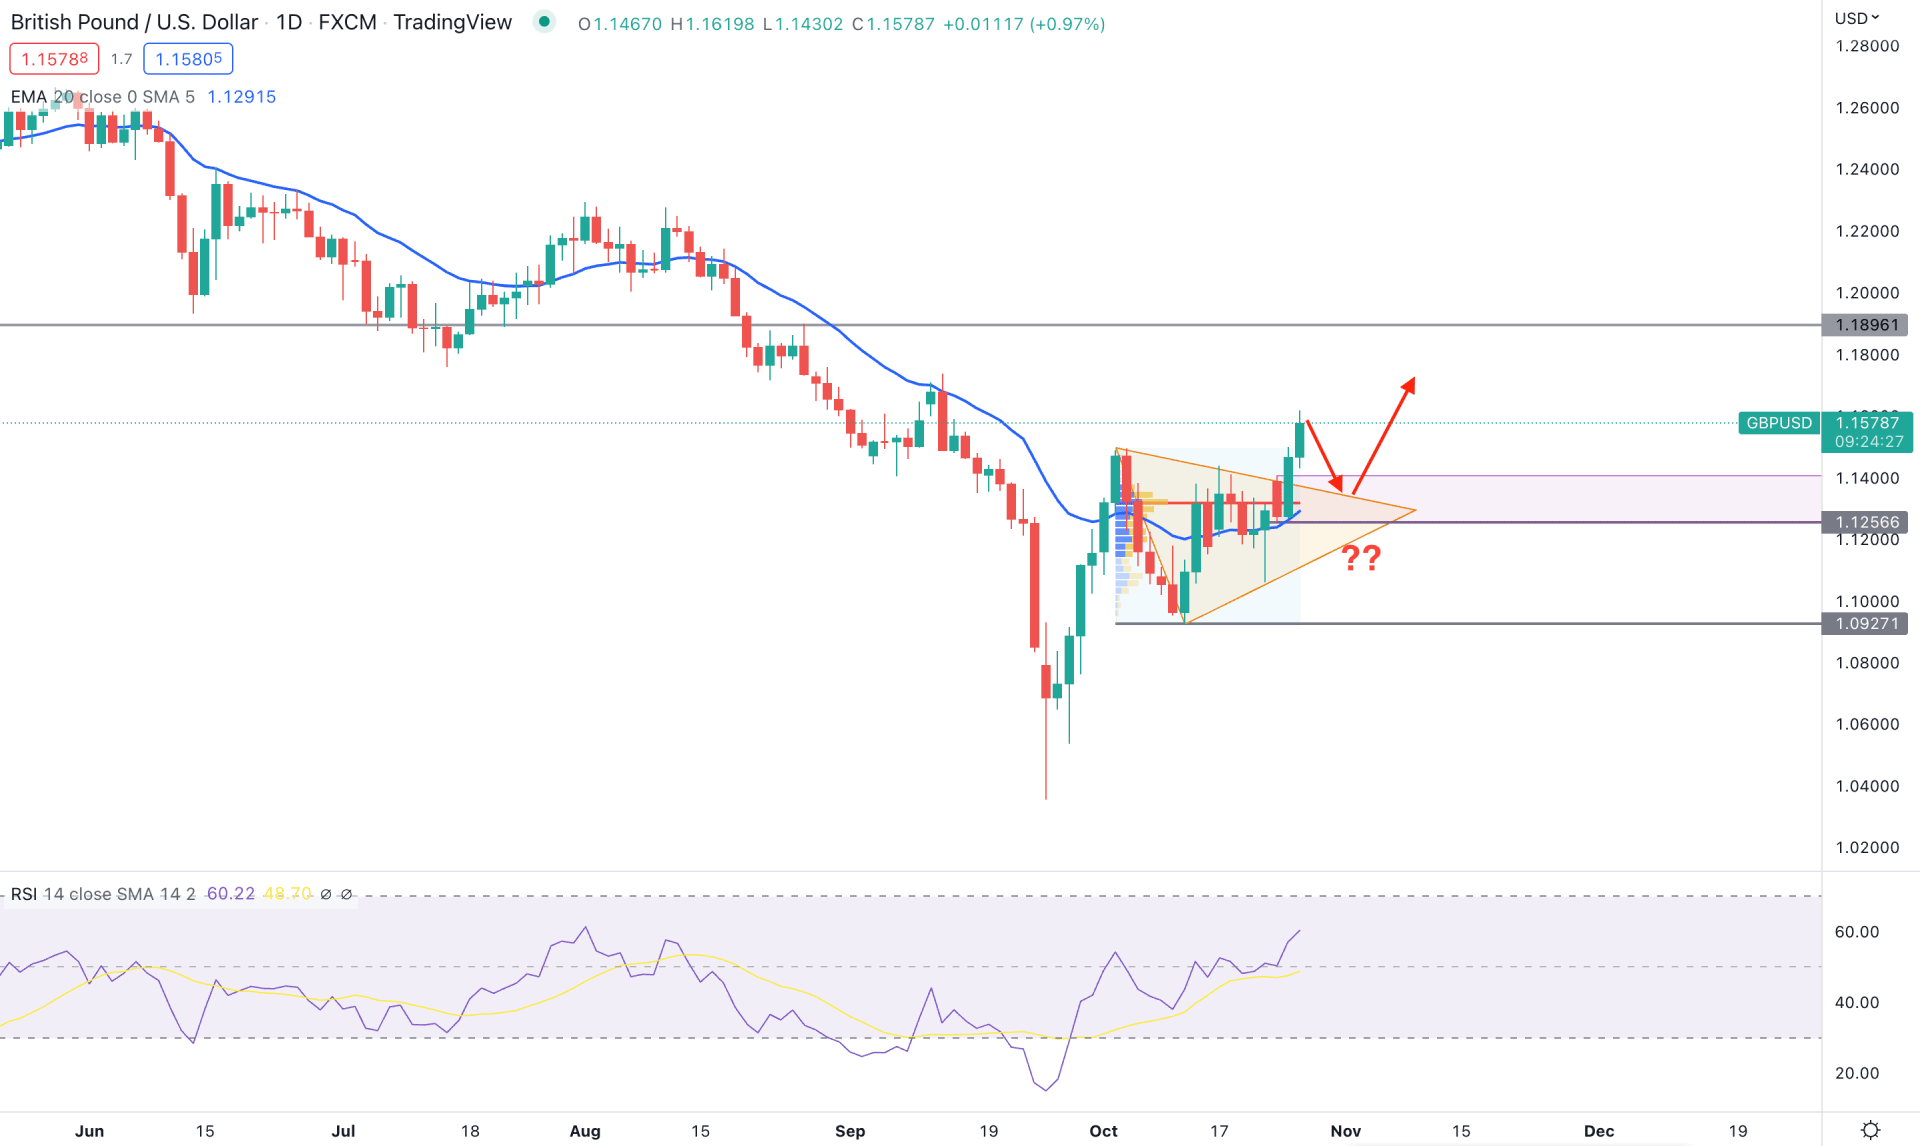
In the daily chart of GBPUSD, there are several signs of a bullish trend reversal as the price formed a strong symmetrical triangle breakout followed by a bullish exhaustion.
After reaching the 1.0361 level, bears have become weaker and rejected a long-wicked candle. It signifies a sell-side liquidity grab from the market before forming a higher high with a trend-reversal possibility. Therefore, the primary trading idea for this pair is to find a bullish opportunity as long as it trades above the 1.0927 key support level.
Based on the fixed range volume indicator from September low to October high, the highest active level is at 1.3235 level, which is below the current price. Moreover, the most recent buying pressure with a Rally-Base-Rally formation indicates a trend continuation possibility toward bulls.
Bulls managed to have a symmetrical triangle breakout with a strong change in volume, which could offer a decent long opportunity in this pair after a considerable correction.
The dynamic 20-day Exponential Moving Average is below the price and working as immediate support. On the other hand, the indicator window shows a buying pressure where the RSI is rising above the 50% area, nearing the 70% overbought zone.
Based on the daily price prediction for GBPUSD, the primary aim is to look for a bearish correction. However, a buying pressure in the daily chart from 1.1400 to 1.1256 area could offer a long opportunity, where the main aim is to reach the 1.2000 key resistance level.
The alternative trading approach is to find the price below the 1.250 level and form a bearish D1 candle in that case, sellers may dominate the market by taking the price below the 1.0600 area.
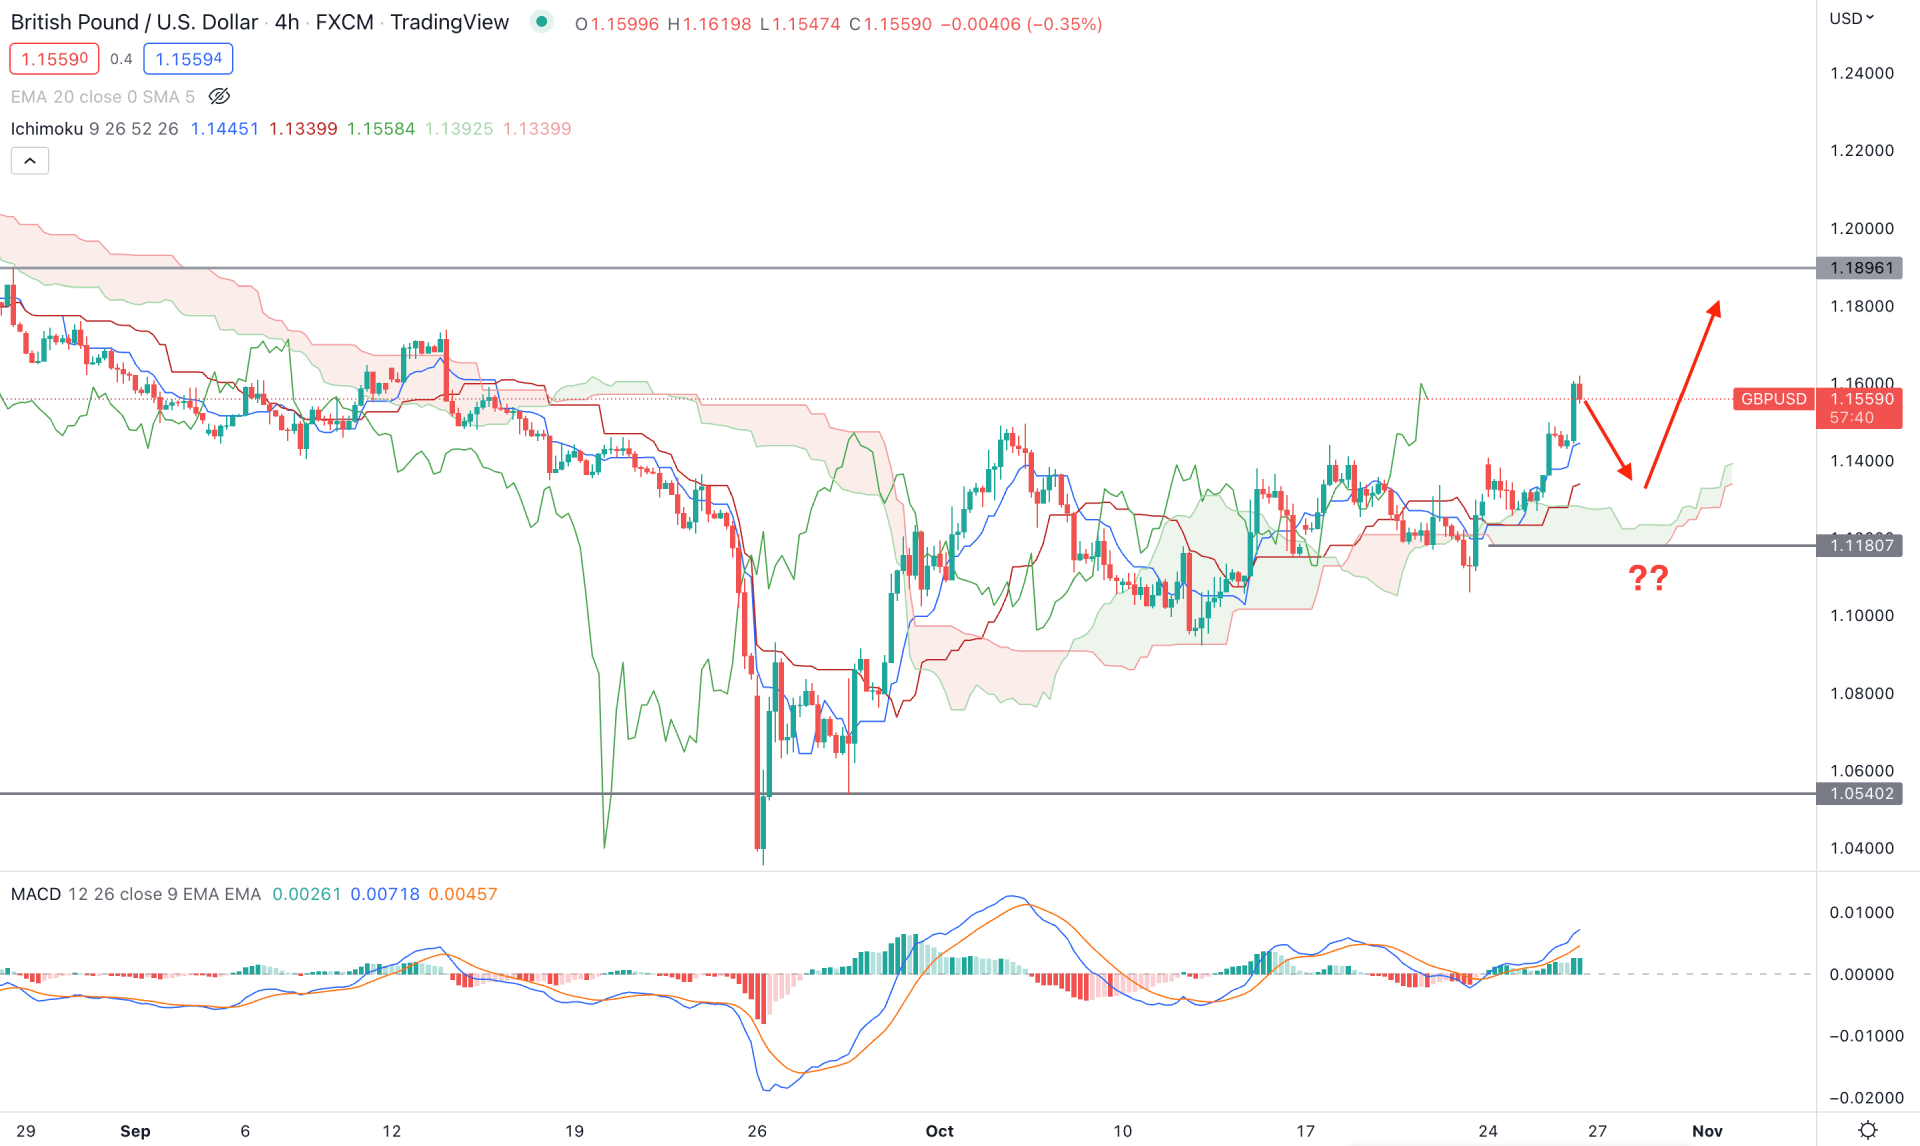
In the H4 timeframe, the broader outlook for GBPUSD turned bullish as the price made multiple higher highs above the Kumo Cloud area.
After forming bullish exhaustion from the 1.5400 area, bulls broke the structure above the cloud resistance before forming a minor bearish correction. Later on, bulls regained momentum and extended the buying pressure by taking the price above the 1.1400 area.
In the future cloud, Senkou Span A and B continue moving higher while the Senkou Span A is higher than B. In the indicator window, the MACD Histogram is bullish for a considerable time while the MACD EMA is above the neutral line.
Based on the current H4 structure, a minor bearish correction is pending in this pair as the gap between the price and Kijun Sen has been extended. In that case, any bullish opportunity from the 1.1420 to 1.1360 area could provide a long opportunity targeting the 1.1896 level.
The alternative approach is to wait for the breakdown of the 1.1180 level before opening a short position, targeting the 1.0540 level.
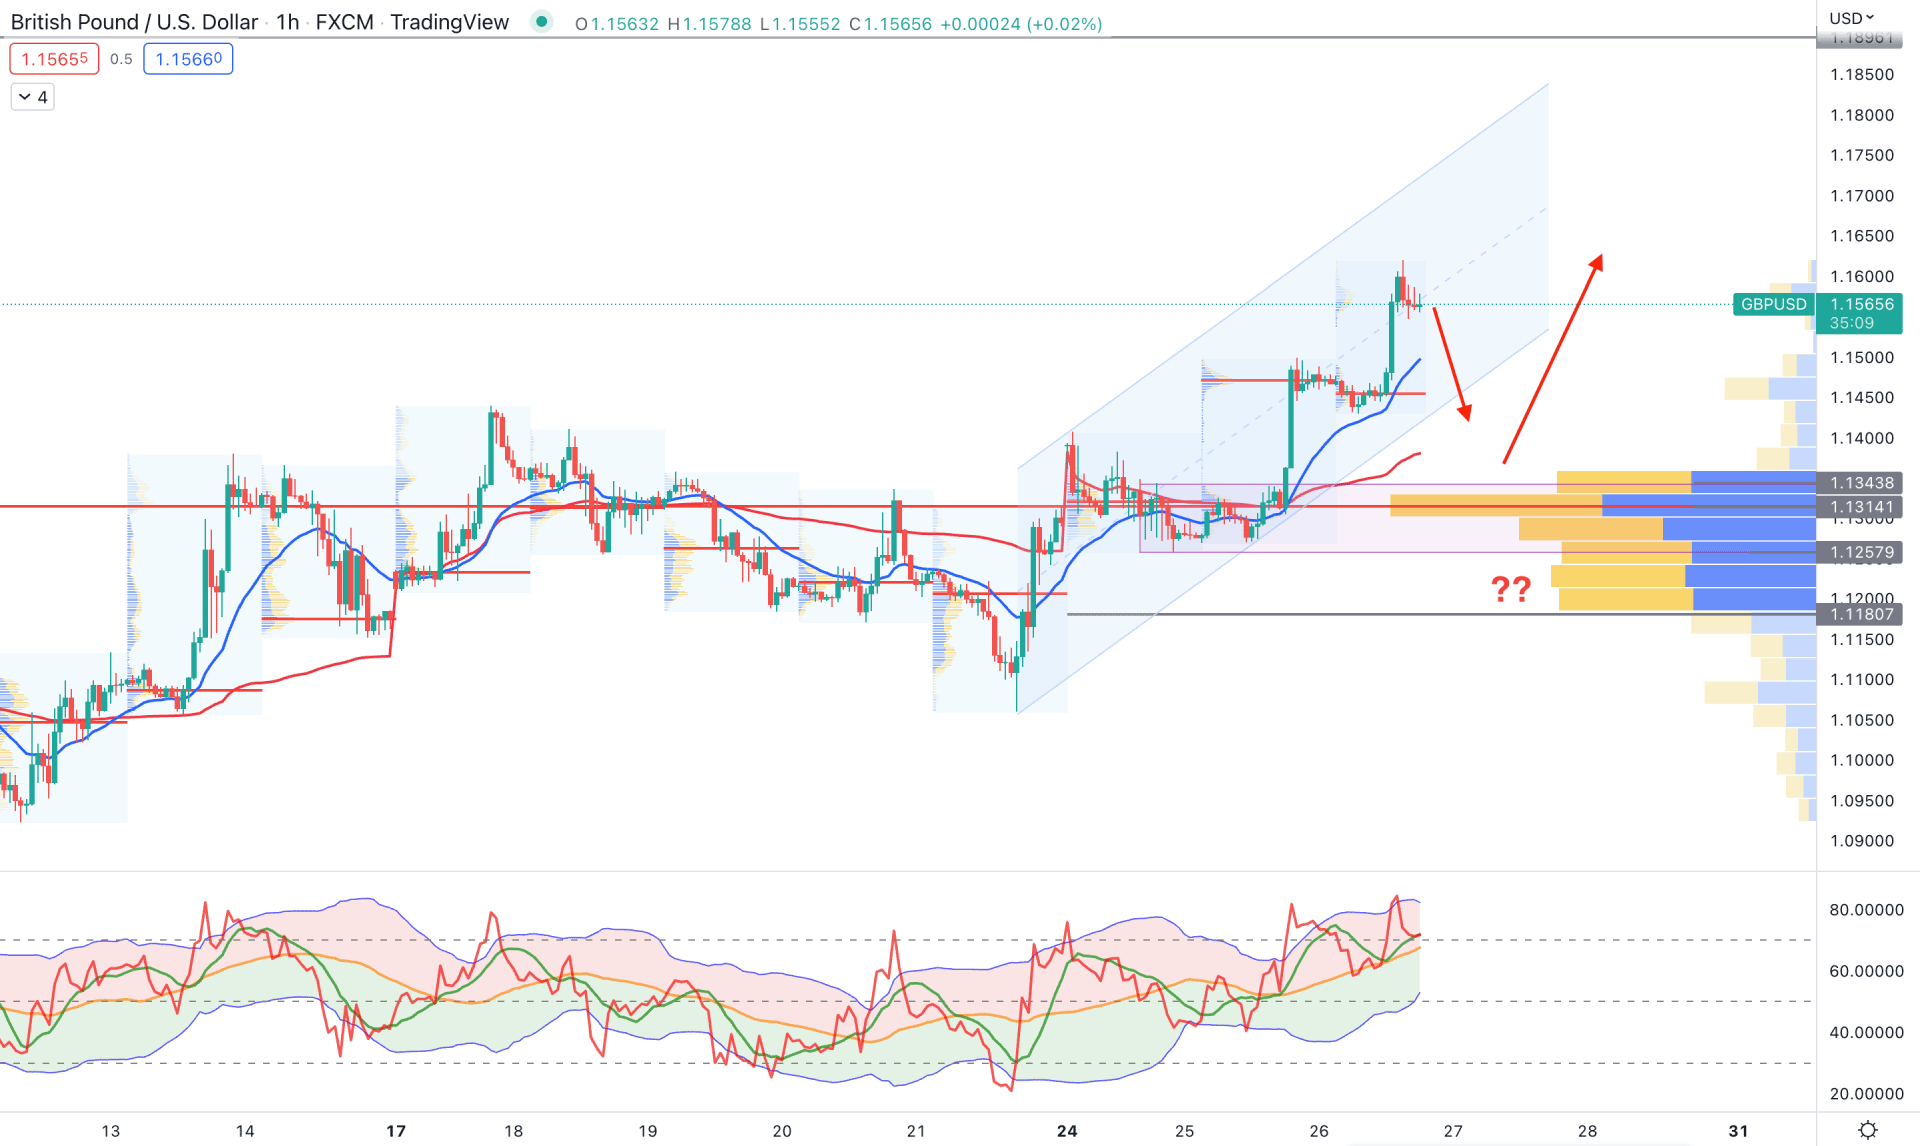
In the GBPUSD H1 chart, the bullish channel has extended with extreme intraday buying pressure during the London session. Therefore, further upside pressure following the long-term trend should come with a minor bearish correction.
Based on the visible range high volume indicator, the highest trading volume is at the 1.1314 level, below the current price. Moreover, the dynamic 20 EMA and weekly VWAP are below the price and working as immediate support levels.
The Trades Dynamic Index indicator also aims higher, where the current TDI level is above the 50% neutral level.
Based on the daily structure, investors should wait for the price to complete the minor bearish correction. Any bullish rejection from dynamic weekly VWAP or 1.1343 or 1.1257 could offer a bullish opportunity.
Based on the current price behavior, GBPUSD bulls may regain momentum once the minor bearish correction is over. In that case, investors should monitor how the price reacts to the triangle support after the breakout.


