
Published: April 23rd, 2026
After the modest recovery in corporate activity, the pound sterling gained strength. In April, a flash Composite Purchasing Managers Index (PMI) increased to 52, significantly higher than the previous reading of 50.3. The improvement is driven by a concurrent acceleration in the service and manufacturing industries. Widespread growth is shown by the Manufacturing PMI rising to 53.6 and the Services PMI reaching 52.
Regarding monetary policy, the Bank of England (BoE) is anticipated to maintain interest rates at 3.75% on this month's decision. Elevated inflation projections driven by rising energy prices are expected to limit the potential for near-term rate cuts.
In a risk-averse atmosphere, the US dollar maintains a somewhat strong tone. The demand for the sanctuary currency is being supported by ongoing conflicts between the US and Iran, particularly along the Strait of Hormuz. The Greenback's popularity is being strengthened by recent military advances and the stagnation of peace talks.
Moreover, the ongoing inflation pressures related to oil prices are influencing the Fed to take a cautious approach despite forecasts for limited rate cuts. Despite encouraging UK statistics, this background still limits the GBPUSD gain.
Let's see the complete price outlook from the GBPUSD price analysis:
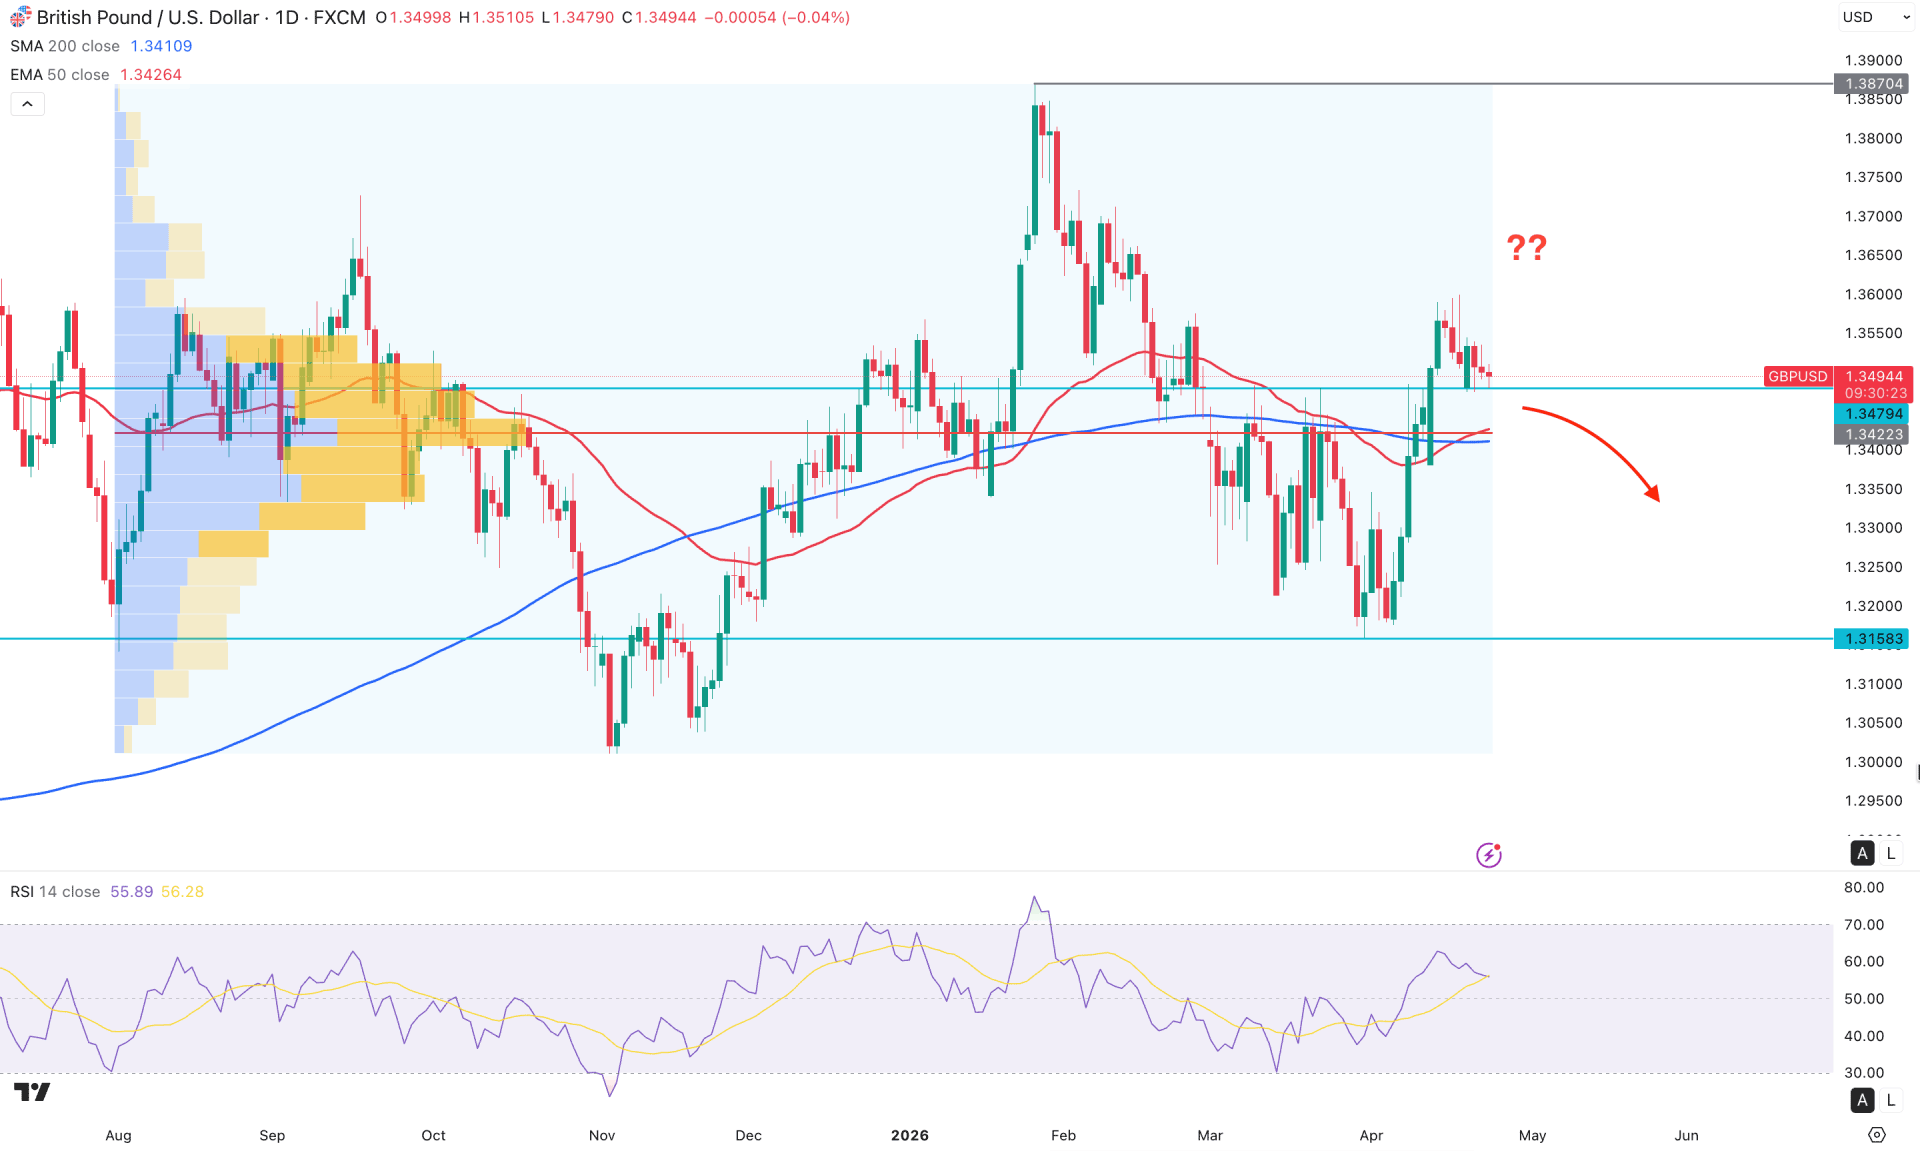
In the daily chart of GBPUSD, the price is trading within a strong bullish trend. The most recent price action shows sideways momentum after a valid descending channel breakout. Although the price is trading above the crucial support level of 1.3422, the corrective momentum could signal an extended bearish possibility.
Looking at the higher timeframe, the price is in a consolidation phase, with no stable market momentum visible on the monthly chart. Also, the price is moving within a rectangle pattern backed by a strong bullish trend, which is a positive factor for bulls.
In the volume structure, the largest activity level since August 2025 is below the current price, suggesting institutional buying pressure.
The 200-day SMA is below the current price, which signals a major bullish trend. The 50-day EMA is also having a bullish slope, suggesting a confluence of buying pressure. However, the price action above the 1.3422 level came with limited bullish momentum, suggesting a possible bearish correction.
In the indicator window, the Relative Strength Index is above the 50.00 neutral line, which is a positive factor for bulls. Moreover, the RSI has room to move toward the 70.00 overbought level, which could act as a confluence bullish factor.
However, the strength of the trend appears weaker, as the current ADX level is hovering around 20.00. In that case, a trend-following opportunity may appear after a valid rebound above the 20.00 level.
Based on the current market outlook, a failure to hold the price above the 1.3422 level could extend downside risk, with immediate support at the 1.3158 level.
On the other hand, a bullish rebound remains possible, as multiple dynamic and static support levels are below the current price. Primarily, a bullish rebound from the 50-day EMA could increase the likelihood of a move toward the 1.3870 key resistance level.
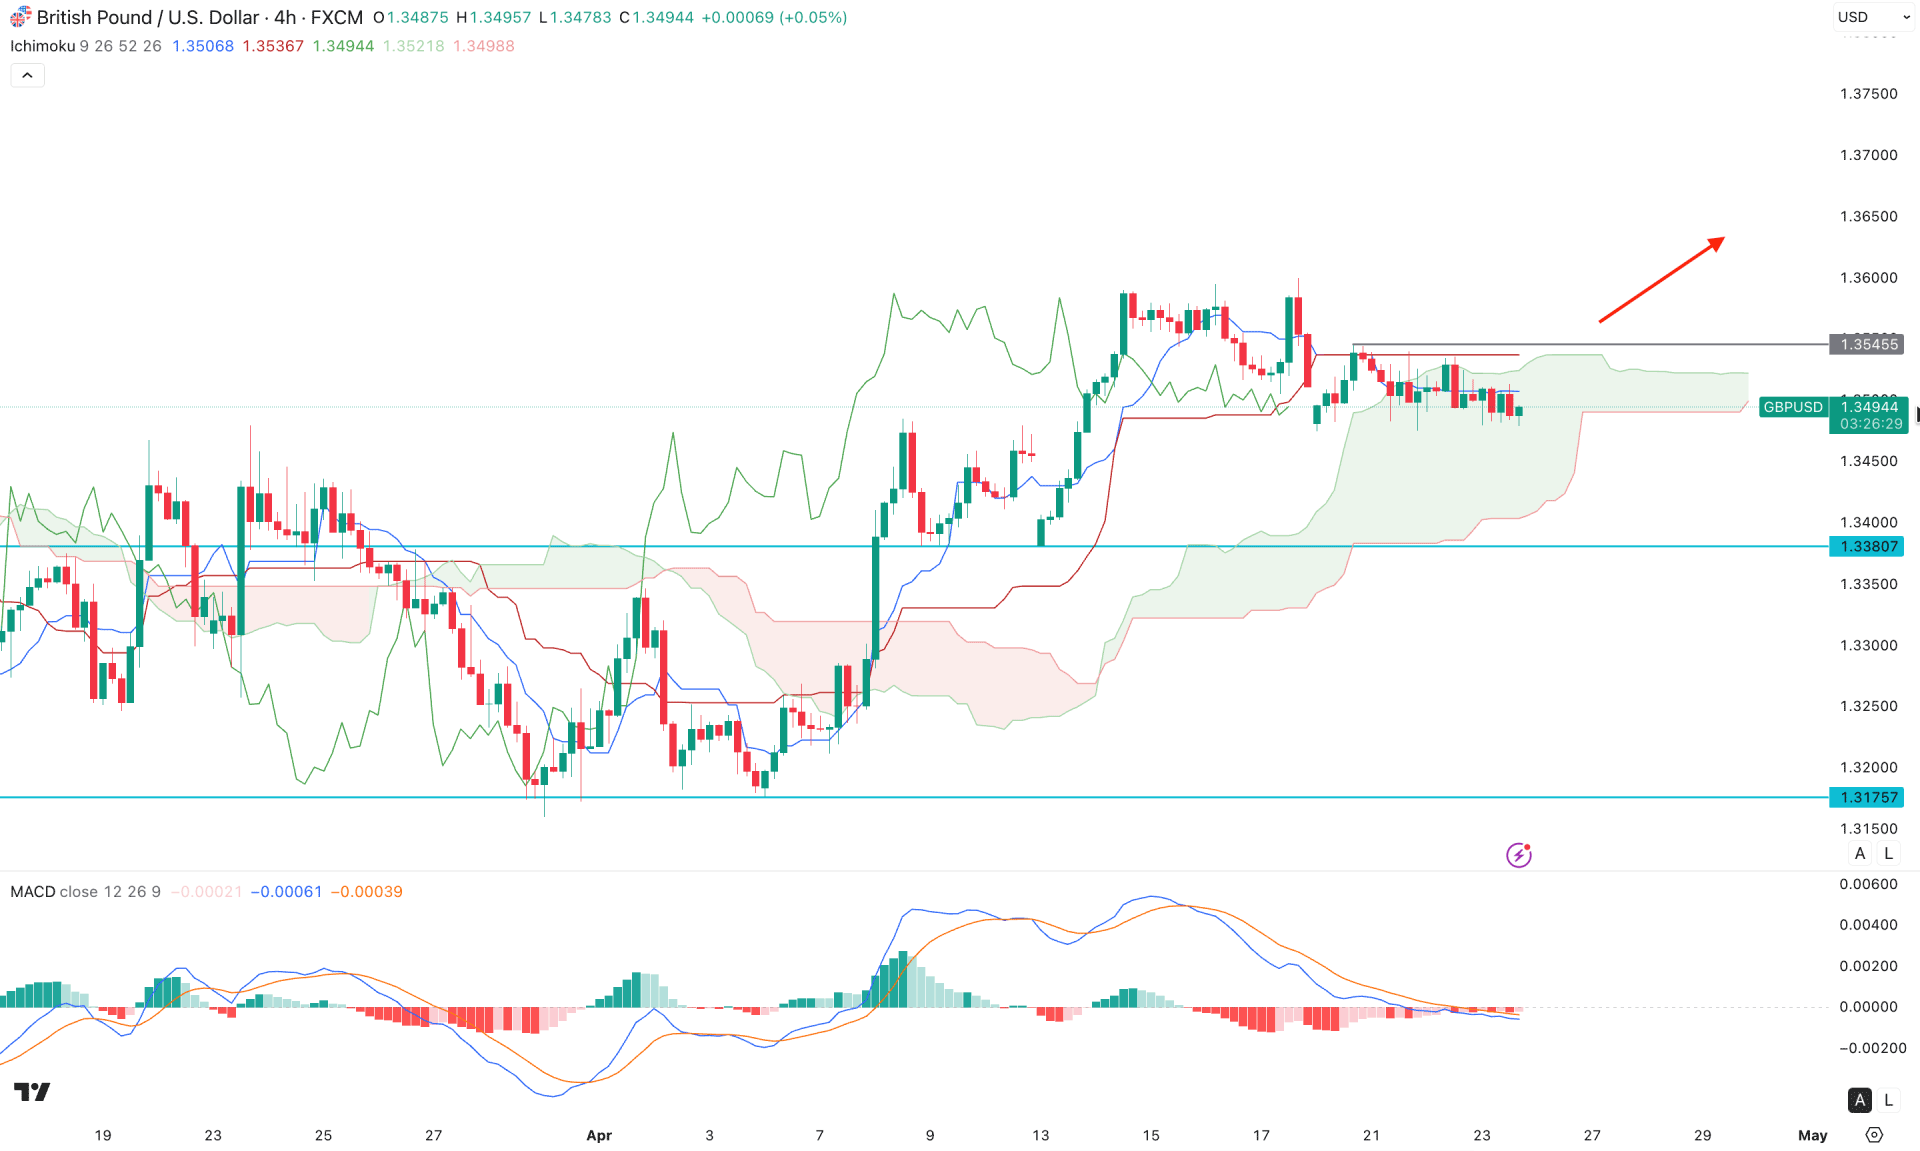
In the GBPUSD H4 chart, multiple swing highs are visible above the cloud area. However, the price formed a peak at the intraday high and initiated a downside correction below the dynamic Kijun Sen level.
In the secondary indicator window, the MACD histogram has reduced its momentum and reached the neutral area. Moreover, the signal line is also near the neutral level, indicating a corrective market pressure.
Based on the H4 market outlook, a long opportunity could come after overcoming the 1.3545 resistance level. As long as the current price remains below the Ichimoku cloud area, the price is likely to test the 1.3380 support level. A break below this line could increase the possibility of testing the 1.3250 key support area.
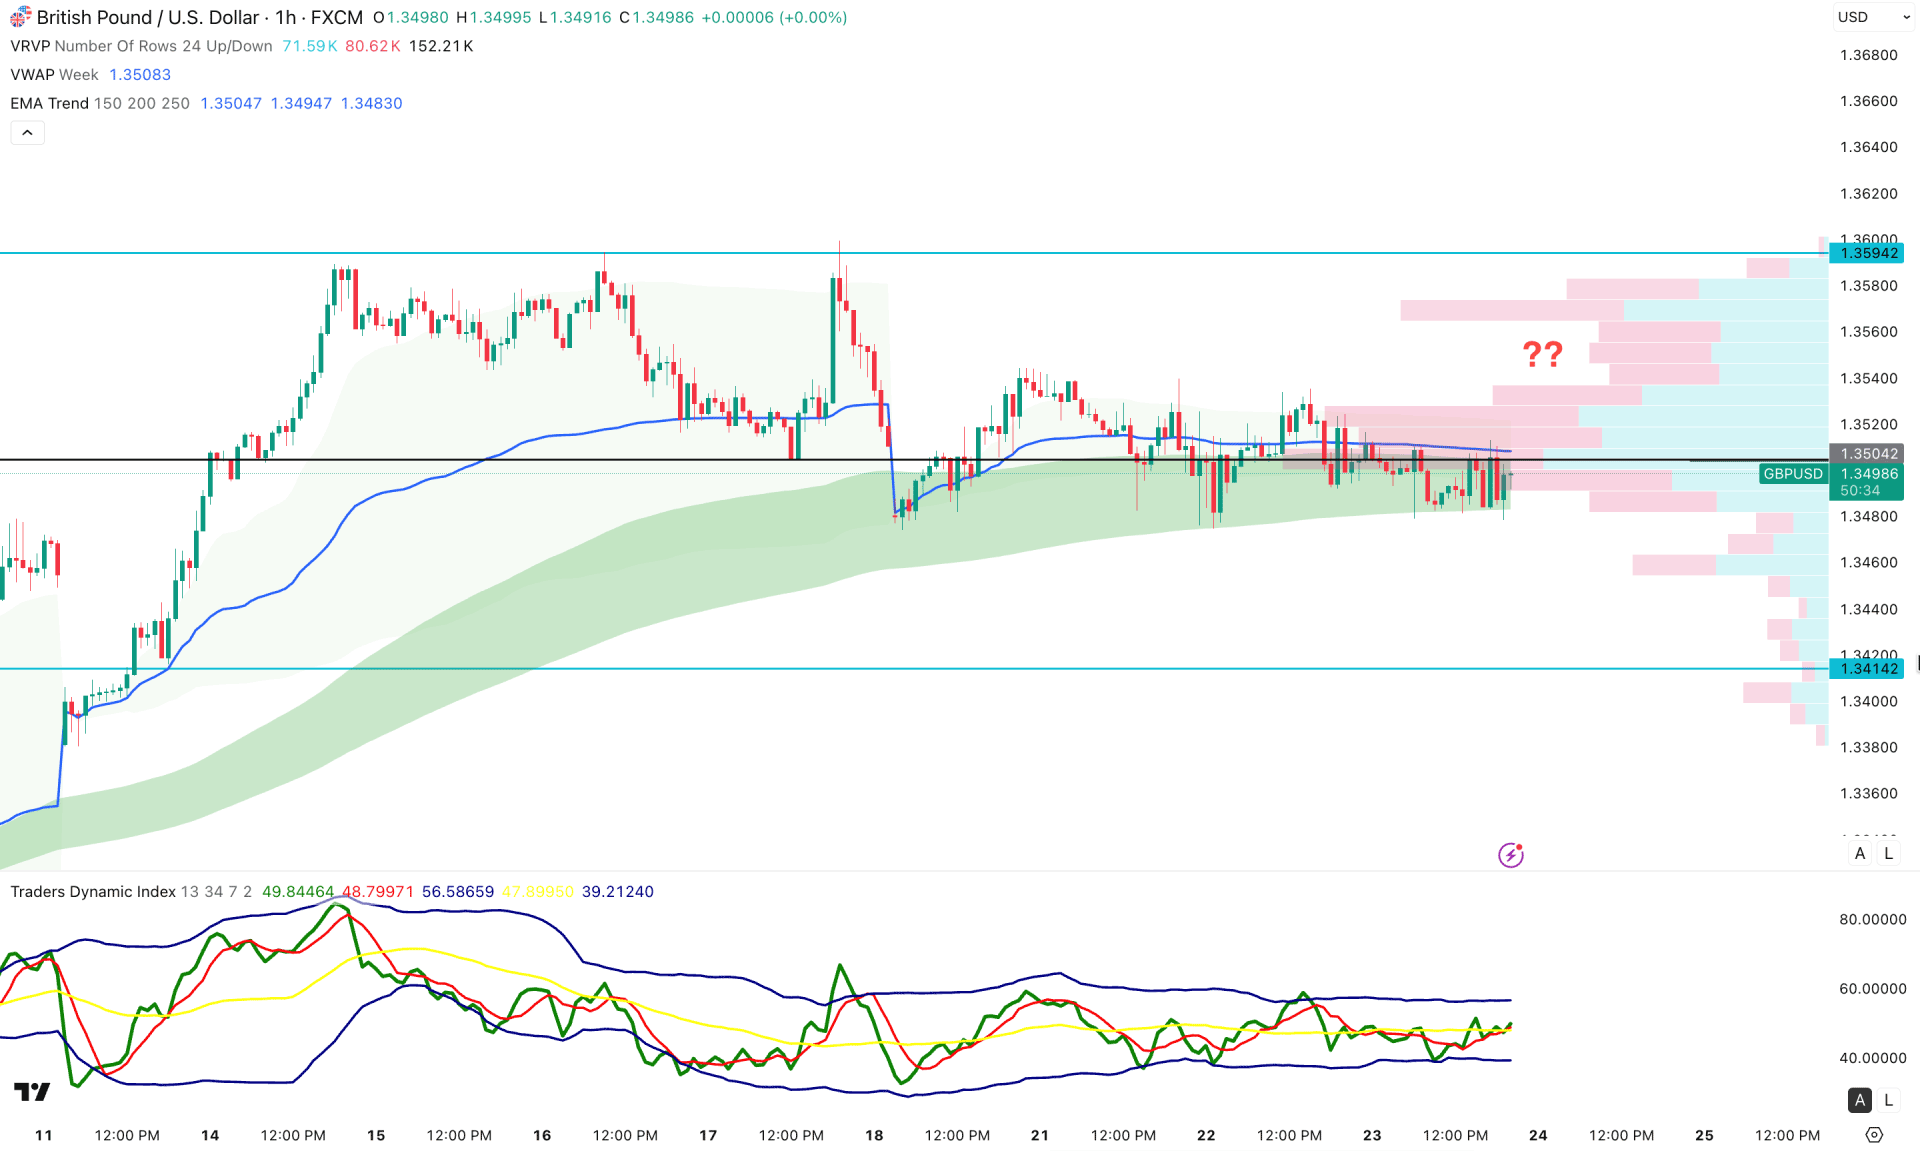
In the hourly timeframe, the price is highly corrective, with no strong evidence of clear market momentum. The weekly VWAP is above the current price, while the price is trading within the EMA wave support.
In the secondary indicator window, the Traders Dynamic Index is showing buying pressure, as the current line is hovering above the 50.00 neutral level.
As the major market momentum is bullish, an extended downside correction is possible. Investors should closely monitor the hourly timeframe before anticipating the future price direction. As long as the price remains below the weekly VWAP, bearish pressure is possible, with immediate support at 1.3414.
On the other hand, an immediate bullish reversal with stable price action above the 1.3540 level could resume the existing trend, targeting the 1.3594 resistance level.
Based on the current market context, the GBPUSD price is trading within a bullish trend where the recent momentum is sideways. Investors should monitor the intraday price level, as a possible range breakout could offer a potential long opportunity.


