Published: January 17th, 2023
The US inflation rate in December was about what was expected. The headline number came at 6.5% y/y, down from November's 7.1% y/y and 0.1% m/m. The core statistic comes in at 5.7% y/y, down from the previous number of 6% y/y and 0.3% m/m.
Due to the high cost of wages, the Fed's primary focus is on providing essential services such as food and shelter. The reading today has pretty much confirmed a 25 basis point rate hike at the February meeting.
In the UK, the BOE Chief Economist Huw Pill said that the war in Ukraine has caused food and energy prices to rise. He also said that a lack of workers in the economy has made inflation go up even more.
His strong desire to bring inflation down was seen as hawkish by the markets, which now see a nearly 70% chance of a 50 bps rate increase at the meeting in February. BOE member Mann said there will be more rate hikes and that there is no threat of too much tightening right now.
November GDP came in at 0.1% m/m instead of -0.2% m/m as expected, which could help Q4 GDP come in flat or slightly positive. That will push inflation back to the first quarter of 2023, and the next recession may not be as bad as feared. That would explain why BOE members are so tough and why rates keep increasing.
Based on the current market structure, bulls could dominate the market as the current GBPUSD price shows several bullish signals.
Let’s see the future price direction from the GBPUSD technical analysis:
In the weekly chart, the bullish possibility is potent as the current price is backed by a fakey and bullish candle closes. It is a sign that the higher timeframe price action is solid for bulls and the price has more room to move upward, depending on the daily price behavior.
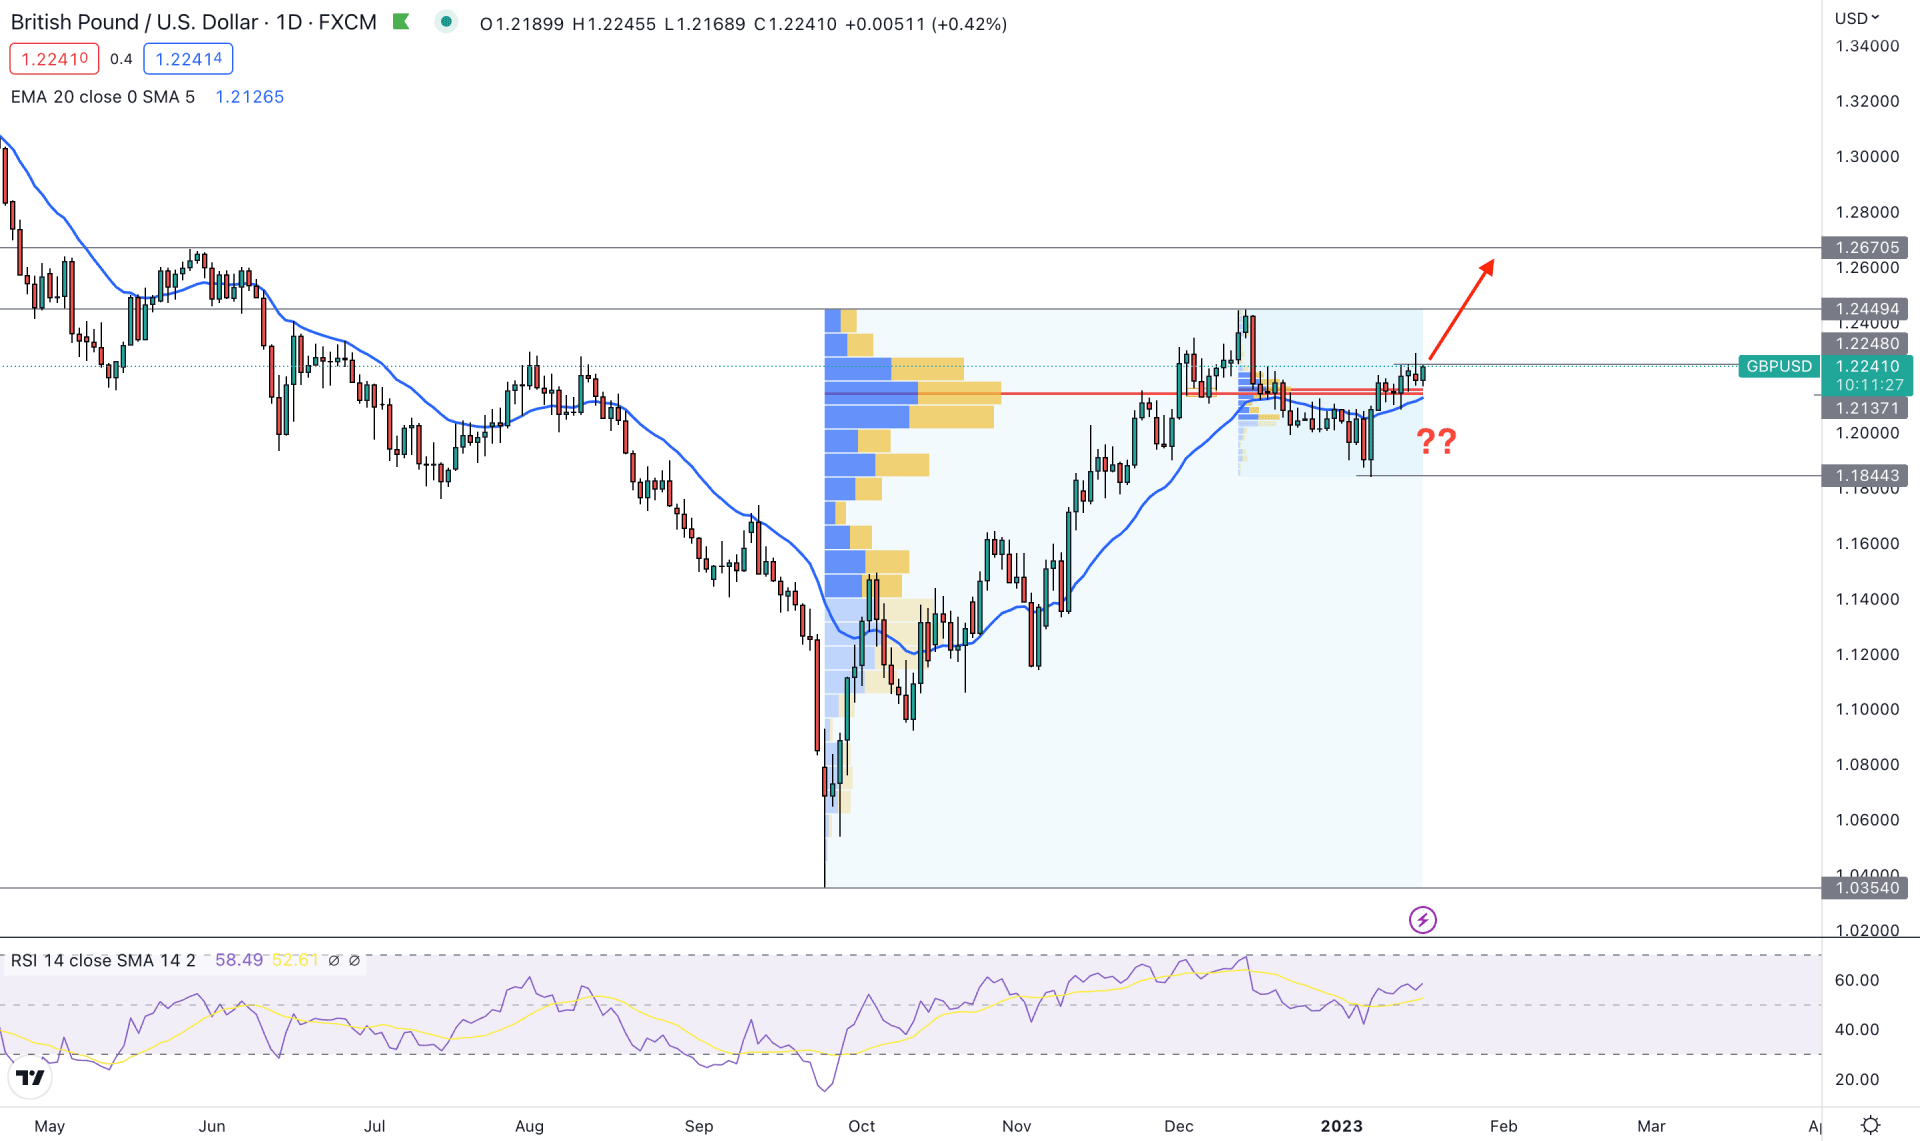
If we look at the daily chart, a strong bullish rejection is seen from the 1.0359 swing low from where the current bullish trend started. Since then there is no sign of strong selling pressure in the market. Therefore, the primary aim of this pair is to look for long trading opportunities until the price reaches any critical resistance level.
As per the fixed range high volume indicator, the highest trading volume from September to January is 1.2137, which is just below the current price. Moreover, another high volume level from December to January peak is also marked near the 1.2137 level. It is a strong signal that institutional traders are involved in buying this instrument with the hope of future price appreciation.
In recent trading days, the bullish price action is blacked by a new swing low formation at the 1.1844 support level. The dynamic 20-day Exponential Moving Average is carrying the price while the current Relative Strength Index (RSI) is aiming toward the overbought 70% level.
Based on the current price structure, any intraday bullish signal could offer a long opportunity in this pair. The primary price target of the bullish possibility will be the 1.2670 resistance level for the coming days.
On the other hand, a strong break below the high volume 1.2137 level is needed before showing a bearish correction toward the 1.1844 level.
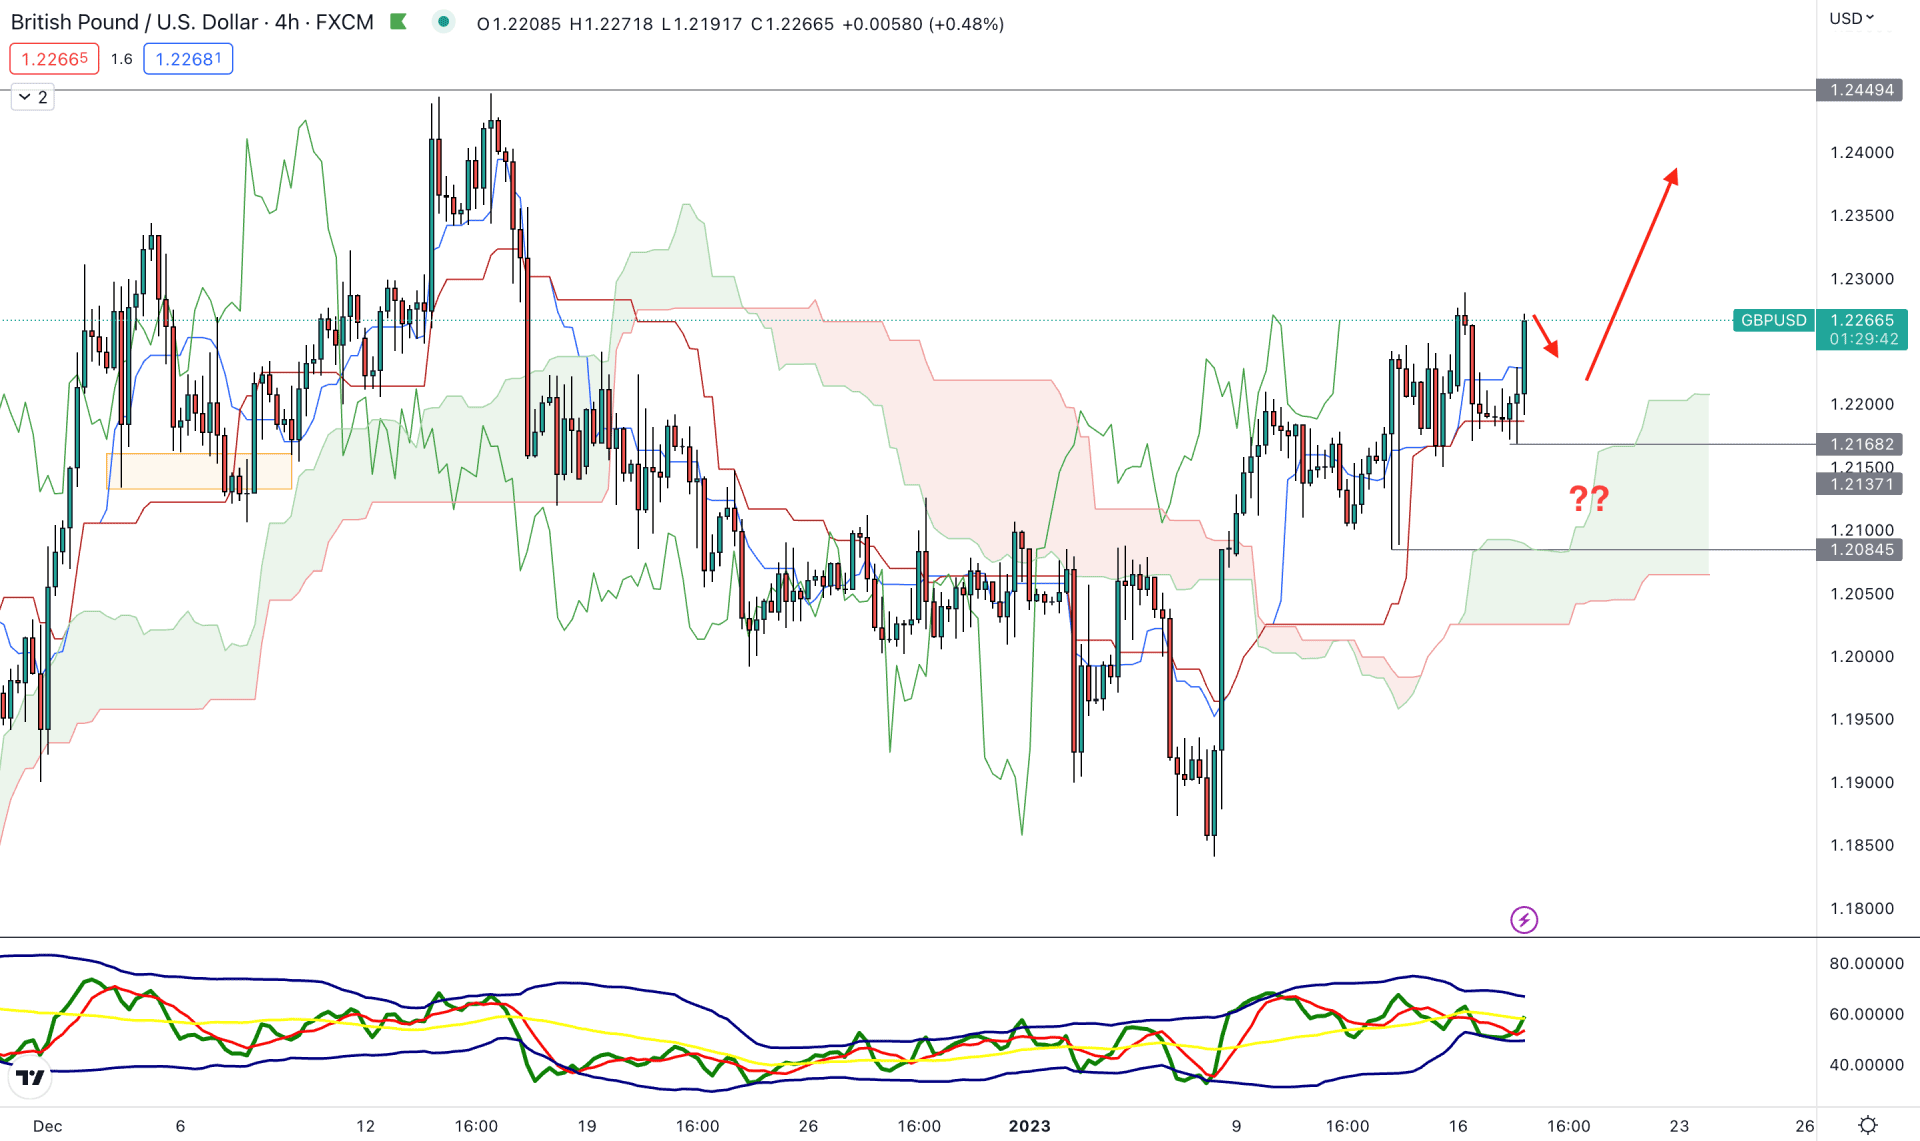
In the h4 timeframe, the bullish outlook is solid as shown by the future cloud structure. The gap between the Senkou Span A and B is wider while both lines are aiming higher. It is a sign of a strong bullish trend where any bearish correction could offer a trend trading opportunity.
In the Traders Dynamic Index, a minor divergence is seen as the TDI line is struggling to make higher highs. However, the dynamic Tenkan Sen and Kijun Sen are below the price and aiming higher, which could boost the bullish momentum.
Based on the H4 outlook, any bearish correction towards the 1.2200 to 1.2090 area with a bullish rejection could offer a long opportunity in this pair.
The alternative approach is to wait for the price to come below the 1.2084 level and form a bearish daily candle. In that case, the short opportunity is open, targeting the 1.1900 area.
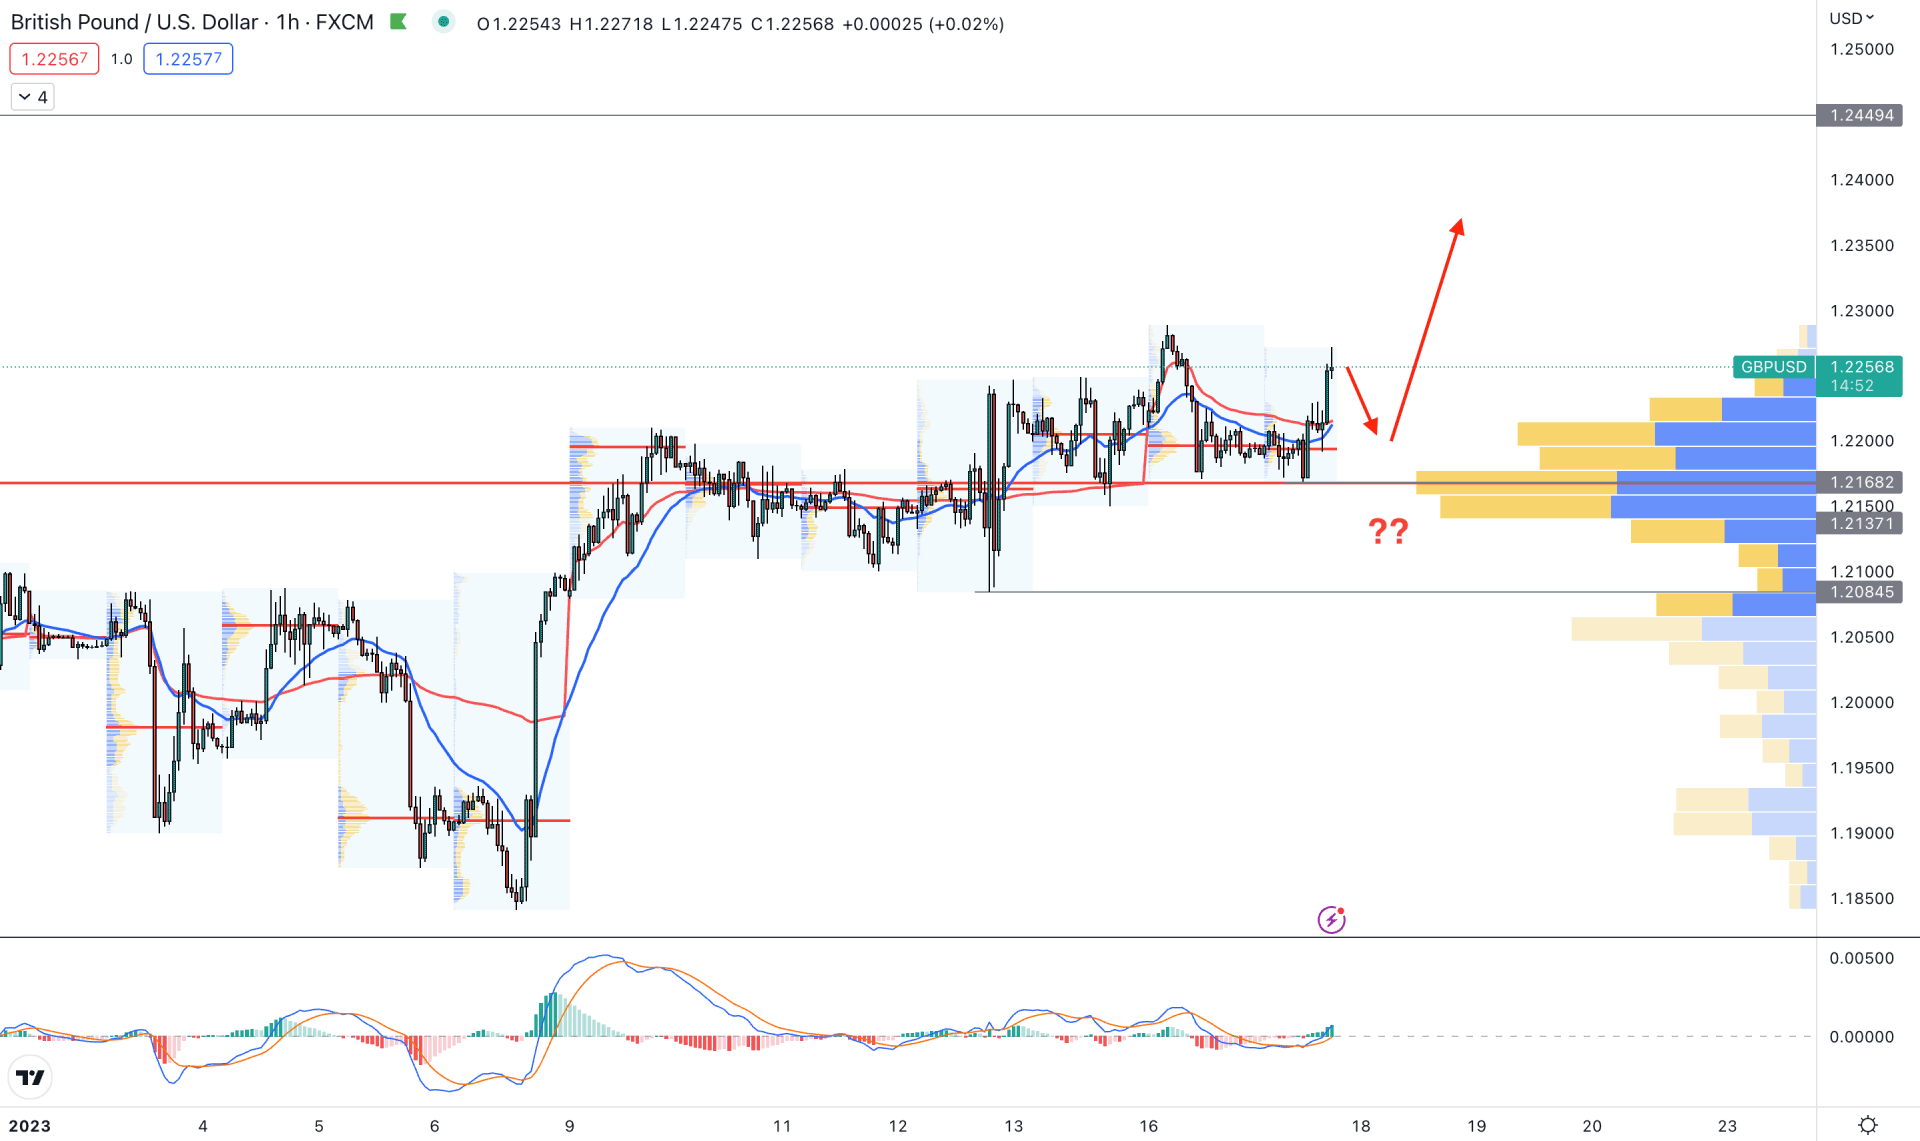
In the hourly time frame, the price is moving higher by creating lower highs. Moreover, the current price is passing through a consideration zone, where the visible range high volume level indicator is showing buying pressure.
The high volume level from 3 January 2023 to 17 January 2023 is spotted at 1.2168 level, which is the immediate support level of this price setup. Therefore, the primary idea for this pair is to look for long trading opportunities until the price is breaking below the 1.2168 level.
In the indicator window, MACD EMA’s are moving higher from the neutral zone, while the Dynamic 20 Exponential Moving Average and weekly VWAP are working as immediate support.
However, the bullish possibility will be invalidated if the price comes below the 1.2084 key support level, which will open room for reaching the 1.1900 area.
Based on the current price outlook, GBPUSD bulls could regain momentum at any time. In that case, the best trading approach would be to look for intraday bullish rejections from the suitable area towards the timeframe’s direction.


