
Published: July 6th, 2023
As Governor of the Bank of England (BoE), Andrew Bailey emphasized the significance of fair pricing for customers; the British Pound (GBP) has experienced a significant upward trend. Although Bailey believes that inflation will ultimately decline, borrowers may face severe repercussions, and the timing of a rate cut is uncertain.
However, labor shortages in the United Kingdom are anticipated to contribute to a rise in inflation. Additionally, Prime Minister Rishi Sunak has expressed optimism regarding price stability.
In the meantime, the US Dollar (USD) posted initial gains on Thursday but soon surrendered them after the Federal Reserve (Fed) FOMC Minutes were released. The minutes revealed a divided vote on whether or not to increase interest rates in June instead of maintaining the current stance. This inclination toward a hawkish outcome has centered market attention on the future course of interest rates.
The prospect of additional Fed rate increases has caused the Dollar to deviate from a number of G10 currencies, especially since some central banks have already signaled a stable monetary policy rate or potential future rate cuts.
Let’s see the complete market outlook from the GBPUSD technical analysis:
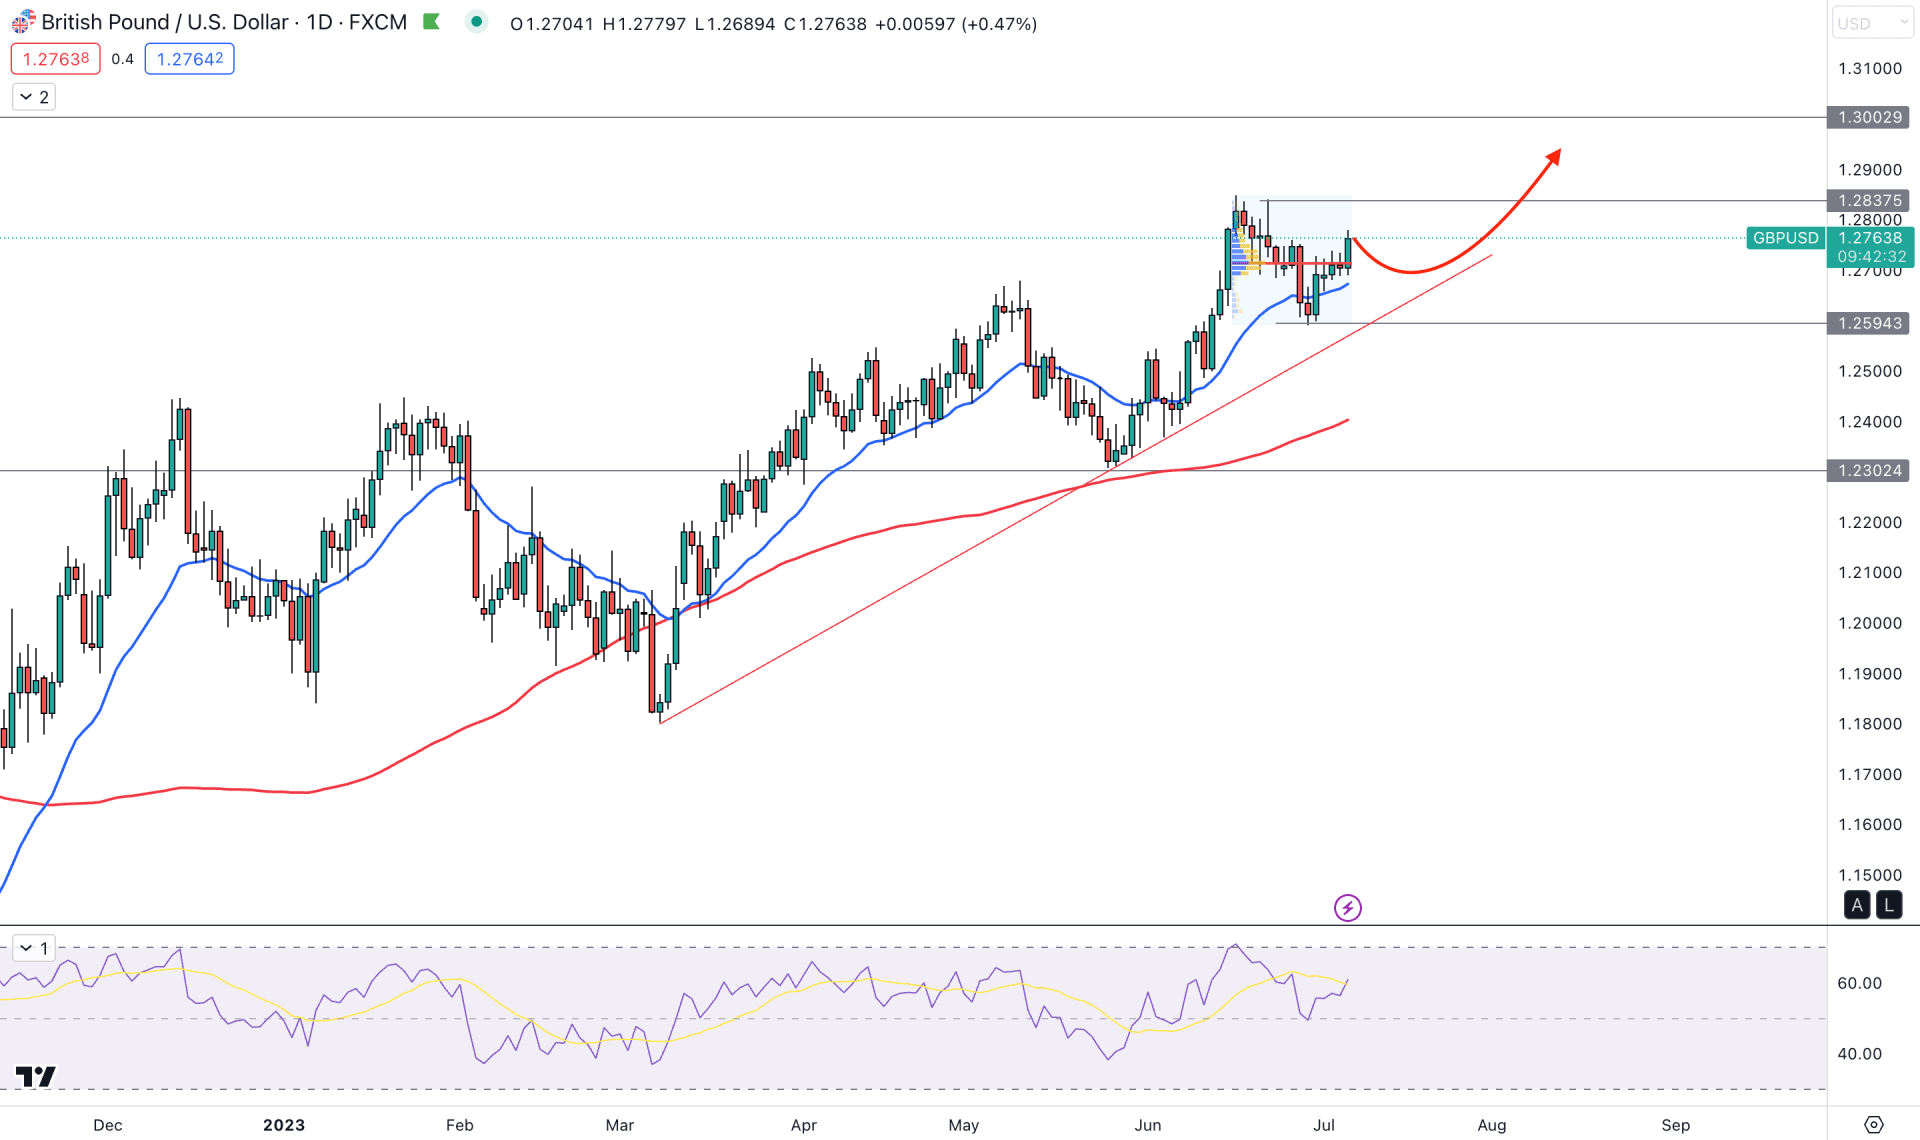
In the daily chart of the GBPUSD, the current market trend is bullish, where the existing price is moving higher from left to right. Also, the higher high and lower high formations in the daily chart show that bulls are active in the market, and the current corrective trend might end up with a bullish impulsive wave.
In the monthly chart, the current price is trading above the June 2023 high, backed by a strong bullish candle. Moreover, the strong long wicked candle is backing the bullish momentum in the weekly chart, which could work as a strong support to the daily trend.
In the latest swing from the 1.2848 high to the 1.2593 area, the highest trading volume is spotted at the 1.2713 level. As the latest price action shows a strong breakout from the high volume level, we may consider it a valid upward pressure.
The dynamic 20-day Exponential Support shows an immediate bullish recovery, while the current 100-day SMA is below the current price.
The 14-period Relative Strength Index (RSI) shows a rebound from the 50.00 line and aimed for the 70.00 overbought area.
Based on the current daily outlook of GBPUSD, we may say that the current market trend is bullish, and any long opportunity could work well in this price structure. The primary trading idea is to look for long trades only as long as the price trades above the 1.2593 level. A buying pressure with a D1 candle above the 1.2837 level might increase the possibility of reaching the 1.3000 level.
The bearish pressure may come from any false break from the 1.2837 level. However, the conservative short approach might come after breaking below the 1.2594 level with a daily candle close.
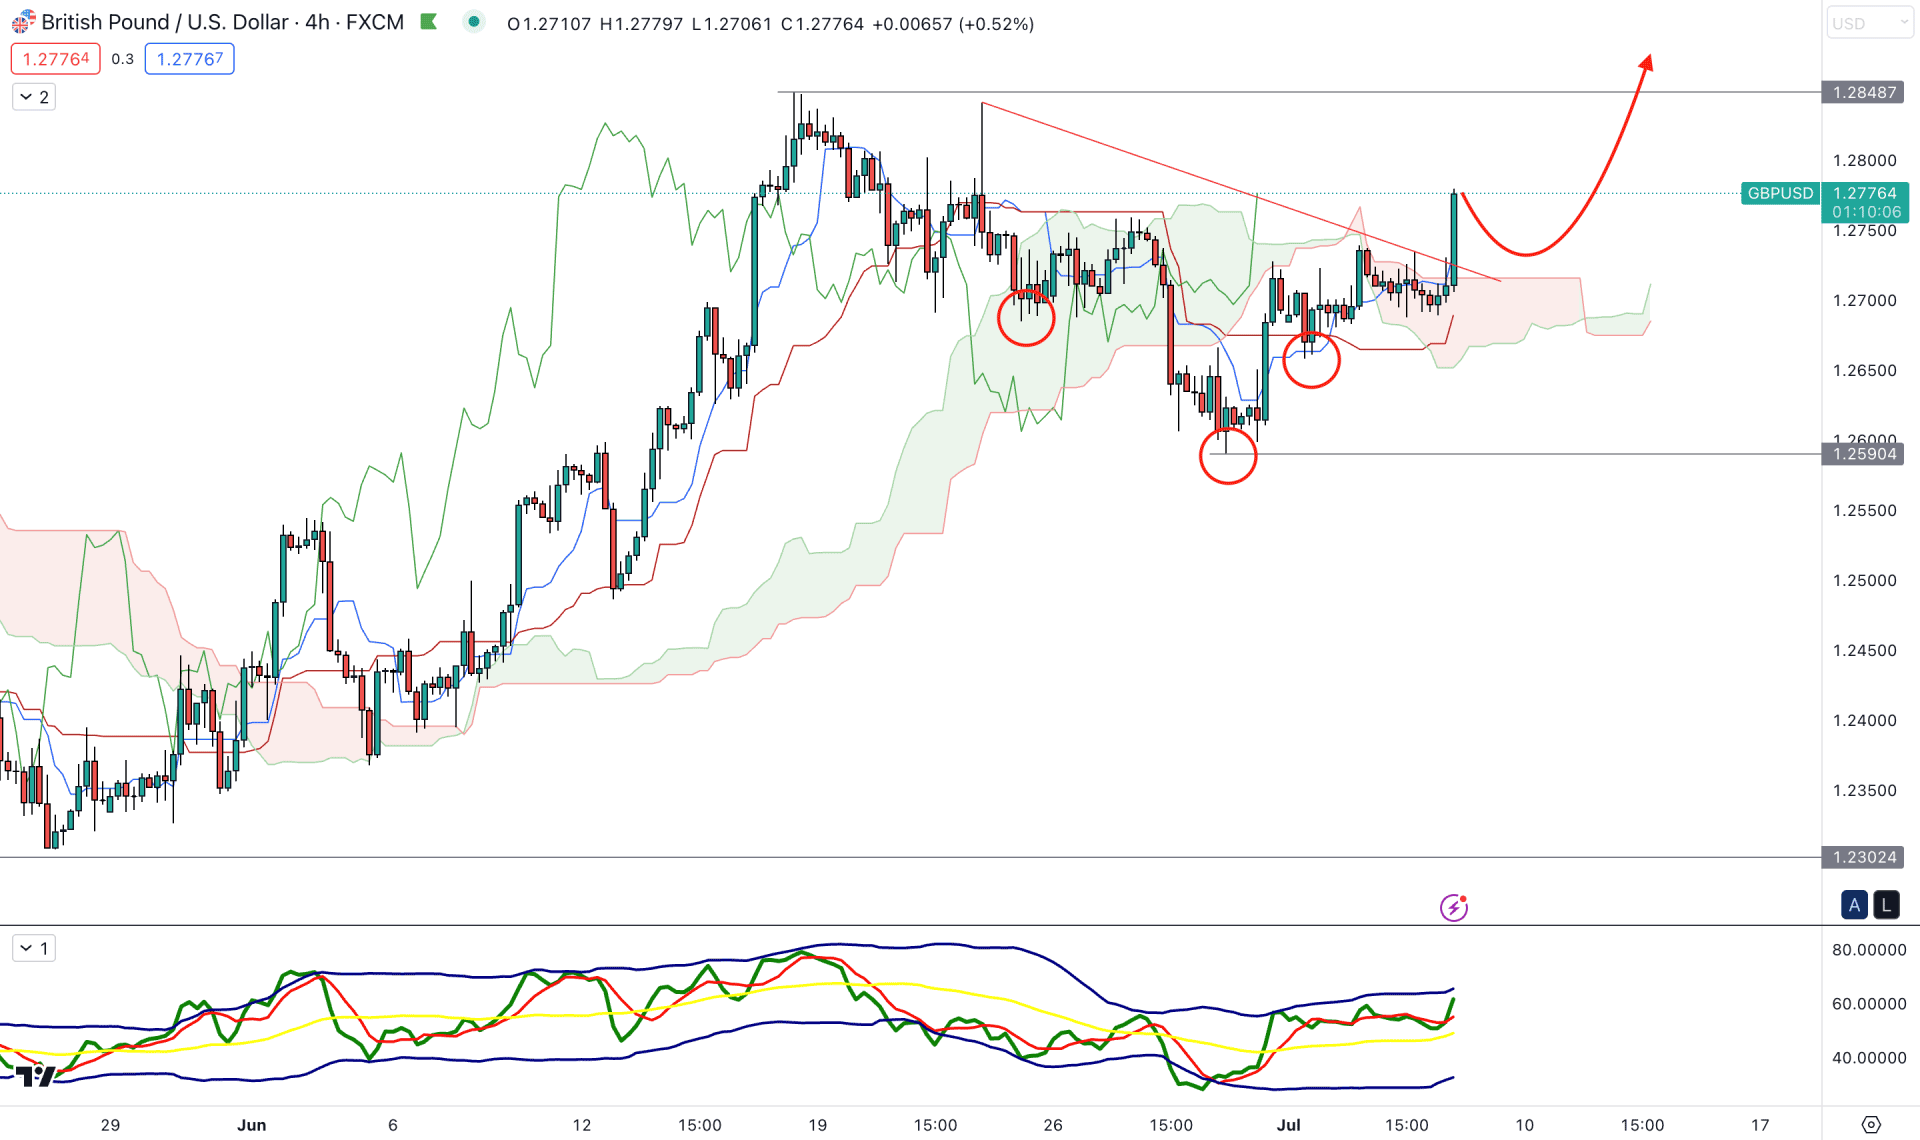
In the intraday chart, the current bullish trend continuation pattern is solid from the recent Inverse Head and Shoulders breakout, where a strong bullish H4 candle is seen above the neckline and the trendline resistance.
According to the Ichimoku Kinko Hyo indicator, the buying pressure is potent from the cloud breakout, supported by the bullish flip in the future cloud.
The Traders Dynamic Index (TDI) shows the same structure, where the current TDI level remains steady above the 50.00 line.
Based on the H4 outlook, a bearish pressure and an additional bullish recovery from the trendline could be a long opportunity in this pair, where the main aim is to test the 1.2848 level.
On the other hand, a break below the 1.2590 level could invalidate the inverse Head & Shoulders pattern, which may lower the price towards the 1.2500 level.
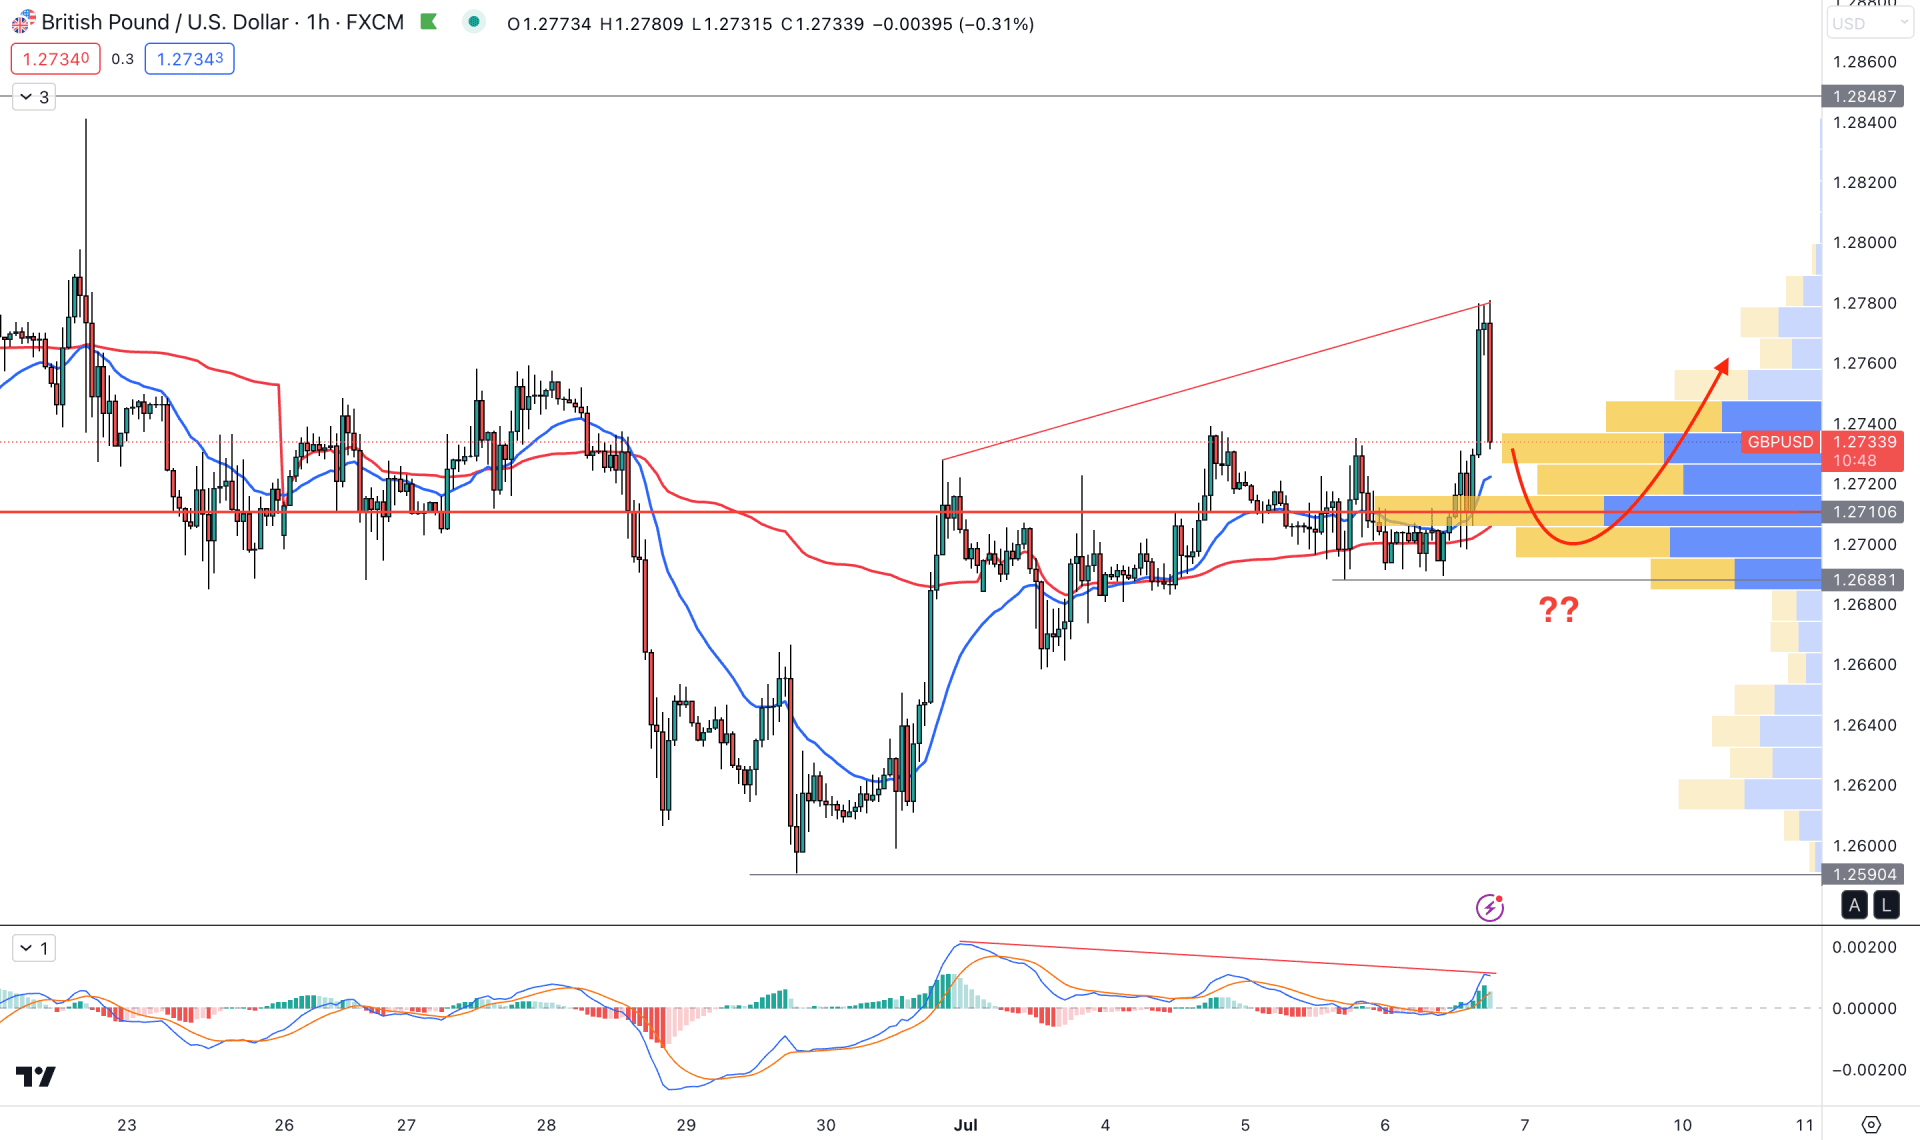
In the hourly chart, the price seems very volatile, where a strong bullish pressure is seen to be recovered by a counter-impulsive bearish candle. However, the visible range high volume level is still on the buyers' side, where any recovery from the dynamic level could be a long signal.
On the other hand, a potential divergence is seen between the price and MACD, which might work as an alarming sign to bulls.
Investors should keep a close eye on the 1.2735 to 1.2688 area as a bullish rebound may appear from this zone. However, a bearish break with a D1 candle close below 1.2680 might make the current buying pressure obsolete.
The broader market outlook for the GBPUSD price is bullish based on the current market structure. As a result, investors might find a bullish trend continuation opportunity if a strong recovery is seen in the intraday chart.


