Published: December 5th, 2024
For the third day in a row, the GBPUSD pair is trading with a slightly positive outlook, hovering slightly higher than the 1.2700 mark. However, spot prices are still less than the weekly high and lack positive conviction.
As traders choose to sit on the sidelines in anticipation of Friday's announcement of America's Nonfarm Payrolls (NFP) report, the US dollar (USD) continues its downward consolidative price movement. Consequently, this is regarded as a significant element driving the higher GBPUSD exchange rate. However, anticipations of a less dovish Fed lead to a slight increase in the yields on US Treasury bonds, which serves as an upward pull for the greenback.
Investors now appear to be certain that President-elect Donald Trump's expansionary policies and tariff proposals will increase inflation. Furthermore, remarks made on Wednesday by a number of significant FOMC members, including Fed Chair Jerome Powell, indicated that the US central bank would take a cautious approach to rate cuts. This serves as a positive force for the USD and causes a slight recovery in the yields on US Treasury bonds.
In addition, the safe-haven buck is further supported by ongoing geopolitical risks resulting from the escalating Russia-Ukraine conflict and concerns about a trade war. Following the anticipated four reductions in interest rates in 2025 by Bank of England Governor Andrew Bailey, the British Pound (GBP) bulls continue to stay on the sidelines. Bulls should exercise caution as this further caps the GBPUSD pair.
Let's see the further outlook of this currency pair from the GBPUSD technical analysis:

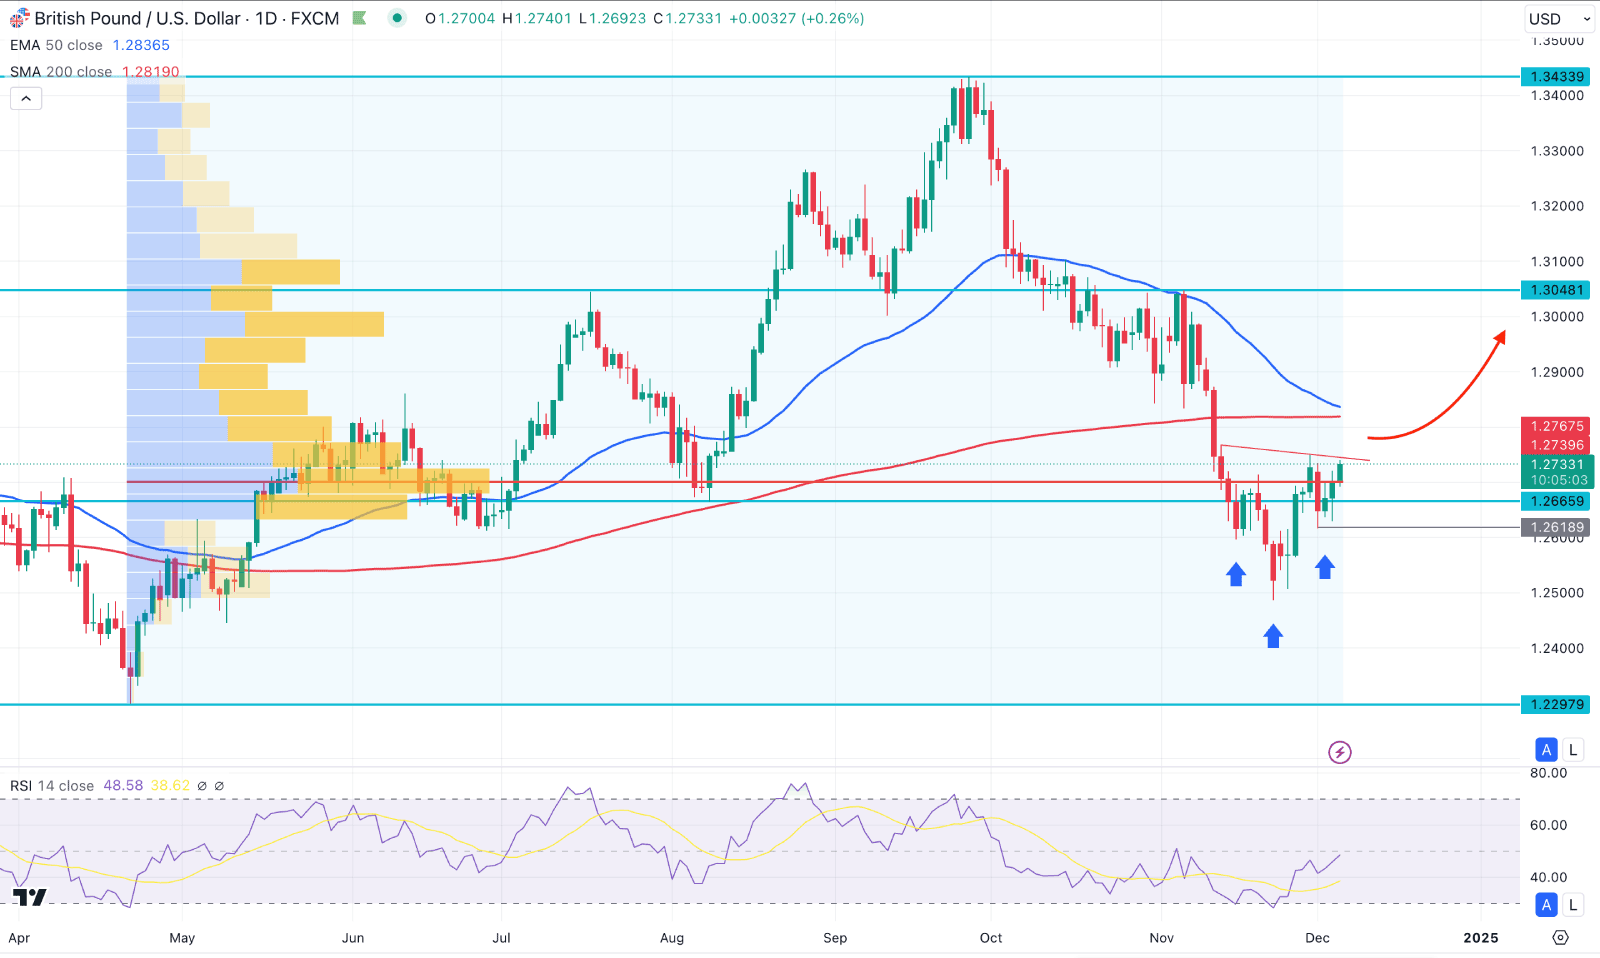
In the daily chart of GBPUSD, the recent price showed an extended selling pressure creating a new low in 8 months. As a result, the price reached a deeper discounted zone from where bulls might be attracted to join the potential upward movement.
In the higher timeframe, the October 2024 close came with a bearish engulfing bar, followed by a continuation in November. However, the current price is hovering below the November close, signalling no bottom formation. The weekly price showed an early bullish sign as a strong recovery is seen from the 1.2488 low. However, more clues are needed to see from the near-term price action before anticipating a long move.
Following the weekly recovery, the daily price showed a solid bottom where an inverse Head and Shoulders pattern has formed. As the current price hovers below the H&S neckline, a solid breakout could validate the bottom at any time.
On the other hand, the 200-day Simple Moving Average is still above the current price, signalling a major bearish trend. Also, the short-term market trend is still bearish, as the 50-day EMA is above the current price.
Based on the daily market outlook of GBPUSD, overcoming the 200-day SMA would signal a conservative long approach, aiming for the 1.3048 resistance level. However, an aggressive long approach is available from the valid inverse Head & Shoulders breakout, which needs proper validation.
On the bearish side, the monthly candlestick pattern with daily SMA lines signals a potential downside pressure. In that case, any immediate bearish daily candle below the 1.2681 level could lower the price towards the 1.2400 psychological level.

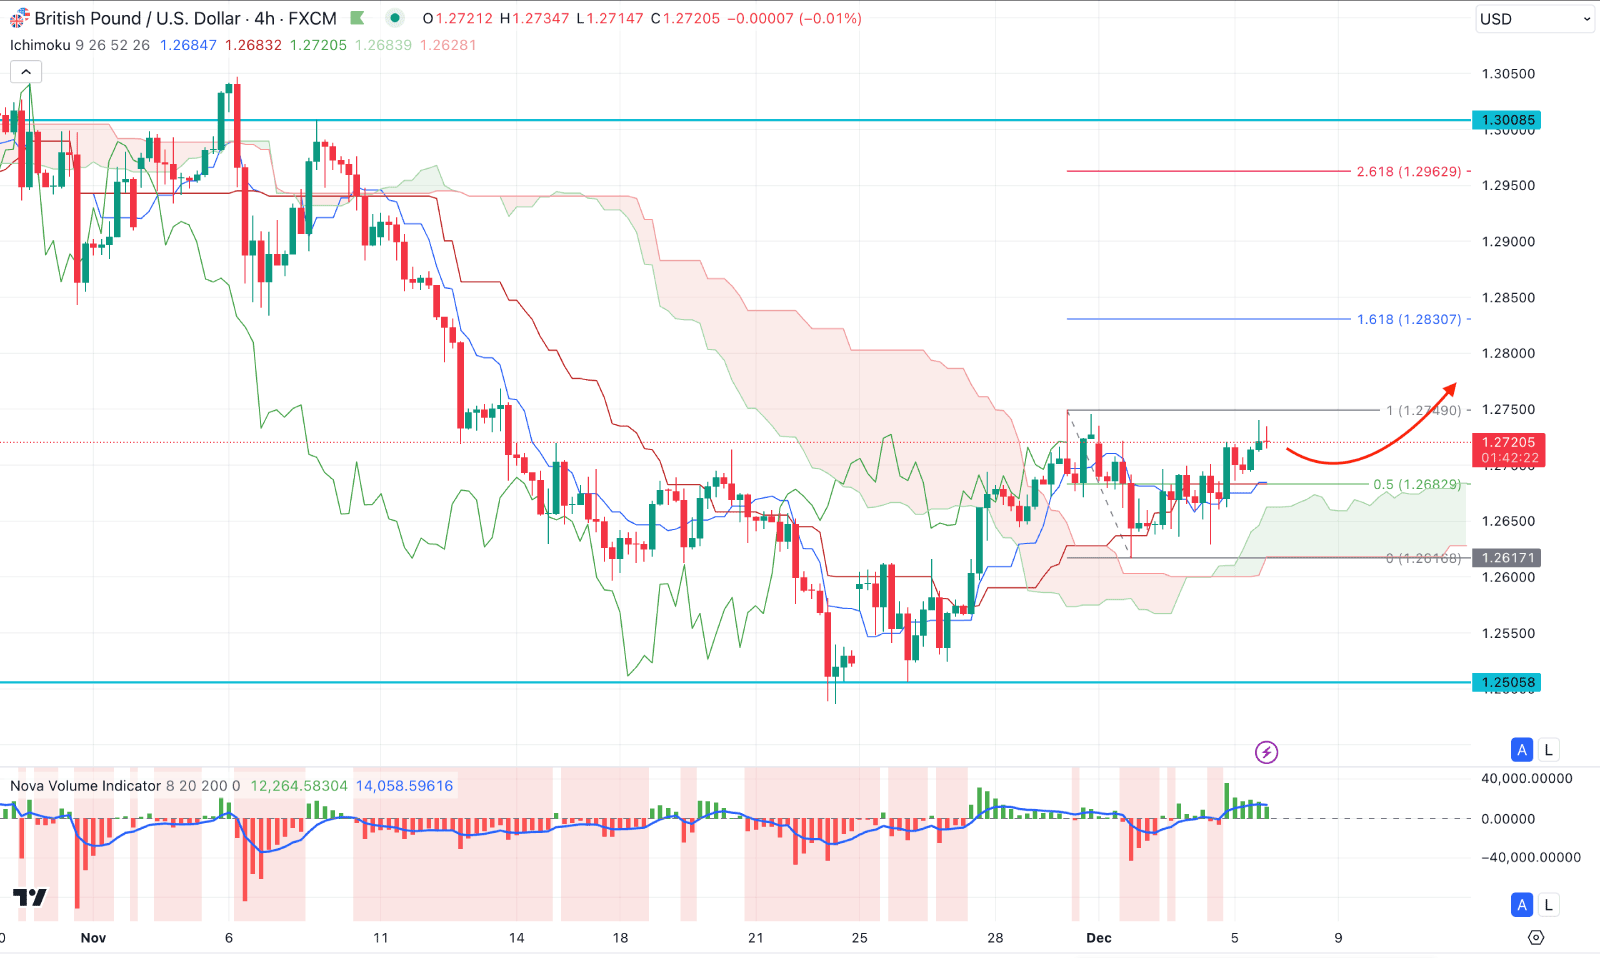
In the H4 timeframe, the price showed a bullish CHoCH formation where the current price hovered above the 1.2617 support level. Moreover, the future could look positive, where the Senkou Span A aimed higher, above the Senkou Span B.
In the volume histogram, the recent vertical line above the neutral point maintained the buying pressure, although no high is formed now.
Based on the H4 outlook, the ongoing bullish recovery from the dynamic Kijun Sen line could increase the price above the 1.2749 high level. In that case, the primary target of the bullish pressure is to test the 1.2830 Fibonacci Extension level.
On the bearish side, the Ichimoku Cloud would work as a crucial support for this pair. A solid downside pressure with a daily close below the 1.2617 static line could lower the price towards the 1.2505 level.

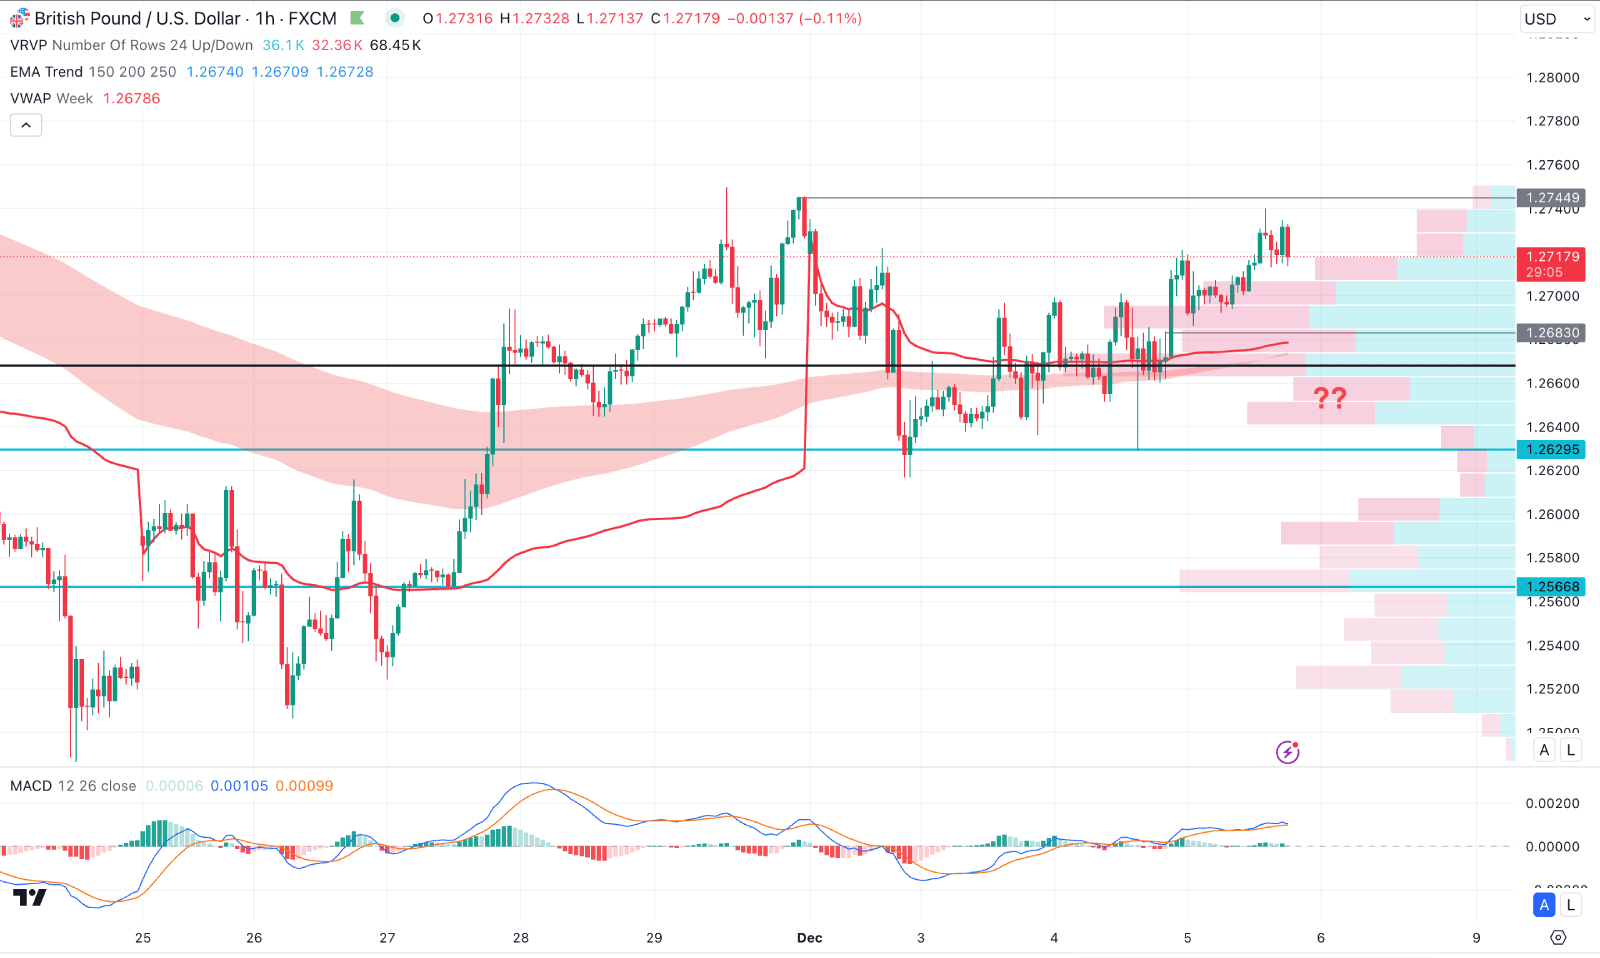
In the hourly time frame, the recent price of the GBPUSD showed a bullish recovery, with an upward wave above the dynamic weekly VWAP line. Moreover, the Moving Average wave is below the current price and is working as a major support.
In the indicator window, the MACD Histogram remains sideways at the neutral area, signalling no sufficient momentum in the price. Moreover, the signal line is at the top with a bearish crossover, which indicates a potential top formation.
Based on this outlook, any immediate downside correction below 1.2700 could increase the bullish opportunity. In that case, a valid recovery from the near-term support zone is needed before aiming for the 1.2800 level.
On the other hand, a sharp selling pressure below the 1.2629 level could signal a bearish overextension, which might open a new room to reach the 1.2566 support level.
Based on the ongoing market momentum, GBPUSD bulls have a higher possibility of eliminating the loss that occurred in the last 8 months. In that case, a solid bullish breakout from the near-term price action could provide a high probable long opportunity.