
Published: January 22nd, 2026
After recent economic data presented a mixed picture and brought the Bank of England's monetary outlook back into focus, Sterling gained ground versus both the euro and the US dollar.
After geopolitical dominance previously in the week due to the possibility of a trade war between the United States and Europe, investors turned their focus to the status of the economy.
Following President Donald Trump's retraction of the ultimatum to impose tariffs on a few European NATO nations over Greenland, the U.S. dollar maintained its overnight gains.
Data from earlier this week indicated a weakening of the British labor market, which may allay the BoE's concerns over ongoing price pressures.
After data revealed that UK inflation increased more than anticipated in December, the pound remained stable on Wednesday. According to data released on Thursday, the British authorities borrowed less than anticipated in December due to a strong increase in tax receipts.
Let's see the upcoming price action from the GBPUSD price analysis:
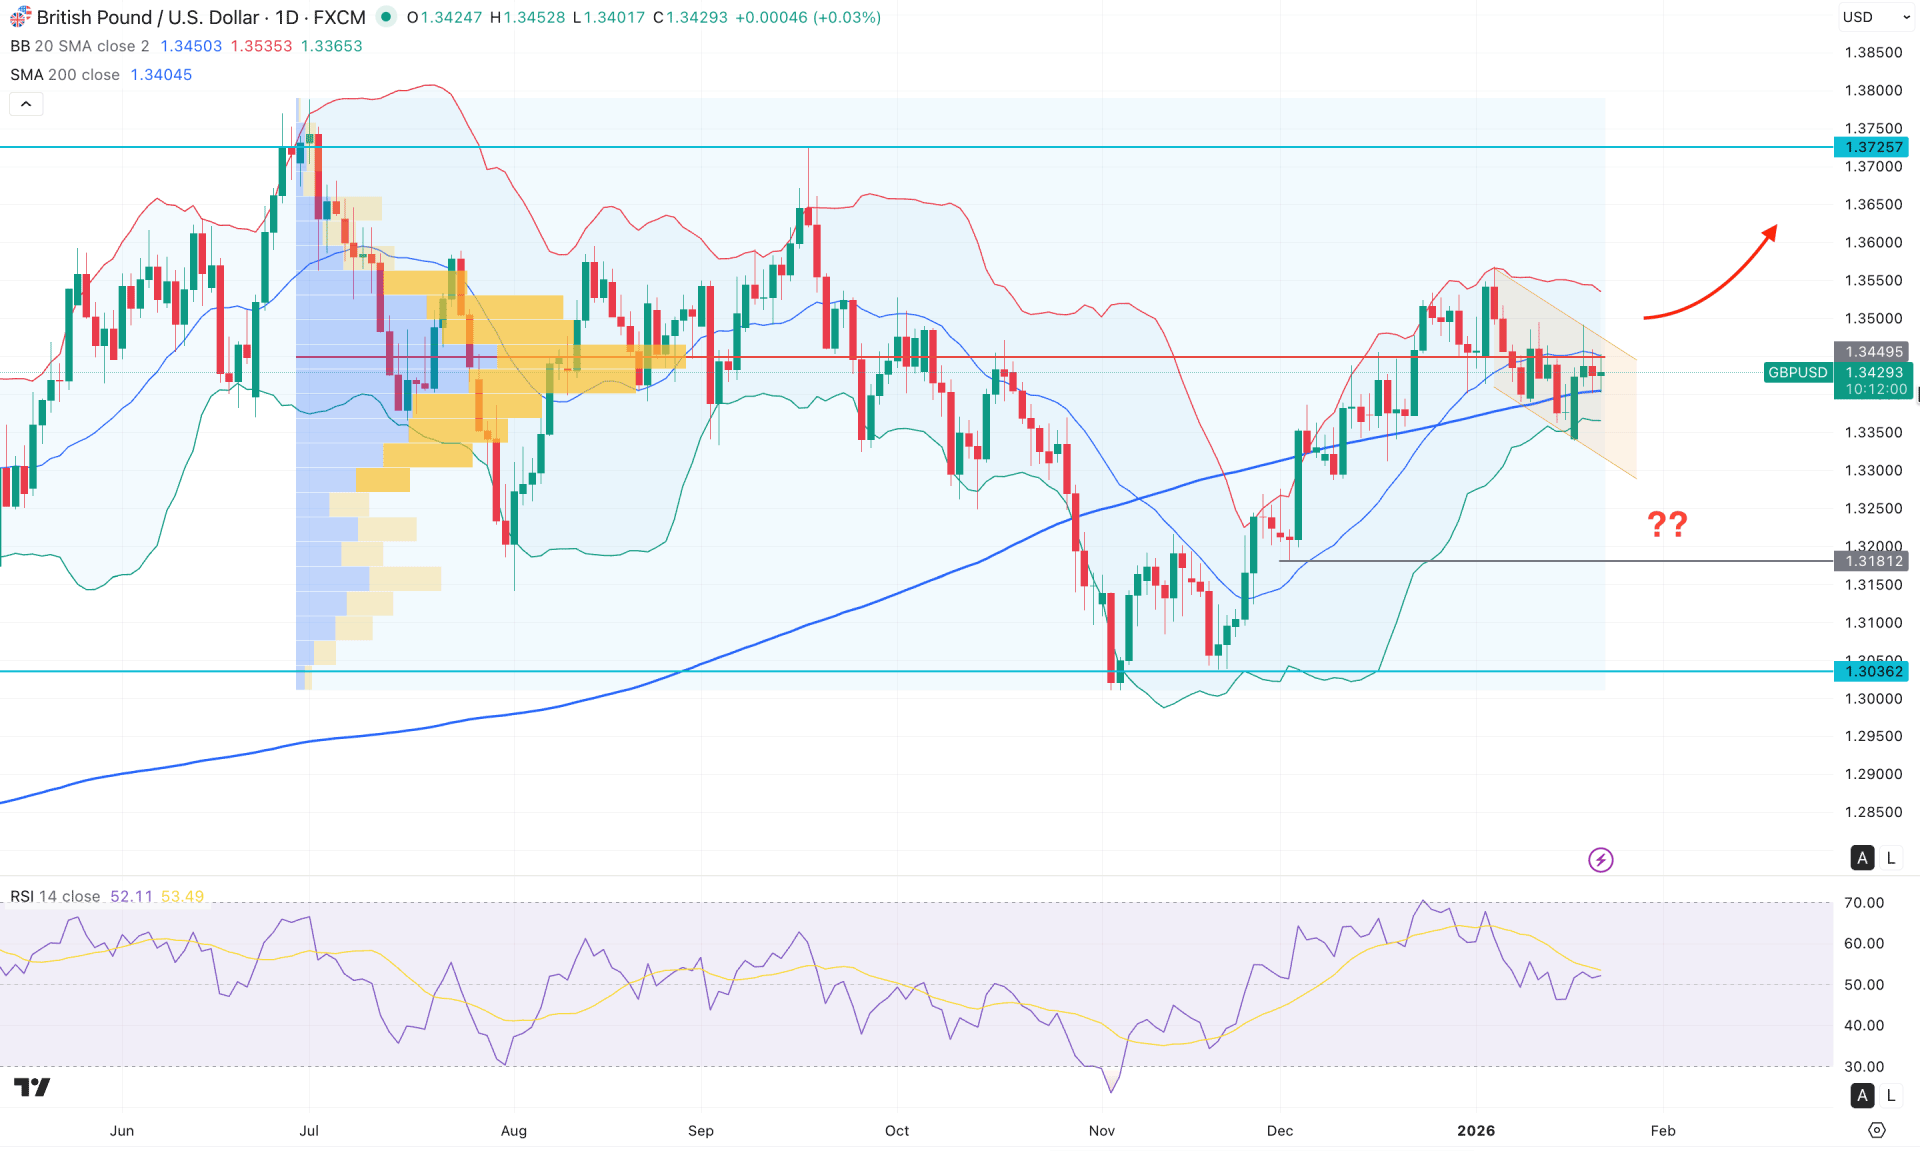
On the daily chart of GBPUSD, recent price action shows a strong bullish recovery from the 1.3036 bottom, creating a new swing high above the 1.3500 level. As the current price is trading sideways in this area, a proper validation could signal a bullish continuation opportunity.
Looking at the higher timeframe, the price is moving sideways after topping out in June 2025. However, the recent recovery has pushed the price above the December 2025 high, signaling a strong bullish continuation potential. The weekly timeframe remains range-bound within a broader consolidation. Additional confirmation is required before anticipating a long-term bullish continuation.
From a volume perspective, the price is consolidating, with the highest activity level since June 2025 located at the 1.3449 level, which is above the current price. Primarily, the price is struggling to overcome this high-volume node, as reflected by multiple indecision candlesticks. Investors should closely monitor price reactions around this area before validating a sustainable trend.
On the primary chart, the price is trading within an ascending channel, with multiple rejections observed near the middle Bollinger Band level. This indicates minor selling pressure in the market, which could initiate a short-term corrective move within the channel.
On the other hand, the 200-day Simple Moving Average is acting as immediate support, which could present a challenge for sellers.
In the secondary indicator, the Relative Strength Index (RSI) is hovering around 50.00, indicating moderate bullish momentum. Additionally, the Average Directional Index (ADX) has rebounded and remains below the 20.00 threshold, which serves as a secondary confirmation of underlying corrective pressure.
Overall market structure and trend bias remain bullish for GBPUSD, though a minor corrective pullback appears to be pending. Price action may react near channel resistance, as ongoing selling pressure at the high-volume level could drive the price lower to test the 1.3181 support level.
On the other hand, a failure to hold the price below the high volume line with an immediate bullish break from the channel area could be a highly probable opportunity, which could test the 1.3725 resistance level.
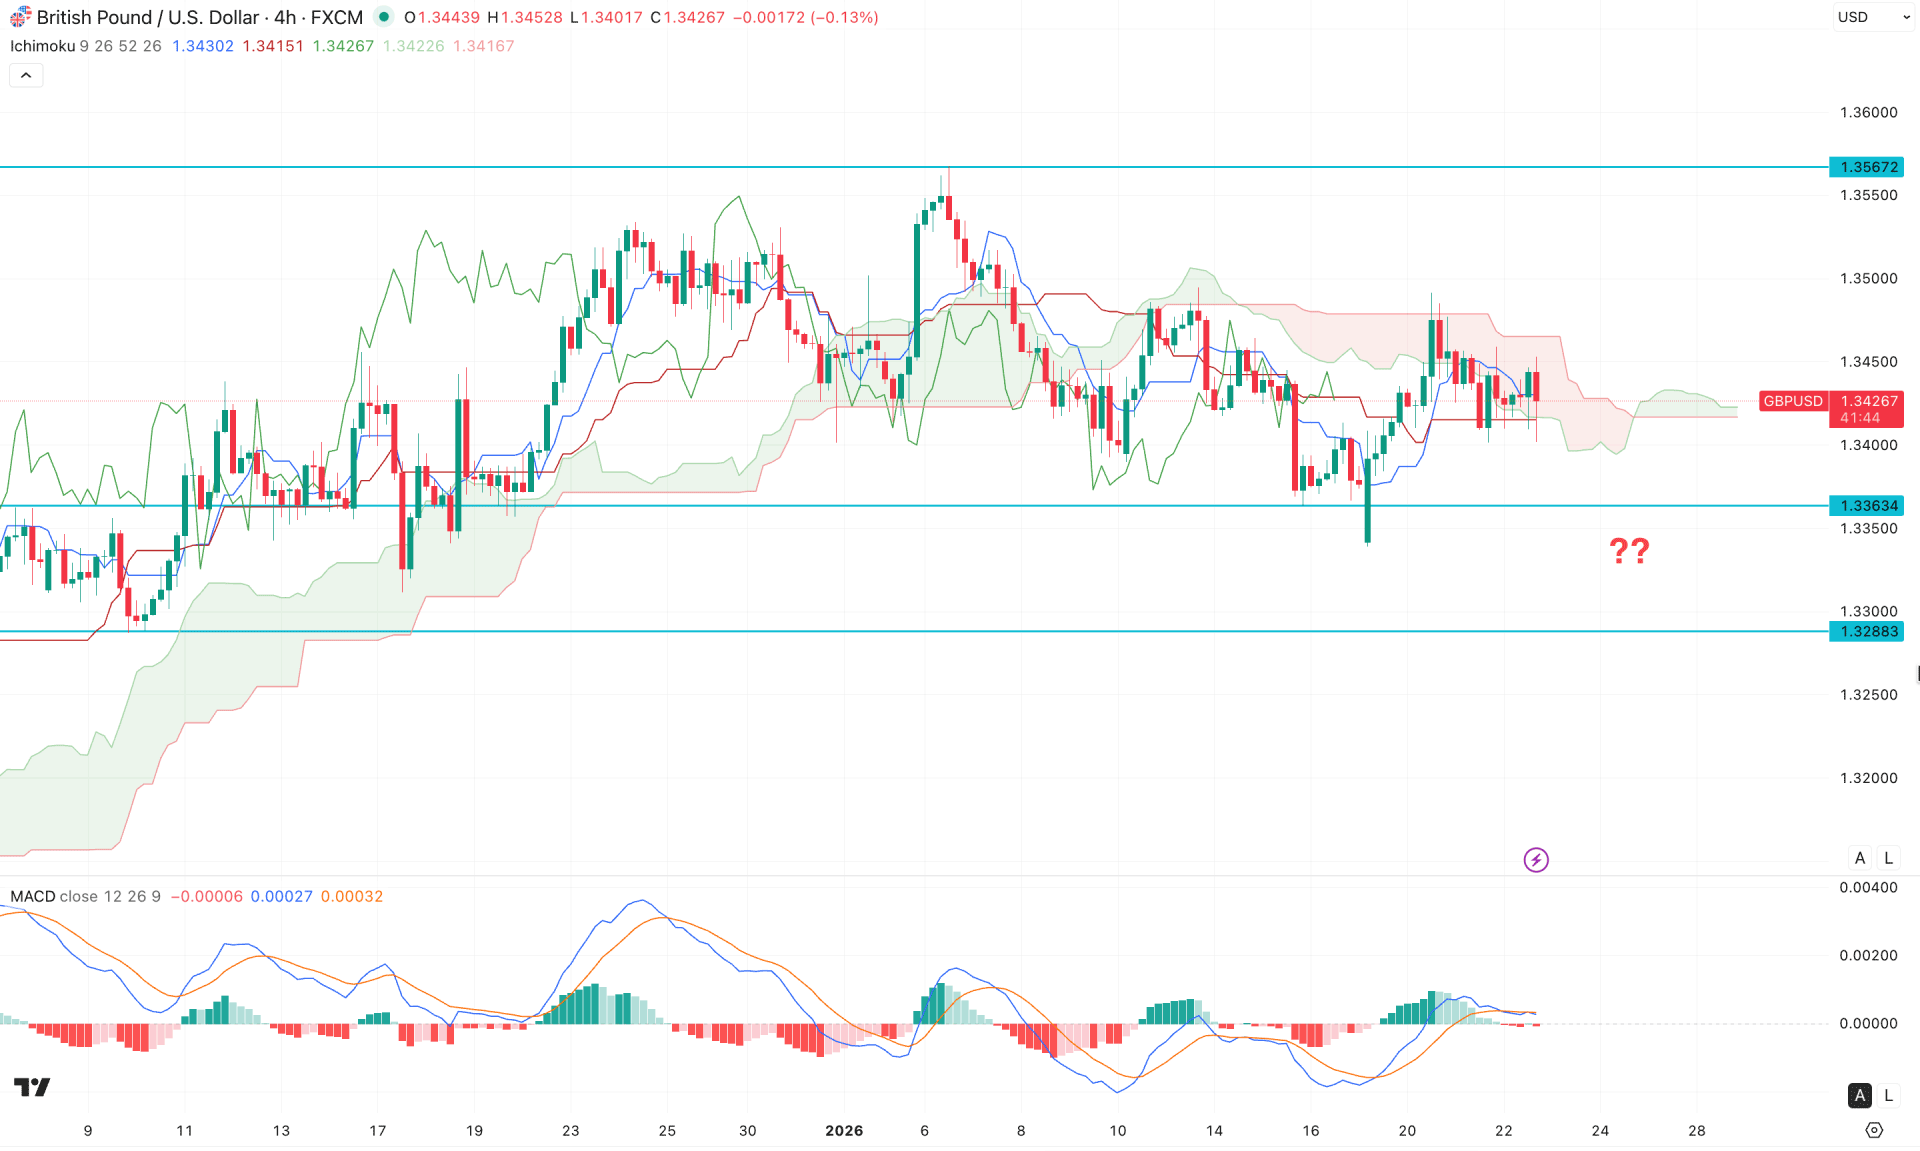
On the H4 timeframe, GBPUSD is currently trading within a sideways momentum, as multiple violations are observed around the cloud area. Moreover, the leading cloud indicates corrective momentum, while the cloud itself remains relatively flat.
In the secondary indicator window, the MACD histogram is hovering near the neutral line, while the signal line remains in positive territory.
Based on this outlook, investors should monitor how the price breaks out from the current consolidation zone. A bullish rejection from the dynamic support level could present a potential long opportunity, targeting the 1.3550 level. However, the broader bullish trend may need to stabilize near the 1.3567 level before extending further toward the 1.3800 area.
Alternatively, an extended corrective move could develop, where a bearish rejection from the 1.3364 area may push the price lower toward the 1.3300 support zone.
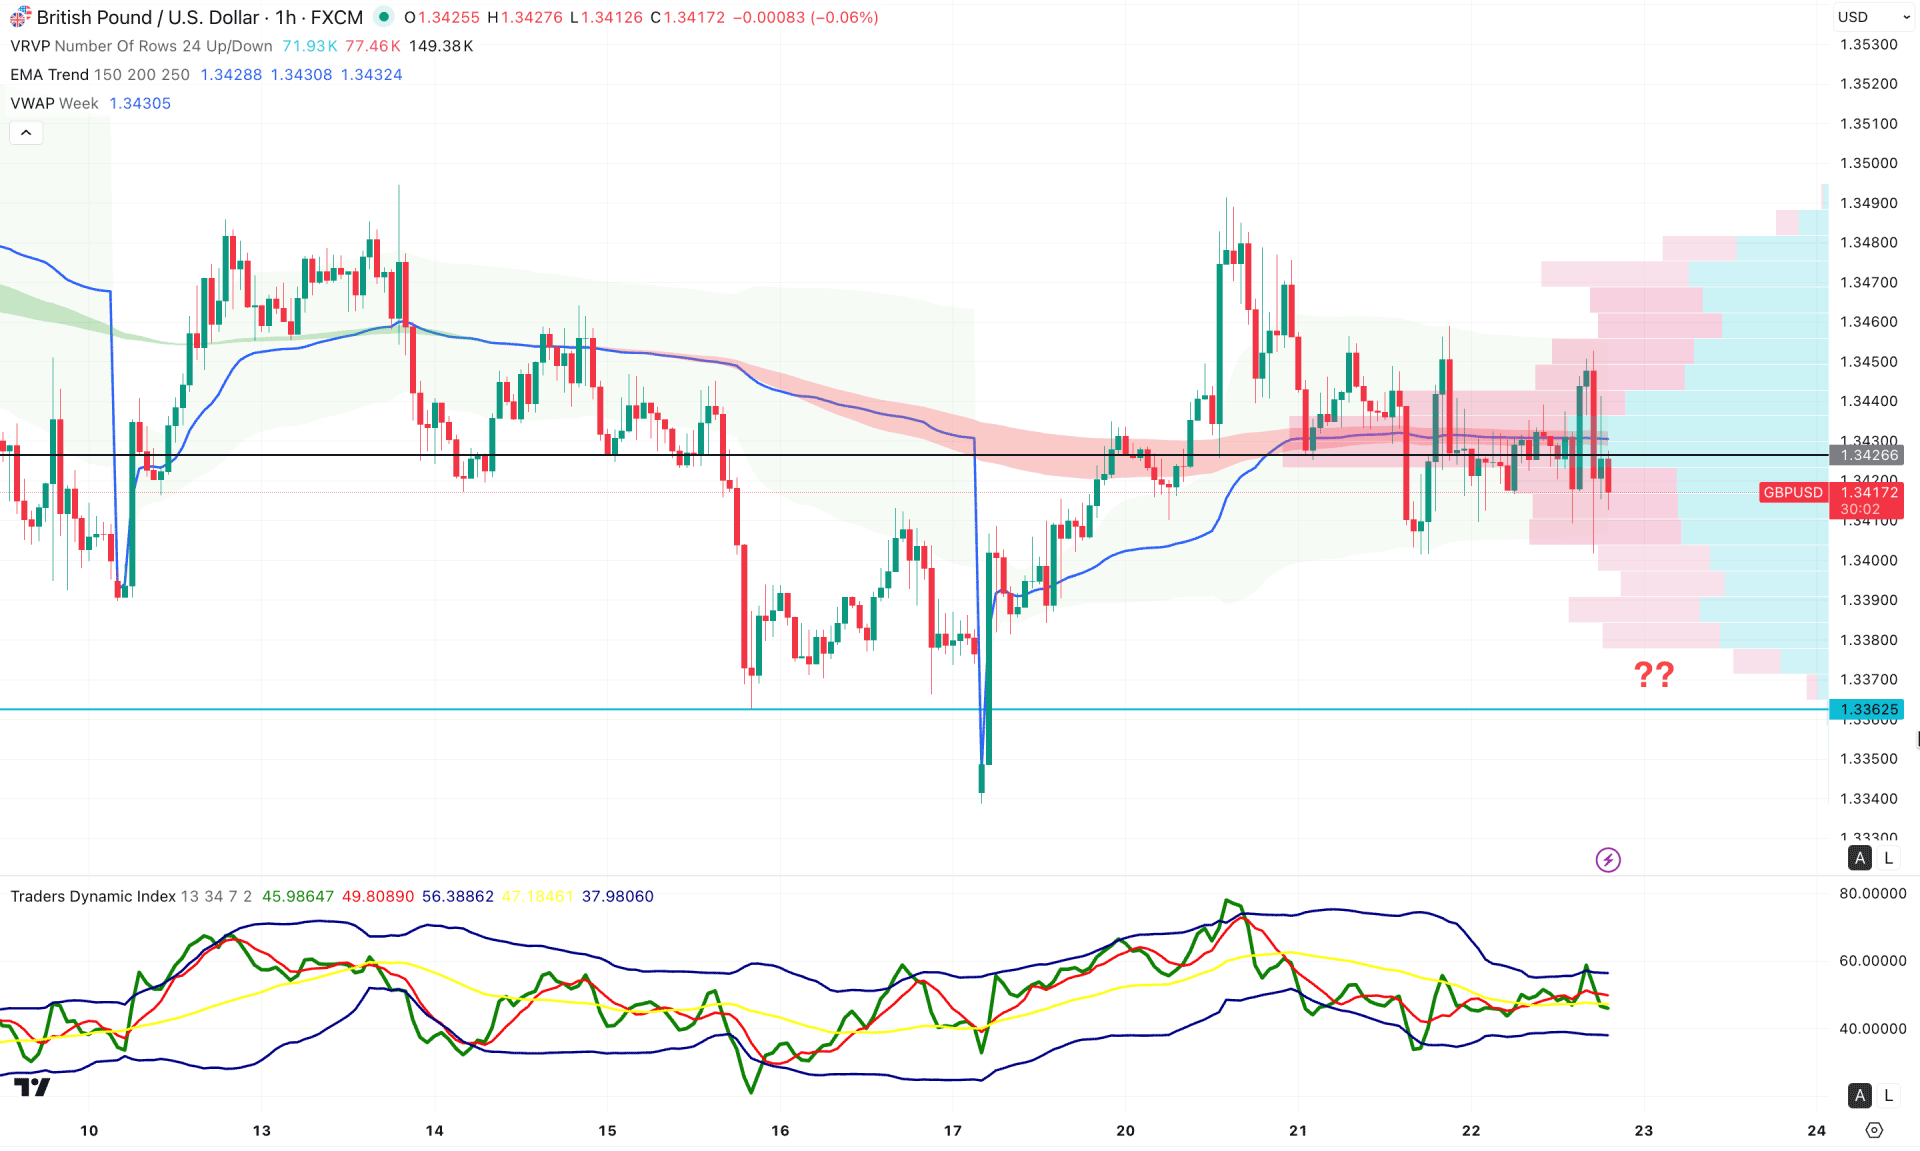
On the H1 timeframe, the price is exhibiting extremely volatile conditions due to geopolitical uncertainty. The high-volume node is positioned close to the current price, with a neutral reaction observed around the dynamic weekly VWAP level.
In the secondary indicator window, the Traders Dynamic Index (TDI) reflects a sideways structure, with both the upper and lower bands flattening. Additionally, the TDI line is hovering just below the 50 neutral level, indicating a lack of directional bias.
Based on this outlook, investors may wait for a bullish symmetrical triangle breakout. A sustained hourly close above the 1.3453 level would help validate the long opportunity.
On the other hand, a deeper correction toward the 1.3380 level remains possible. Any bullish reversal from the 1.3380–1.3340 support zone could offer a secondary long opportunity.
Overall, GBPUSD remains in a long-term bullish trend, although price action is currently consolidating within a descending channel. Investors should closely monitor how the price breaks out from the channel before following the primary bullish trend. Given the ongoing volatility, any downside correction toward a liquidity area could present a favorable buying opportunity.


