
Published: May 25th, 2021
GBPUSD bulls struggle to make gains while EURUSD and AUDUSD are showing a sign of further upside potentiality. In the intraday chart, EURUSD already made new highs while GBPUSD is struggling to remain at the most recent highs.
There might be two reasons behind the bearish sentiment in the GBPUSD. The first one is the Pound's weakness due to the Brexit issue on the Northern Ireland protocol. According to European Commission President Ursula von der, there are no changes to the signed agreement with London.
The second reason the UK Prime Minister Boris Johnson insists on custom checks in the Irish Sea contradicts the agreement. In that case, investors should see a settlement from both parties regarding the service sector to find a clear market trend from GBPUSD. Besides, there are rising coronavirus cases in the UK despite the fastest vaccination program and quick reopening of the economy.
On the other hand, the Federal Reserve’s message pointing out rising inflation may create further volatility in the price. In this market context, sellers may gain momentum with the hope of price depreciation. Let’s see the upcoming price direction from the GBPUSD technical analysis:
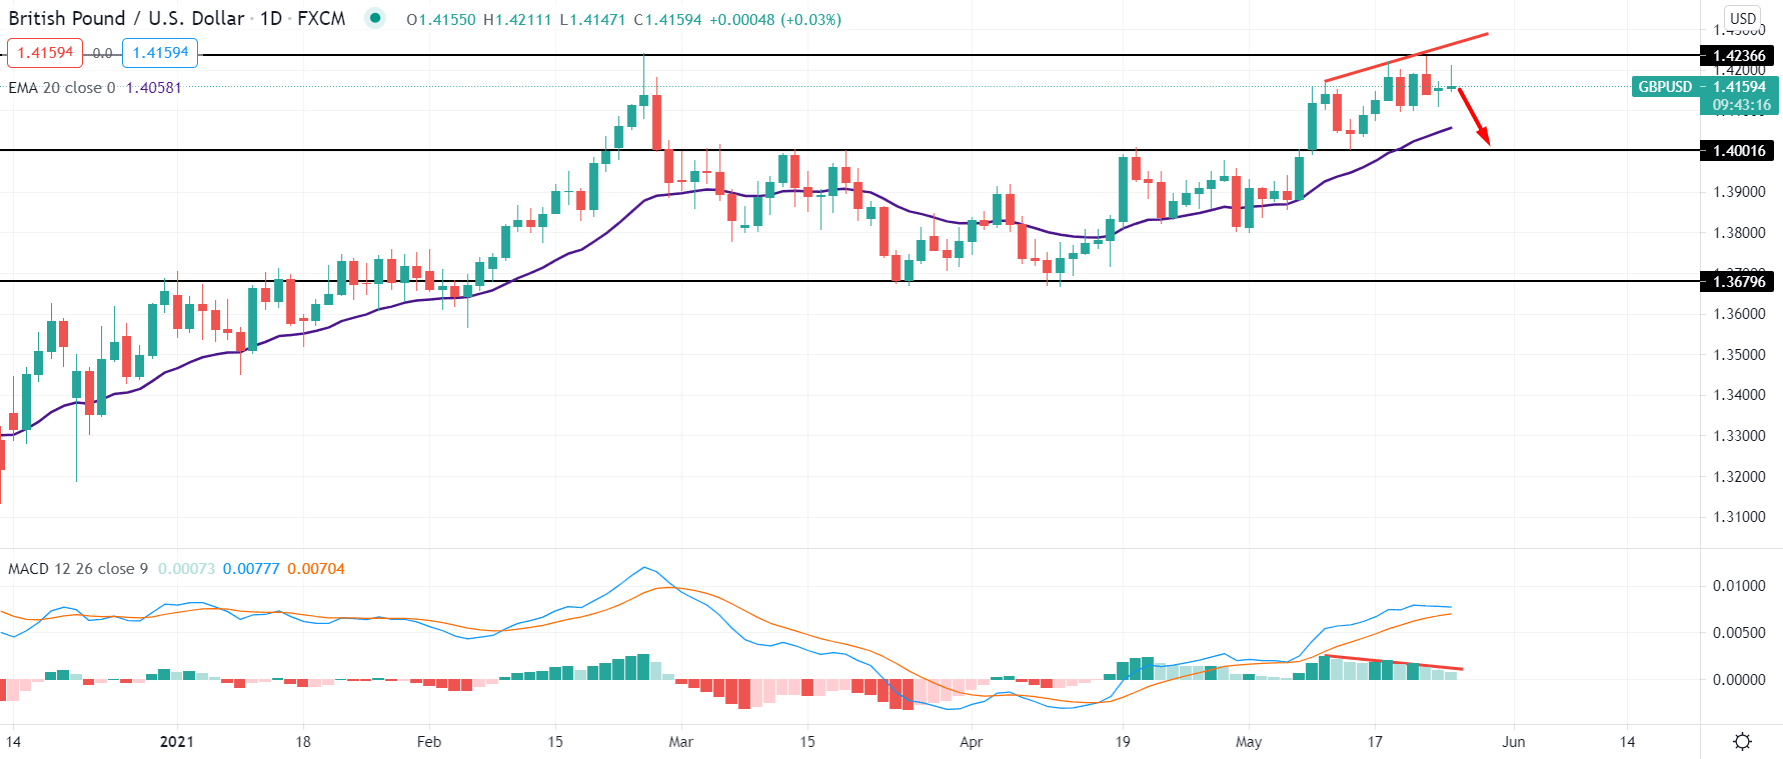
GBPUSD started to move higher as soon as it formed a double bottom pattern on 9 April 2021 that took the price straight to 1.4230 level with an impulsive bullish pressure.
However, based on the price action of the last five days, the price is highly volatile where buyers and sellers are fighting to take the price towards their direction.
The extreme volatility from a significant resistance with a hidden divergence with the MACD signifies that sellers’ may regain the momentum and take the price towards their direction.
In that case, a bearish daily close below the 1.4200 will increase the bearish possibility where the primary target would be towards the dynamic 20 EMA area at 1.4056.
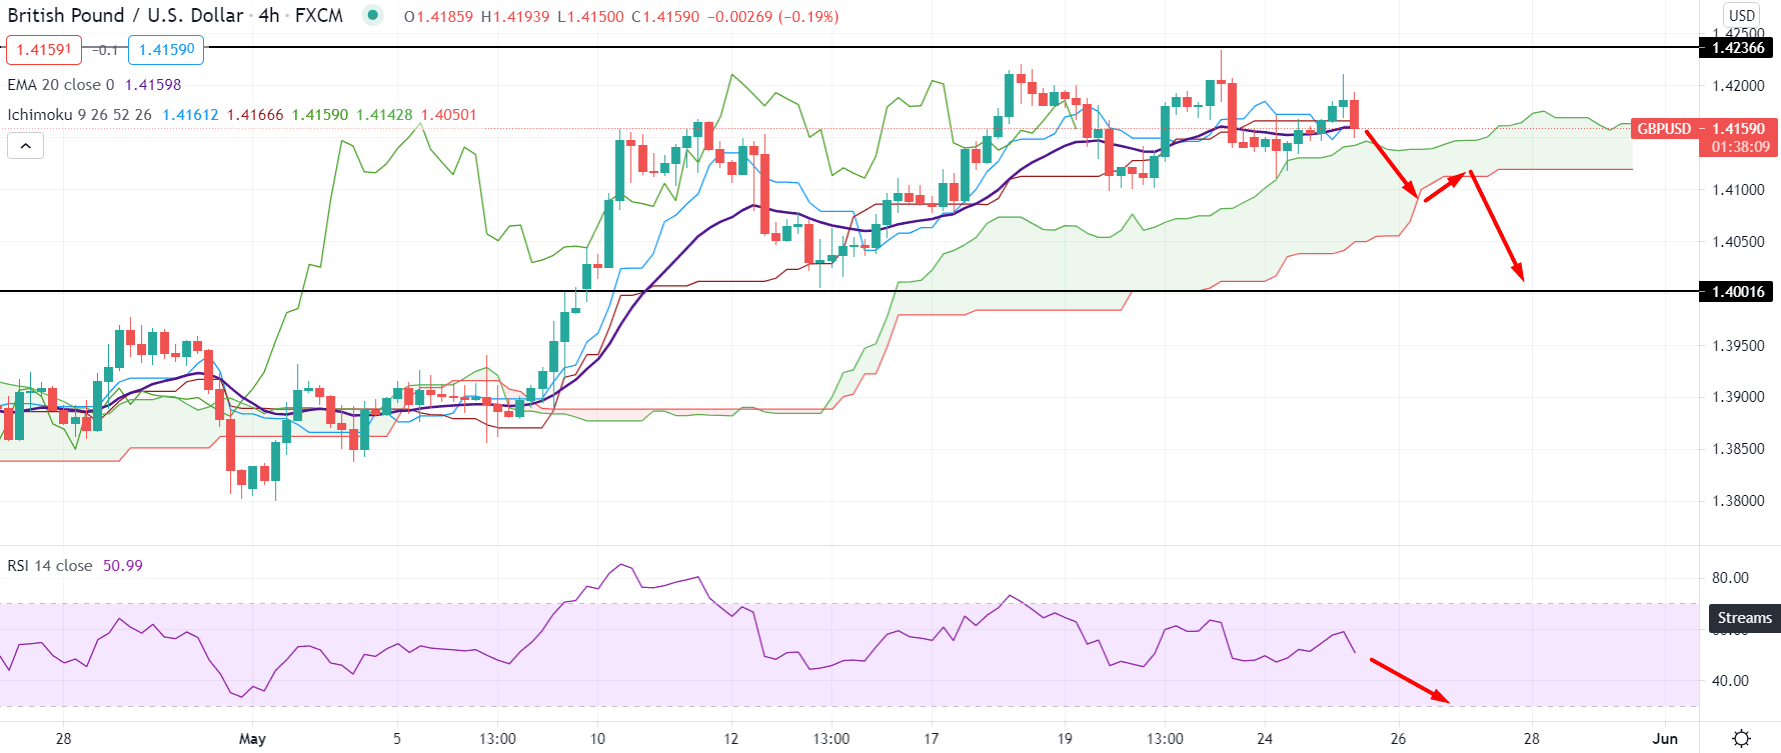
In the H4 chart, the price is highly volatile above the Kumo Cloud, where there are multiple failures to make new highs to the price. Moreover, Senkou Span A and Senkou Span B remained flat at the future cloud, stating that the price is going through an incisive momentum.
In the above image, we can see the H4 chart of GBPUSD where the Tenkan Sen and Kijun Sen are squeezing to the price, pointing out no specific direction. Moreover, the Chikou Span is within the price and pointing lower.
In this market condition, any decisive breakthrough below the Kumo Cloud may initiate a solid bearish trend where the primary target would be a 1.4000 support level followed by the selling pressure from the RSI.
On the other hand, the price is still above the Kumo Cloud and any strong bounce back from the Cloud support with a new high above the 1.4211 level with an H4 close may invalidate the current bearish price action and continue the bullish run above the 1.4230 resistance level.
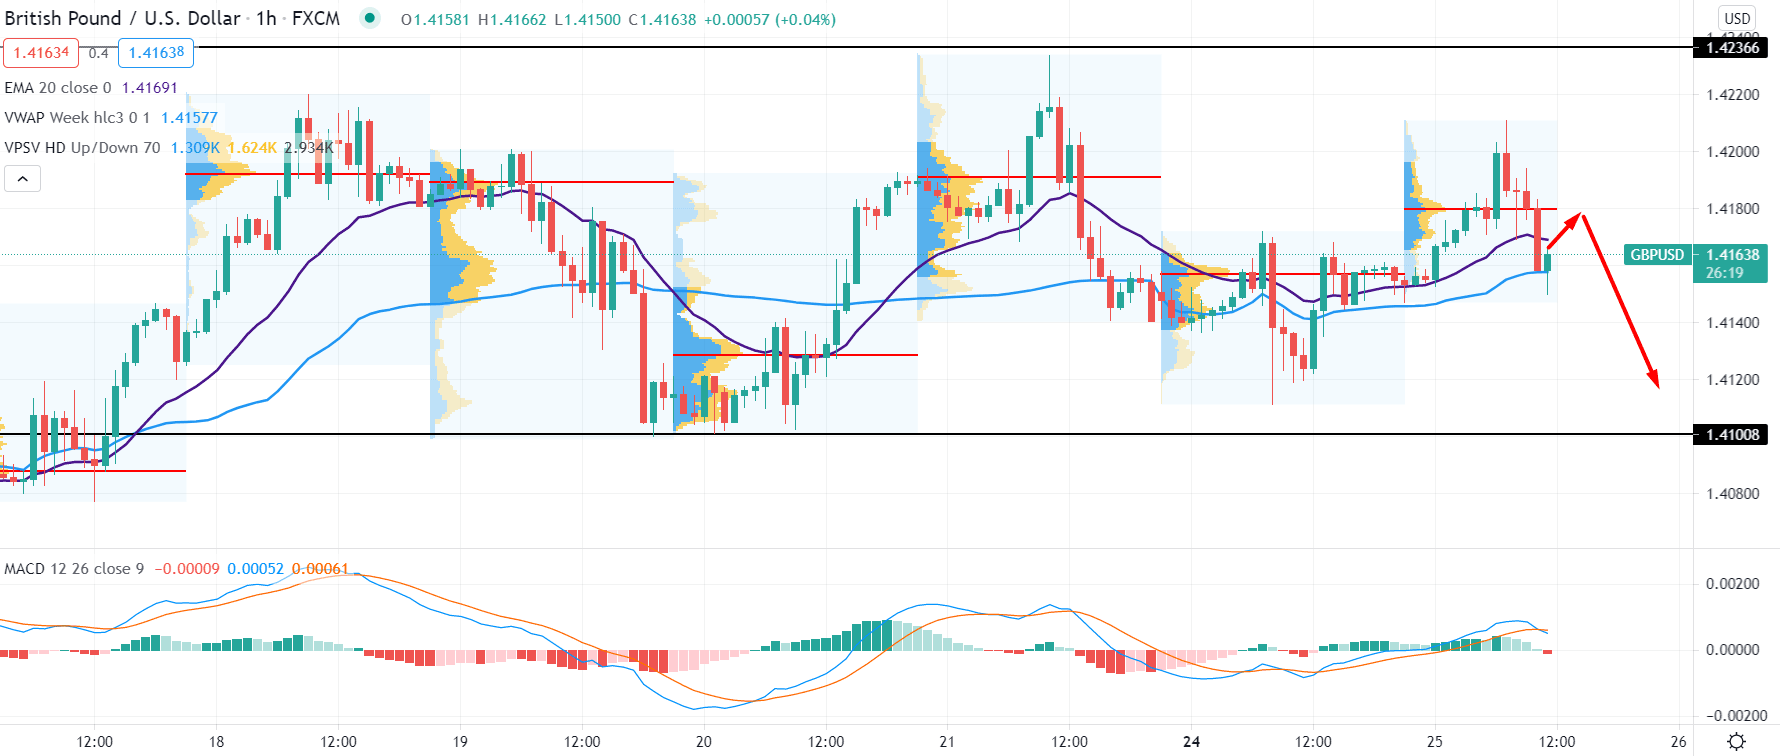
In the intraday chart, GBPUSD is trading within the range between 1.4236 and 1.4100 levels with no specific direction. In that case, any substantial breakthrough above or below these levels may provide a clear direction to the price.
We can see no consecutive high or low in the intraday high volume levels in the above image, but the current price moved below the most recent high volume levels with strong bearish pressure. On the other hand, the price is getting support from the dynamic 20 EMA and weekly vwap level, increasing the bullishness to the price.
As long as the price is trading below the intraday high volume level of 1.4180, any strong bearish H1 close below the dynamic vwap would increase the bearish possibility in the price with the target of 1.4100. Moreover, MACD moved below the zero levels, and any new low in the Histogram would increase the bearish possibility.
On the other hand, if the price rejects the intraday high volume level and closes above the 1.4180 with a solid bullish H1 close, it may move higher above the 1.4230 level.
As of the above discussion, we can say that the GBPUSD has a higher possibility to move lower as it is trading within extreme volatility from the resistance level. The ultimate target of the bearish pressure will be towards the 1.4000 and 1.3679 levels.
Conversely, the price is still above the Kumo Cloud in H4 and getting dynamic support from vwap in the H1. Therefore a strong bullish H4 close above the 1.4211 may resume the current long-term bullish trend.


