
Published: April 1st, 2025
The British pound (GBP) trades near the 1.2900 area against the US dollar (USD). As market players wait for US President Donald Trump to announce reciprocal tariffs, which are anticipated to be disclosed on "Liberation Day" Wednesday, the pair remains indecisive.
As part of his continued efforts to rectify the trade imbalances, President Trump could put tariffs on nations with significant trade surpluses against the US.
In an interview, US Treasury Secretary Scott Bessent said that Americans will soon see a move toward "fair trade," which aims to make the international trade system more equal for US workers.
Investors are mostly concerned with the reaction of US trading partners to President Trump's probable additional tariffs. It is anticipated that nations like China, the Eurozone, Canada, Japan, and Mexico will be greatly impacted by these levies. Any retaliation from these countries might lead to a worldwide trade war, which would be bad for economic growth everywhere, including the US. This is because US importers would bear the additional duties.
Investors are also monitoring various US economic data this week, such as reports on the job market and business sector, which will affect their expectations of the Federal Reserve's (Fed) monetary policy.
Market participants will digest the US PMI figures for March on Tuesday. The ISM Manufacturing PMI is projected to drop to 49.5 from 50.3 in February, while the revised S&P Global Manufacturing PMI will stay stable at the preliminary level of 49.8. A number below 50.0 indicates a decline in activity within the manufacturing sector.
Let's see the complete price outlook from the GBPUSD technical analysis:
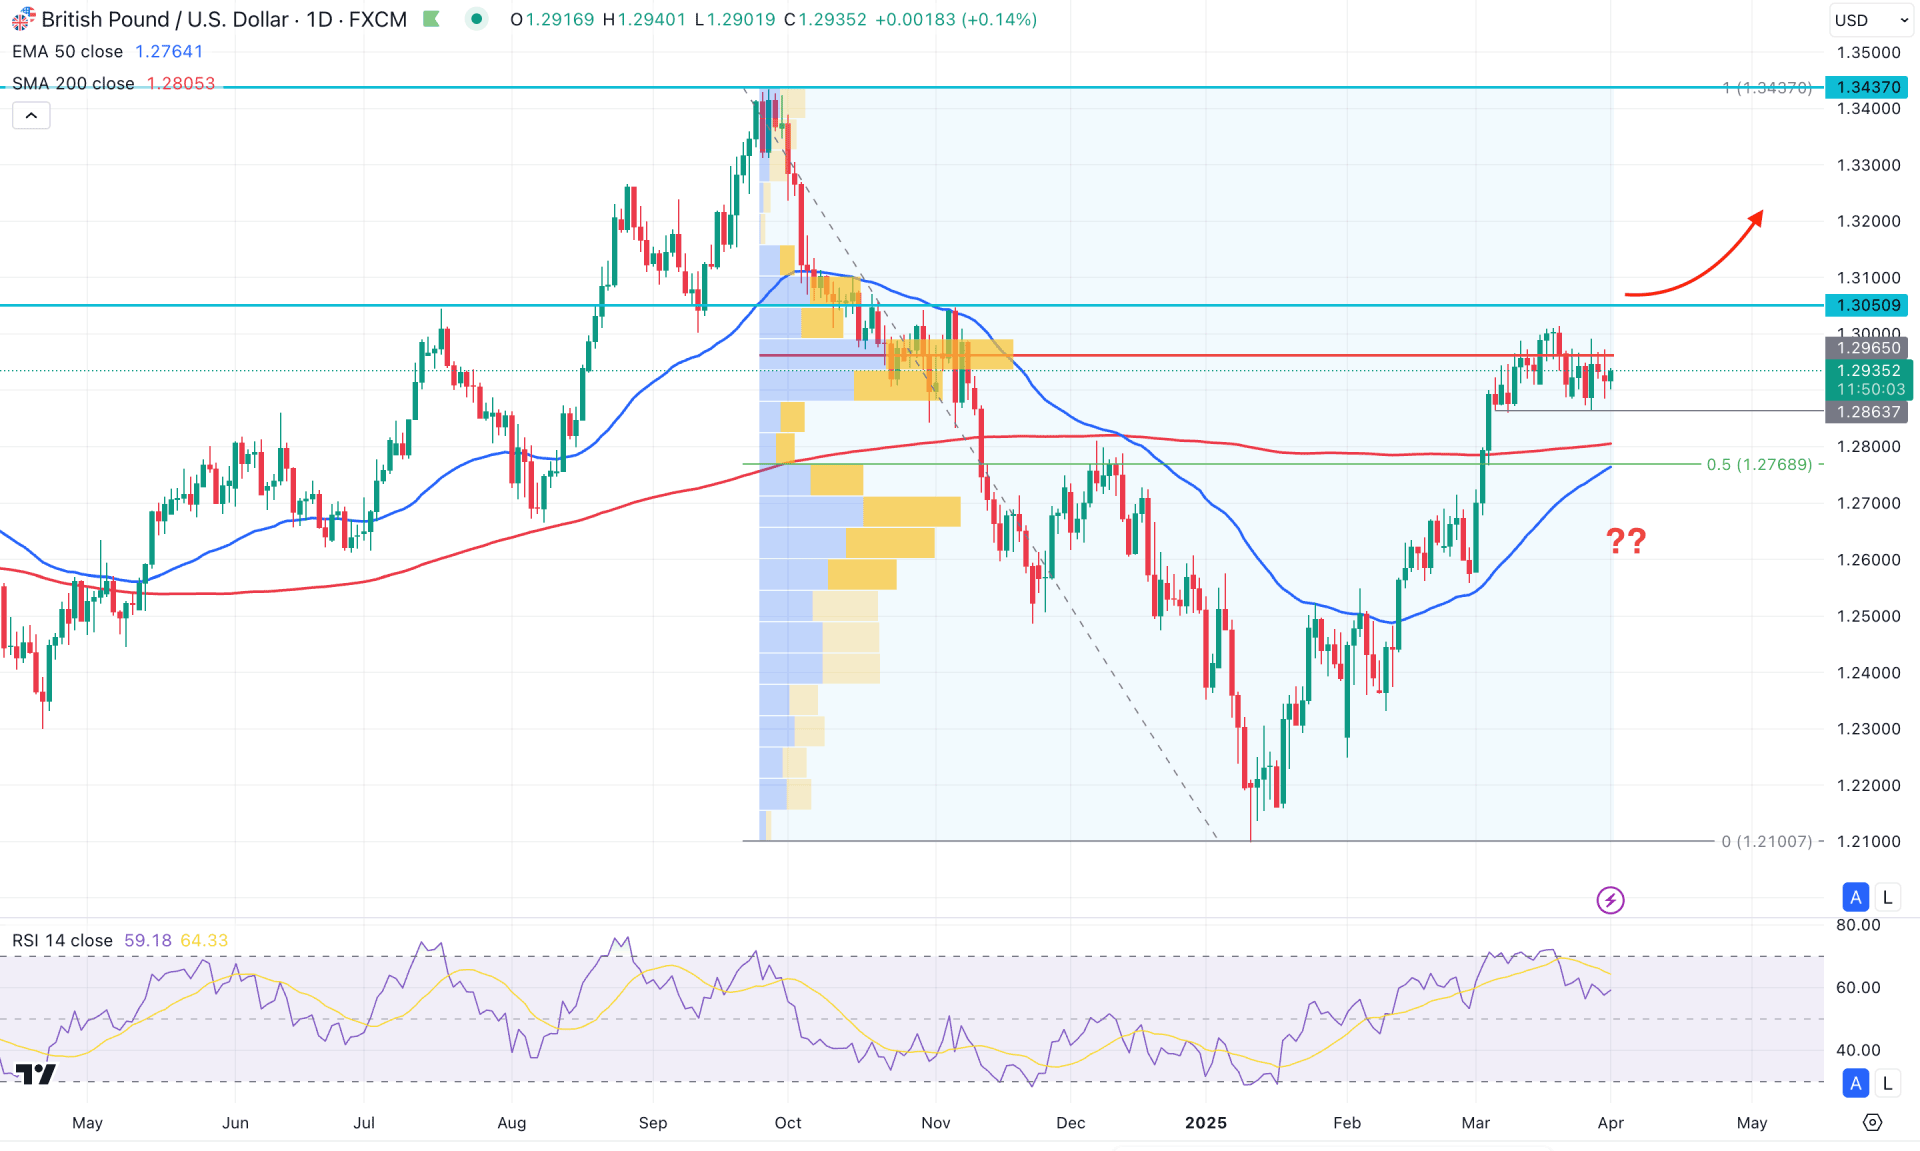
In the daily chart of GBPUSD, the recent price action shows a bullish recovery from the 52-week low, suggesting a decent recovery from a crucial liquidity zone. However, the bearish wave from the October 2024 high still has potential, as the price remains above the 50% Fibonacci retracement level.
Looking at the volume structure, the highest activity level since October 2024 is at the 1.2965 level, which is just above the current price. Moreover, the ongoing price action has been corrective since March 6, 2025, suggesting a potential range breakout. In this case, a bearish breakout supported by high-volume resistance could present a potential short opportunity from a premium zone.
On the other hand, the 200-day Simple Moving Average is below the current price and acting as support. The 50-day Exponential Moving Average is following the same momentum, remaining below the current price with a bullish slope. As long as both dynamic indicators are below the current price, investors need a valid bearish breakout before anticipating any short move.
Based on the daily market outlook for GBPUSD, a bullish continuation is highly possible after overcoming the high-volume line. A daily candle close above this line could present a potential opportunity to target the 1.3200 psychological level.
Although the high-volume line acts as resistance, several barriers exist on the bearish side. In this case, a bearish break below the 50-day Exponential Moving Average with consolidation would validate a rebound from the premium zone. If this happens, the price may extend selling pressure and reach the 1.2400 level as a primary support level.
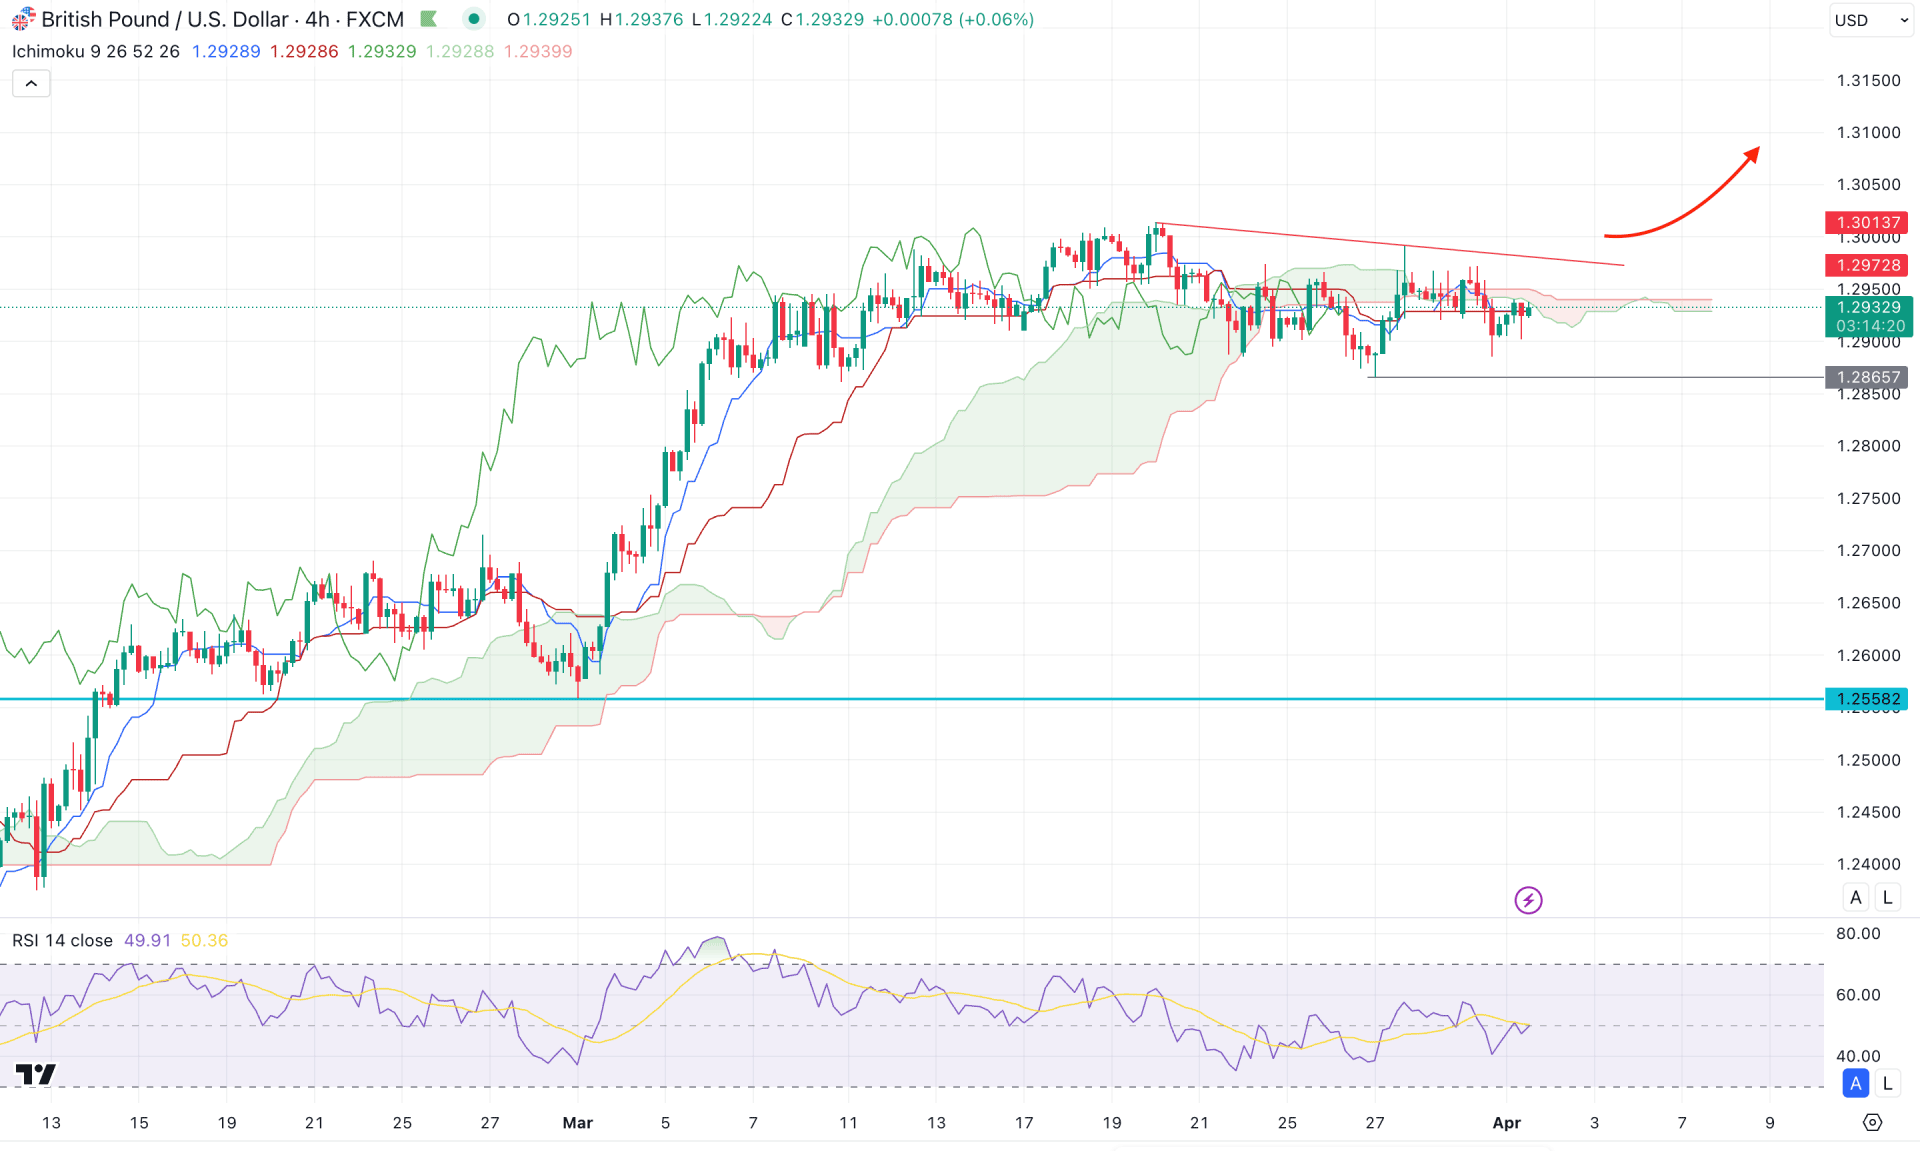
In the four-hour timeframe, the recent price shows a bullish breakout with continuation above the cloud support. However, the most recent price action has become sideways, creating multiple violations from the cloud. In the future, the Senkou Span A remains above the Senkou Span B, signaling indecision on the medium-term trend.
In the secondary indicator window, the Relative Strength Index (RSI) remains sideways at the 50.00 neutral point, with no sign of divergence.
Based on the current market outlook, a local bullish breakout with a four-hour candle above the 1.3000 psychological level could present a high-probability long opportunity on an intraday basis.
On the other hand, the current price is traded in the premium zone over a higher time frame. In this case, any bullish pressure above the medium-term resistance with an immediate recovery could signal a valid liquidity sweep. If that happens, selling pressure might follow after breaking below the cloud and consolidating below the 1.2866 support level.
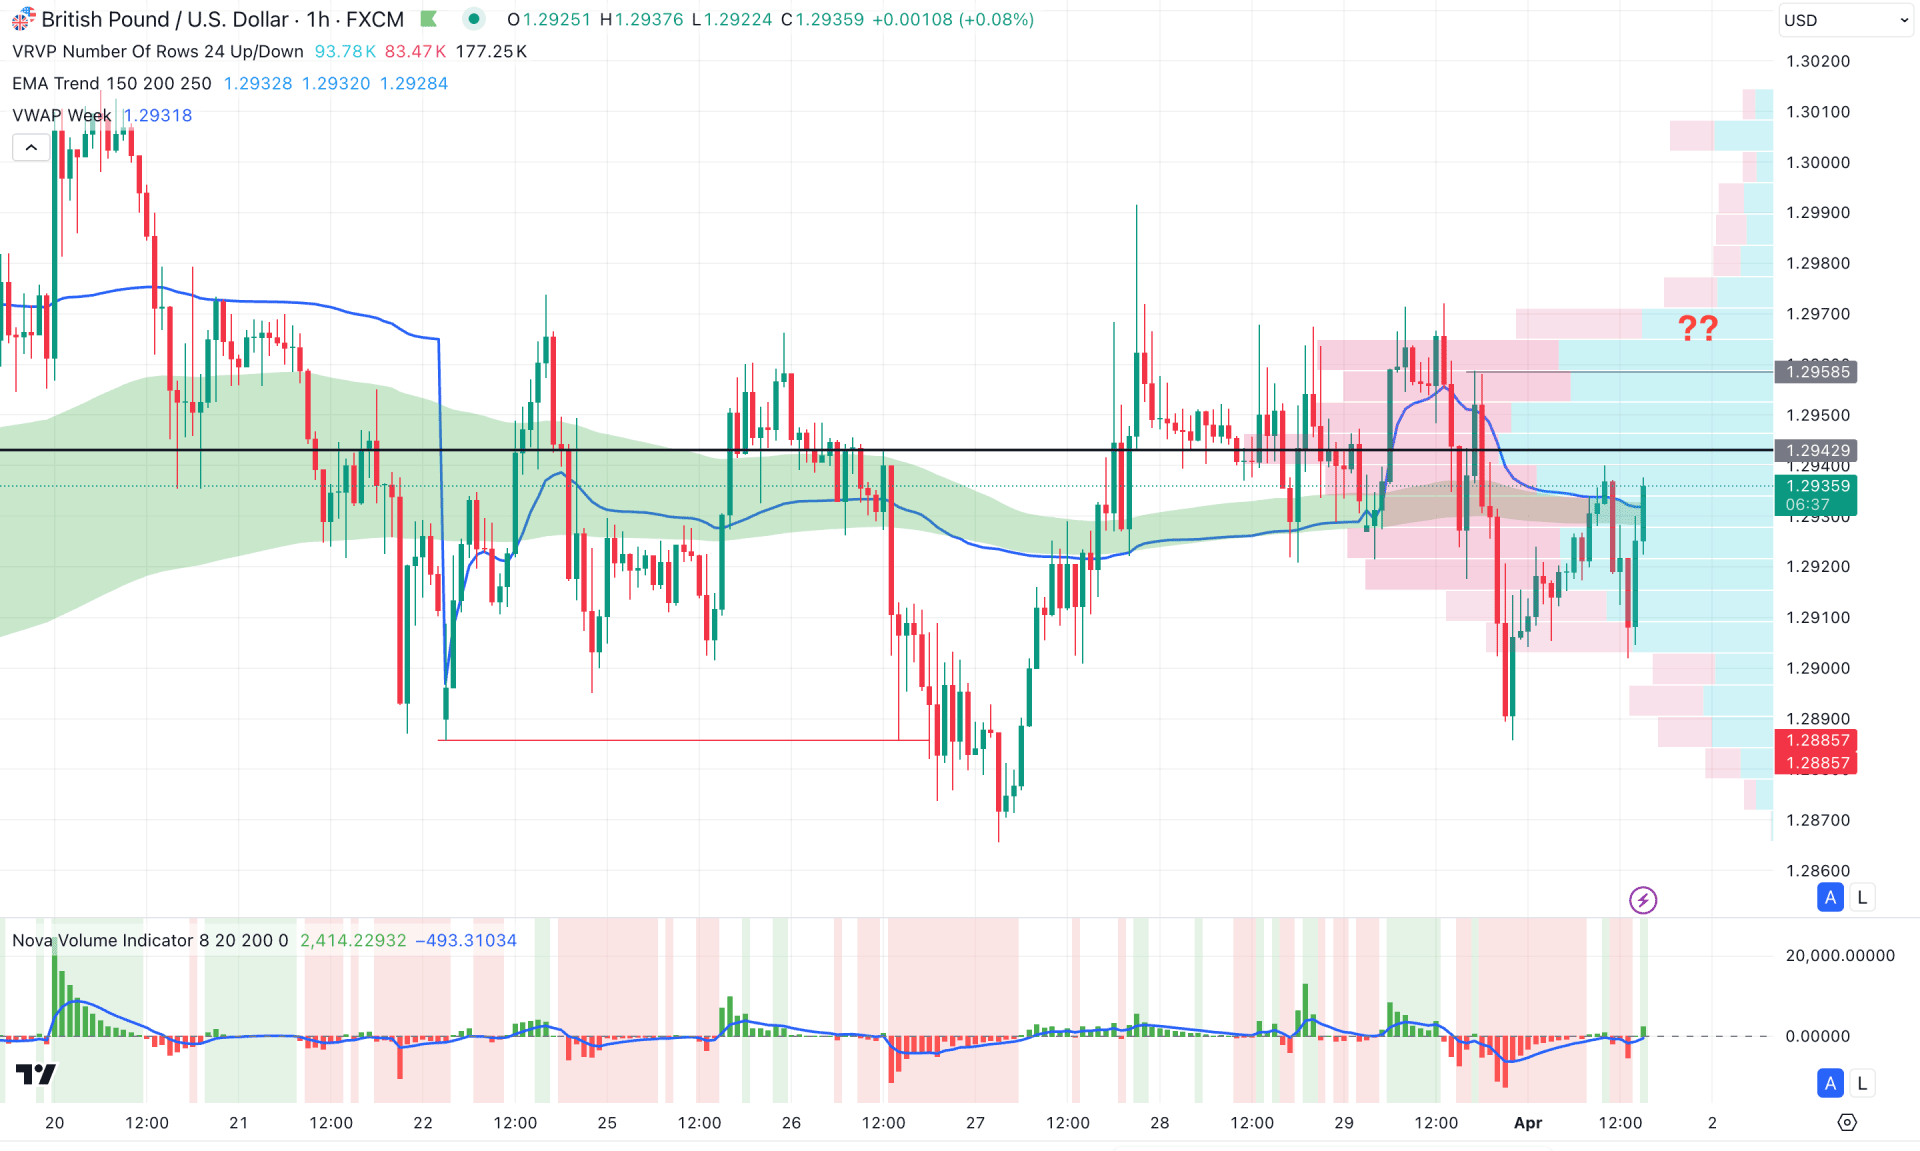
In the hourly time frame, a wide range of consolidation is visible, as the recent price shows multiple violations of the swing high and swing low. The high level of volatility signals indecision from a fundamental perspective, which may require a breakout after establishing a clear trend.
The EMA wave is closer to the current price and is acting as resistance, which is in line with the weekly VWAP level. Additionally, the high-volume area in the price is above the moving average and acts as major resistance.
Based on this outlook, investors should wait for a valid bullish breakout with stable market conditions above the 1.2986 level, which could validate a long opportunity.
On the other hand, a bearish continuation may appear after finding a valid shift from the resistance area.
Based on the current market outlook, GBP/USD is more likely to extend bullish pressure and create a swing high from the current consolidation area. On the other hand, any bullish exhaustion from the premium zone, with a valid recovery below the daily dynamic line, could reverse the market momentum and initiate a bearish continuation.


