
Published: June 19th, 2024
A report from the United Kingdom's Office for National Statistics (ONS) on Wednesday indicated a decline in price pressures, as anticipated for May, and the Pound Sterling (GBP) ascended above the 1.2700 resistance level. For the first time in over three years, the UK's annual headline inflation surpassed the central bank's 2% target, a decrease from the 2.3% recorded in April. Furthermore, the core Consumer Price Index (CPI), which excludes volatile food and energy prices, decreased from 3.9% to 3.5%.
The monthly headline inflation rate increased consistently by 0.3%, slightly lower than the anticipated 0.4%. The report also emphasized a substantial increase in the annual Producer Price Index (PPI) for Core Output, which increased by 1.0% in May compared to the 0.3% increase in the previous month.
Bank of England (BoE) policymakers may continue to be hesitant to discuss early rate cuts even though the annual headline CPI has decreased to 2%. This is because annual service inflation has only experienced a minor decline. The inflation rate in the service sector increased by 5.7%, which is slightly lower than the previous rate of 5.9%. However, it is still higher than the anticipated rate of 5.5% and nearly double the level required to manage price pressures.
The Bank of England's monetary policy decision, scheduled for Thursday, will be the next significant event for the Pound Sterling. It is generally anticipated that the Bank of England will maintain the interest rate at 5.25%. Consequently, investors will closely monitor the vote division and any new indications regarding the BoE's potential interest rate reductions.
In the meantime, there are two noteworthy aspects regarding US economic data. The Mortgage Bankers Association will disclose its Mortgage Application data for the week of June 14. This release is significant because it had been in decline for several weeks until a sudden 15.6% increase the previous week.
Let's see the further aspect of this currency pair from the GBPUSD technical analysis:
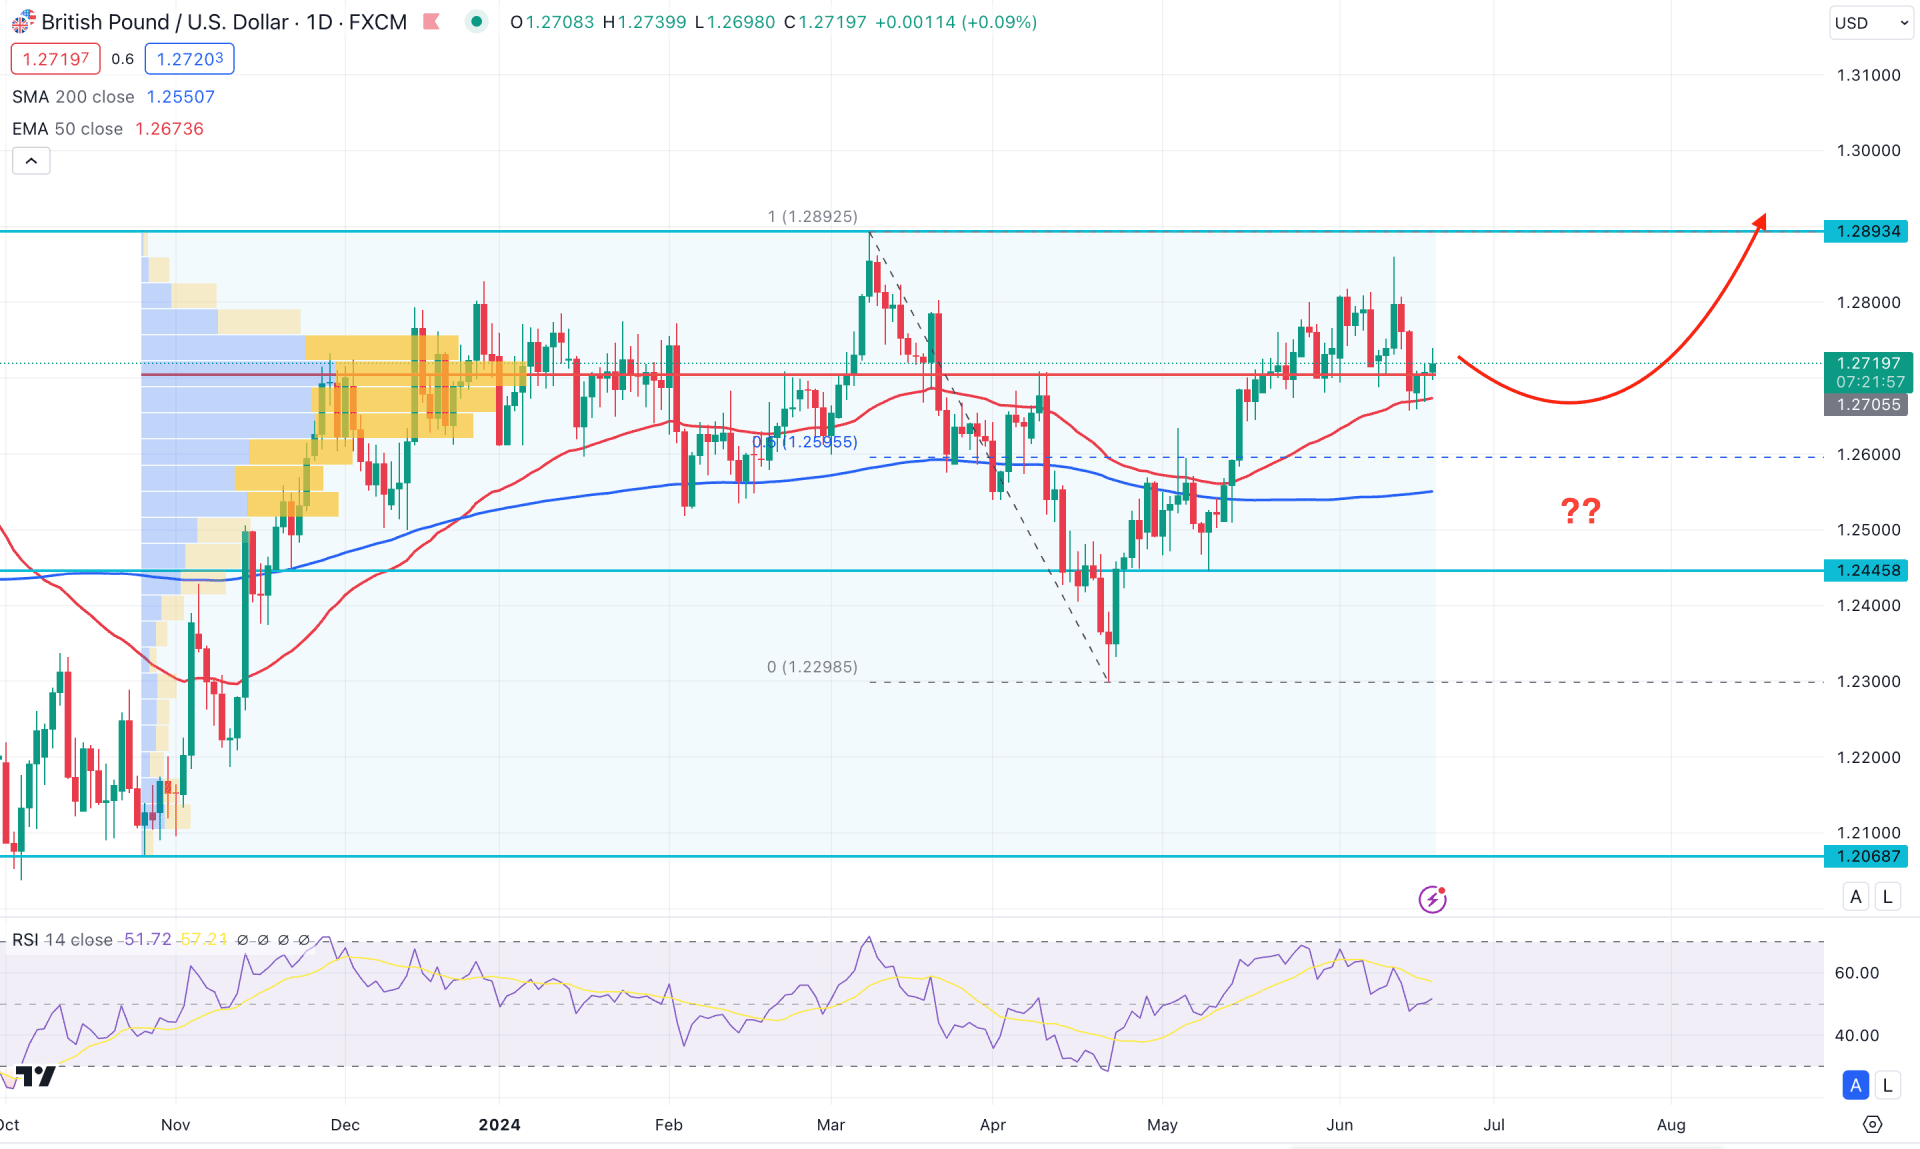
In the daily chart of GBPUSD, the recent price shows consolidation with buying pressure returning from the 1.2300 support level. As the current price trades above the 50% retracement level from the 1.2892 high to the 1.2298 low, we can expect active buyers to be present in the market.
In the broader context, the 50-day simple moving average is below the current price, while the 50-day exponential moving average acts as immediate support. This indicates a golden cross continuation, considered a bullish continuation setup, as long as the price remains above the 50-day moving average.
In the volume structure, the most active level since November 2023 is closer to the current price. Additionally, there is congestion in the current price zone, which may serve as a strong accumulation phase. Therefore, a stable market needs a breakout from the 1.2893 high to the 1.2705 low zone before forming an impulsive trend.
In the main price chart, the bullish pressure from the 1.2298 level has become corrective without violating the 1.2892 high. This indicates that a sufficient bullish liquidity sweep is pending, which could push the price above the recent swing high.
In the indicator window, the 14-day Relative Strength Index (RSI) has become sideways after tapping the 70.00 overbought line. This suggests that a sideways market needs sufficient correction before forming bullish strength.
Based on the daily market outlook for GBPUSD, investors should closely monitor how fundamental releases affect the market. Positive results for the UK could act as a bullish continuation signal. In that case, a daily candle above the 1.2893 high would activate a bullish continuation toward the 1.3000 level.
On the bearish side, the ongoing volatile market structure might extend downside pressure towards the 200-day SMA line. A bearish daily candle below the 200-day SMA could challenge the bulls and potentially lower the price towards the 1.2300 area.
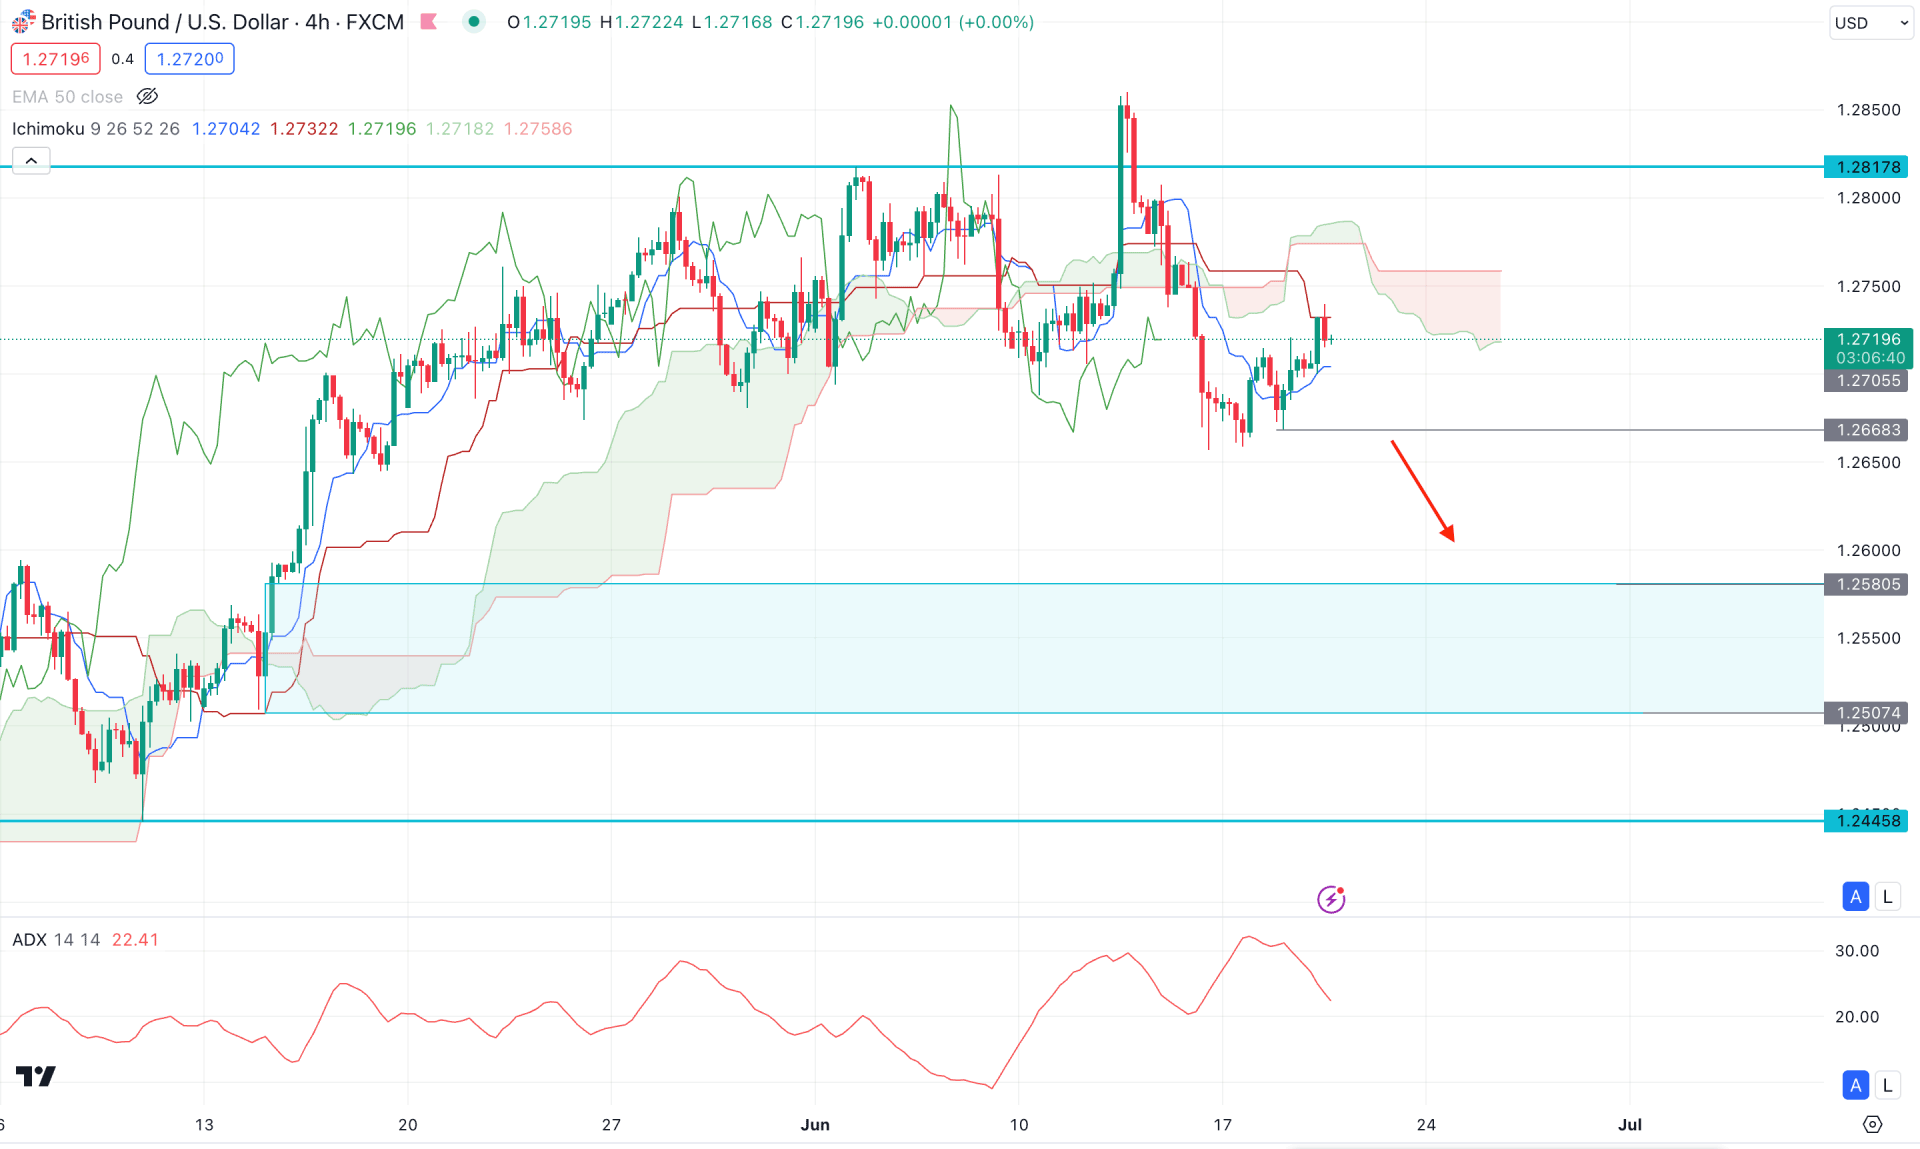
In the H4 timeframe, the recent price action shows a bullish liquidity sweep from the 1.2817 level, which might work as a strong bearish signal. Moreover, a downside break below the Ichimoku cloud low creates an additional bearish signal, while the future cloud is supportive of bears.
Looking at the indicator window, the Average Directional Index (ADX) reached a peak of 31.00 and then declined. However, the ADX line still remains above the 20.00 level, which is considered a satisfactory signal indicating a buyers' zone. In this case, any bullish rebound from the 20.00 level could present a trend trading opportunity, whereas sellers have a higher possibility of winning from the recent bearish cloud breakout.
Based on the H4 price structure, investors need to wait for a bearish 4-hour candle below the 1.2668 level before activating a downside continuation signal. In that case, the price is more likely to move down and test the 1.2580 to 1.2507 imbalance zone.
On the bullish side, any immediate buying pressure that drives the market above the cloud zone would provide an early sign of a daily bullish breakout. In that case, the ultimate target would be to take the price above the 1.3000 psychological line.
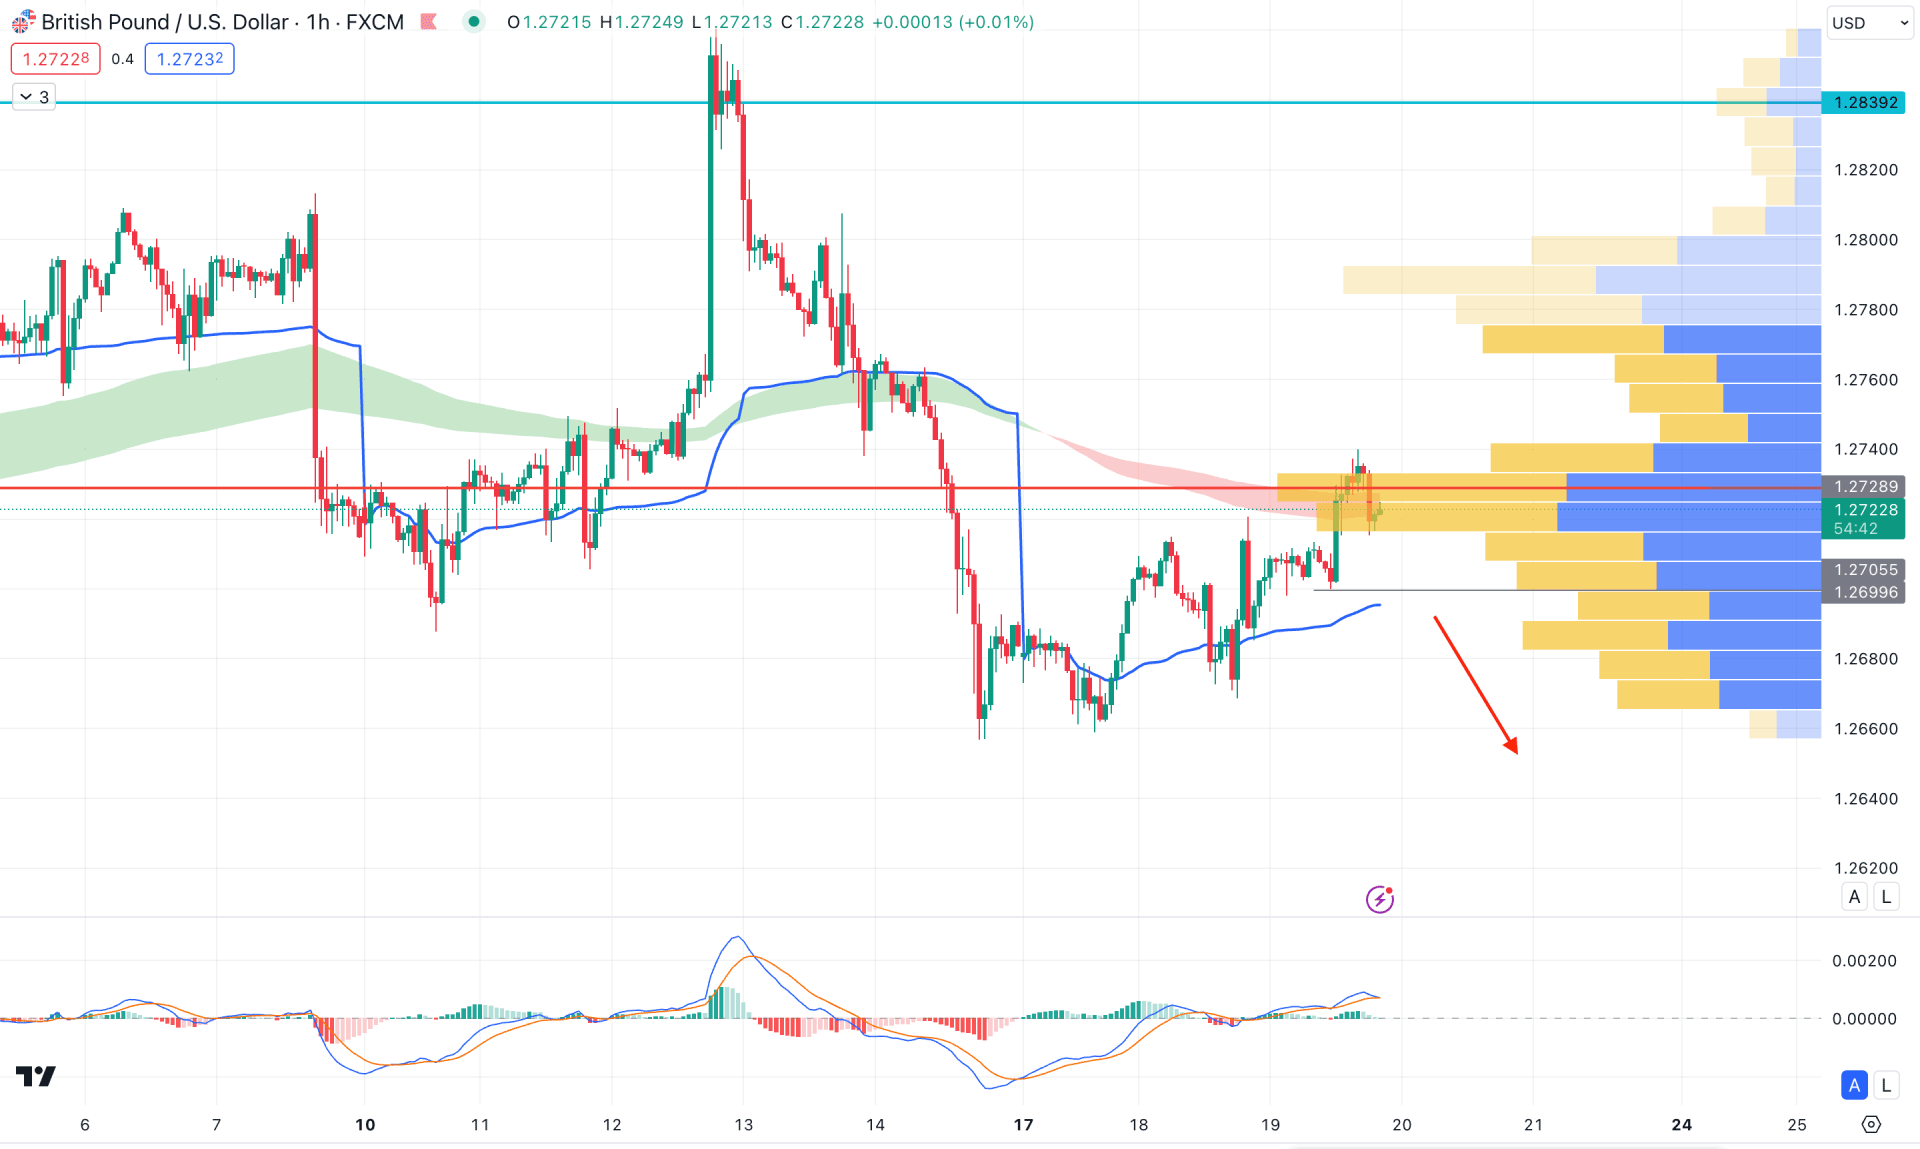
In the hourly chart, the recent price trades are indecisive as the visible range high volume level is above the current price, while the weekly VWAP is acting as a support.
Moreover, the Moving Average wave from 150 to 250 MA is closer to the current price, suggesting resistance. In that case, a valid breakout is needed in this pair before aiming for a stable trend on either side.
In the secondary window, the MACD Histogram became flat at the neutral point, while the signal line formed a bearish crossover. In that case, a valid bearish H4 candle below the 1.2699 low could activate a high probable short opportunity, aiming for the 1.2620 level.
On the bullish side, a violation of the high volume line with consolidation above the 1.2760 level could extend the upward pressure toward the 1.3000 area.
Based on the ongoing market outlook, GBPUSD has a higher possibility of forming a breakout from the current consolidation zone. Before finding a stable direction, investors should monitor the BoE's upcoming interest rate decision. As the ongoing buying pressure is evident from the 1.2300 area, a bullish breakout could offer a high-probability trend trading opportunity.


