
Published: April 4th, 2024
For the fifth consecutive day, the GBPNZD sustained its downside pressure. The statistical Month-on-Month data for Seasonally Adjusted Building Permits in New Zealand exhibited a noteworthy improvement in February, with a substantial surge of 14.9%, reversing the preceding decline of 8.6%.
However, the Reserve Bank of New Zealand (RBNZ) warned about continuing headline inflation beyond the target range of 1% to 3%. Participants in the market anxiously await the RBNZ's policy meeting, which is scheduled for the following week. Furthermore, investors are beginning to express apprehensions regarding the possible economic consequences of Wednesday's 7.2 magnitude earthquake in Taiwan. This is specifically concerning the supply chain for semiconductors in New Zealand.
After twenty consecutive months of contraction, the UK Manufacturing PMI unexpectedly rose in March, propelled by robust domestic demand. Business optimism in the United Kingdom has reached its greatest point since April 2023, as 58% of manufacturers expect production levels to increase within the next 12 months, bolstered by robust factory data.
Moreover, house prices in the United Kingdom increased by 1.6% in March, the fastest growth rate since December 2022, suggesting that the real estate industry remained resilient in the face of historically elevated interest rates.
Let's see the further aspect of this currency pair from the GBPNZD technical analysis:
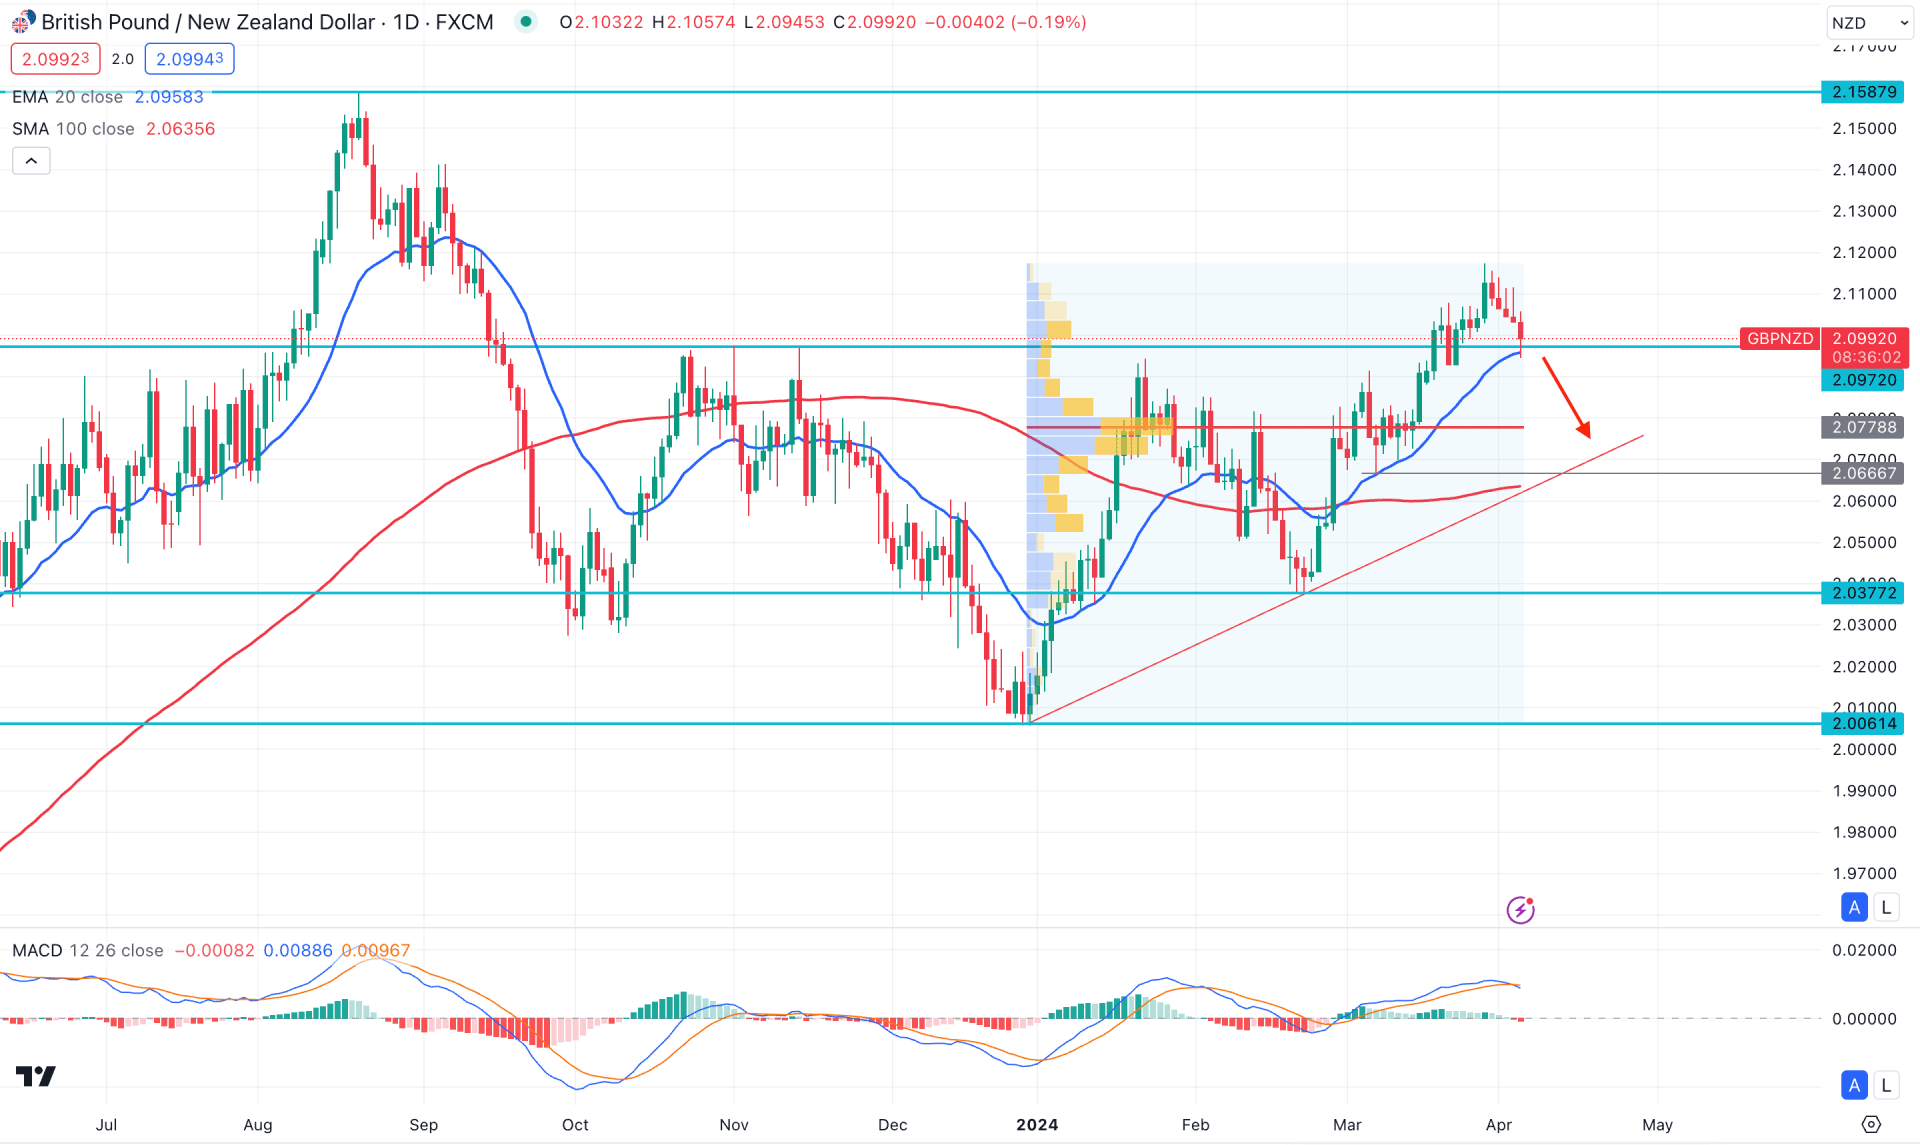
In the daily chart of GBPNZD, ongoing buying pressure is visible where the current price hovers above the 2.0972 event level. Although the buying pressure is potent above dynamic lines, a significant downward correction is pending as a mean reversion.
According to the Fixed Range Volume Profile indicator, a larger accumulation is seen at the 2.0778 level, which is below the current price. Based on this line, bulls are still active in the market for the last 3 months. Therefore, any bullish opportunity in the intraday chart provides a higher success rate.
In the higher timeframe, the monthly candlestick suggests a bullish continuation after an in-decision in March. However, the existing price is supported by a bullish engulfing pattern from the 2.0061 low, which signals a pending downside correction before continuing the ongoing bullish trend.
In the daily chart, the possibility of a downside continuation is clear, as the recent price shows a recovery after setting a new high at the 2.1175 level. However, the 2.0972 event level is still protected, while the dynamic 20-day EMA works as a confluence support at that line. It is a sign that short-term bulls are still active in the market and can rebound at any time.
In the broader context, the gap between the current price and the dynamic 100-day SMA has expanded, which creates a greater possibility of having a downside correction as a mean reversion.
Based on the daily market outlook of GBPNZD, downside pressure could come after having a bearish daily candle below the dynamic 20-day EMA line. However, the long-term bullish trend is valid because of the rising 100-day SMA with a trend line support. In that case, any bullish pressure from the 2.0778 to 2.0650 area could resume the existing trend, targeting the 2.1580 area.
The alternative approach is to look for a valid bearish pressure below the trendline support, where a daily close at the 2.0600 level could work as a bearish signal, targeting the 2.0377 support level.
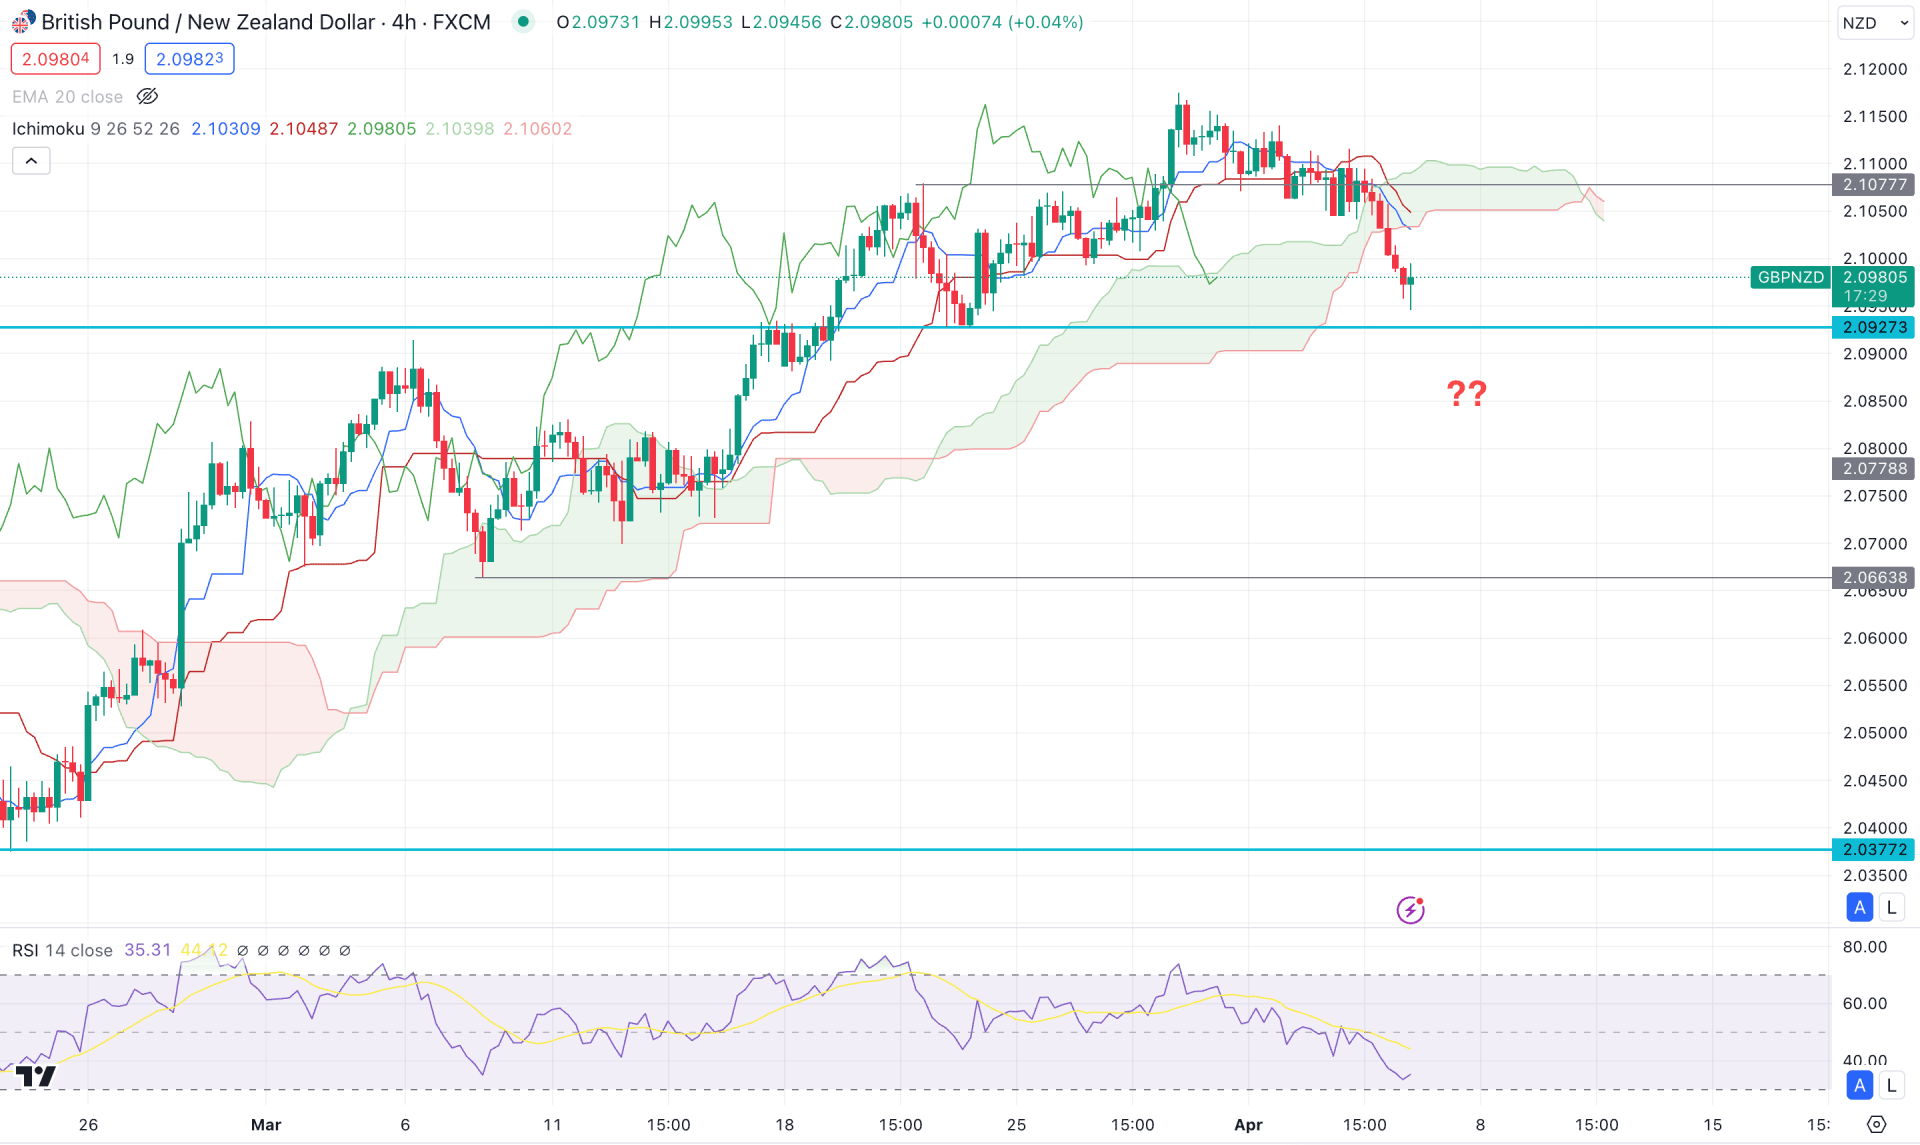
In the H4 chart, a bearish break is visible with the Ichimoku Cloud, where the recent price trades below the dynamic Kijun Sen line with an H4 close. Moreover, the Tenkan Sen and Kijun Sen lines are above the current price, working as a resistance, while the future cloud has shifted its direction from bullish to bearish.
In the indicator window, the Relative Strength Index (RSI) shows a downside pressure as the current hovers at the 40.00 level. As the 30.00 level is not touched yet, we may expect another downside continuation before forming a bullish signal.
Based on this outlook, an immediate buying pressure from the current area could resume the existing trend. In that case, an H4 close above the 2.1100 level could be a high probable bullish opportunity, targeting the 2.1400 level.
The alternative approach is to wait for another push below the 2.0927 support level. A valid bearish pressure below this line with an H4 close could signal a downside possibility, targeting the 2.0663 support level.
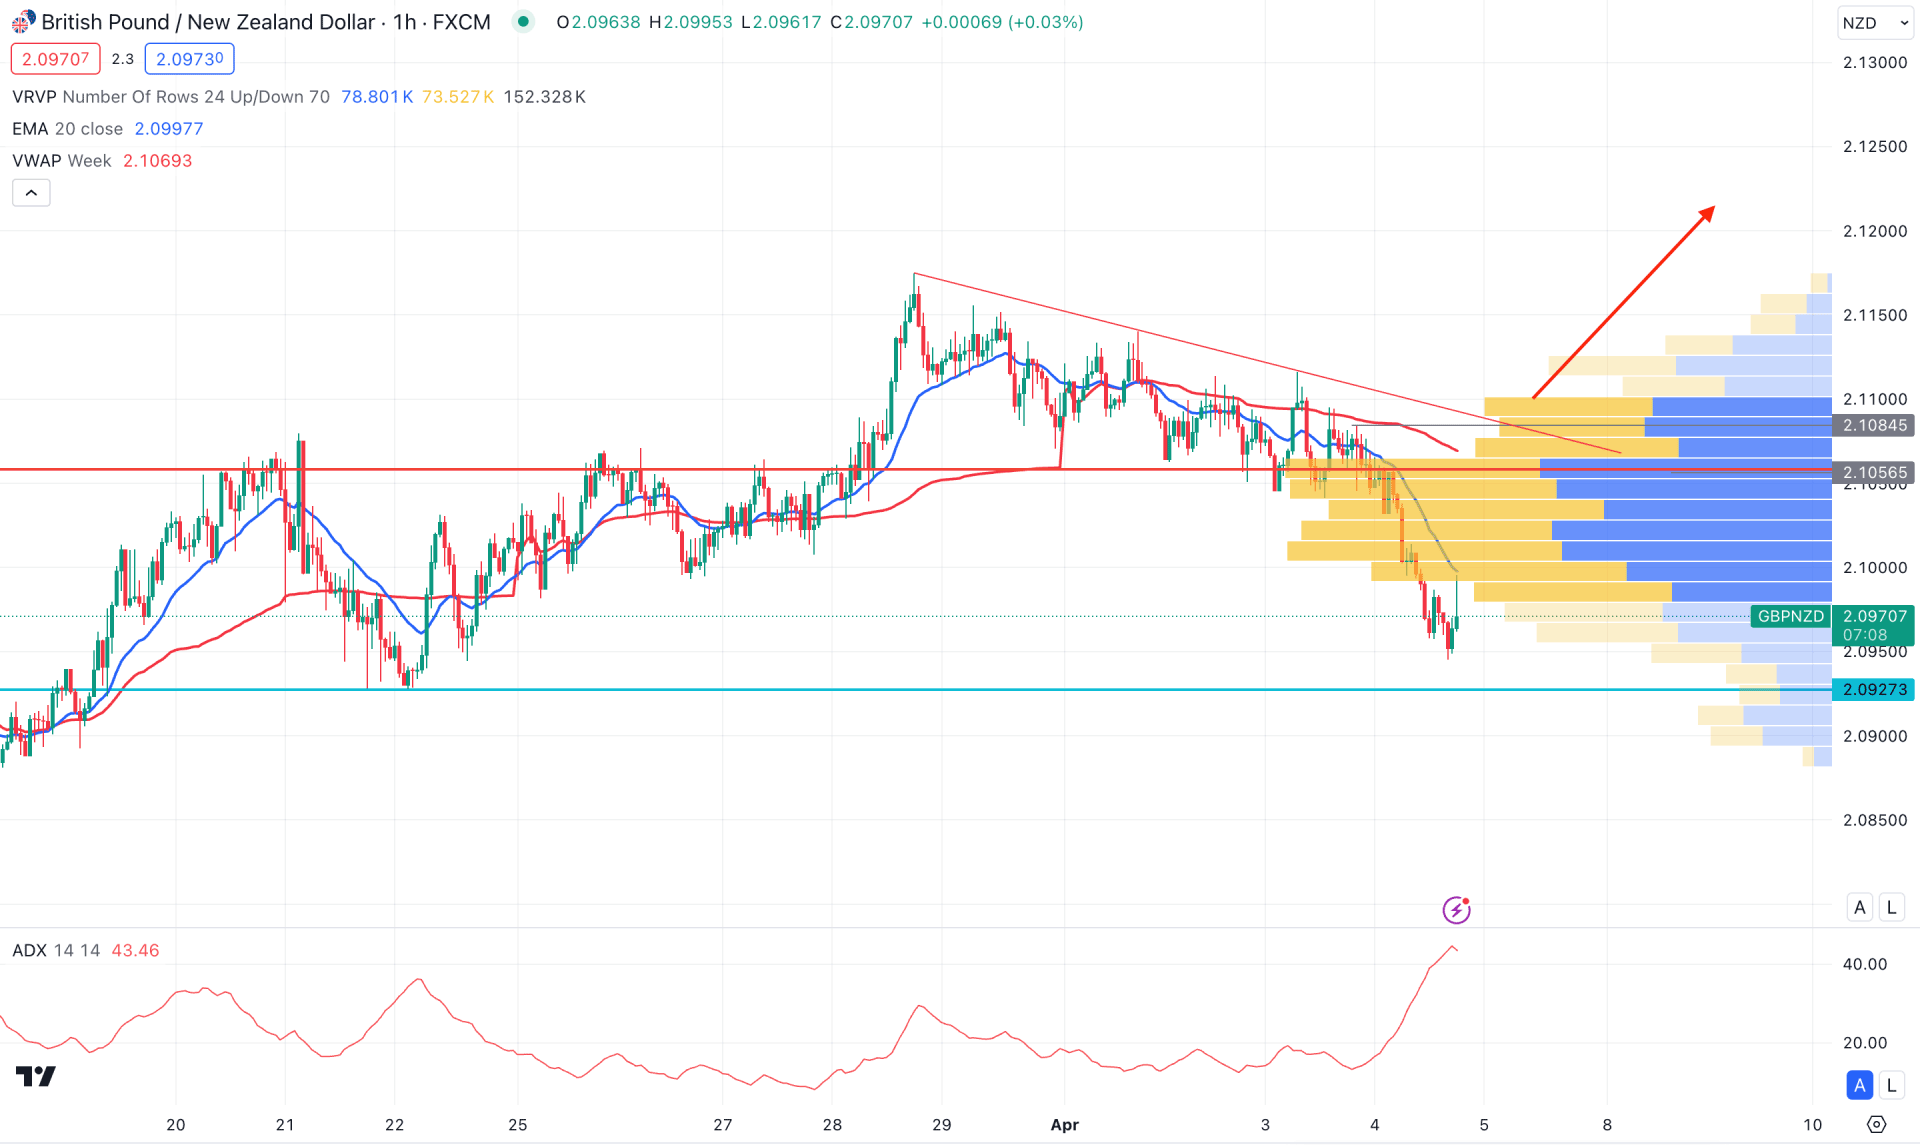
In the H1 chart, a bearish continuation is visible, where the recent price hovers below the dynamic weekly VWAP resistance. However, a gap with the VWAP line suggests a bullish correction as a mean reversion. Moreover, the intraday high volume level is at the 2.1056 level, which suggests sellers' presence in the market.
The Average Directional Index (ADX) line is above the 40.00 area, which is signaling a peak of a bearish trend.
Based on this outlook, elimination of the current bearish pressure with a valid bullish H1 candle above the trendline resistance could activate a long opportunity following the daily trend.
On the other hand, investors should closely monitor how the price reacts at the 2.0927 static support, as a bullish reversal from this level could be another long signal.
Based on the market outlook of GBPNZD, bulls have a higher possibility of taking control over the price, where a valid rebound from the event level could be a potential long opportunity. However, investors might find another long opportunity after having a deeper correction below the dynamic 20 day EMA line.


