Published: October 31st, 2024
The GBPNZD pair fell from its crucial high after the announcement of the UK budget, causing the GBP to decline slightly.
According to a recent report, the new Labour government of the UK unveiled its inaugural budget on Wednesday. The budget includes tax increases of £40 billion to close a gap in the public offers and fund public service investments.
An increase in the amount managers pay in National Insurance (NI), a form of tax on earnings, is one policy anticipated to generate the most sales for the UK Treasury.
An ANZ bank survey found that business confidence in New Zealand increased more in October, compared to 60.9 in September to 65.7. Although confidence has improved, the markets anticipate that the Reserve Bank of New Zealand (RBNZ) will lower its Official Cash Rate (OCR) by 75 bps in next month's policy-making meeting. As a result, the Kiwi may decline in value relative to the US dollar.
According to the National Bureau of Statistics (NBS) most recent data, China's manufacturing PMI increased from 49.8 in September to 50.1 in October on Thursday. This number was higher than the 50.0 prediction. The NBS Non-Manufacturing PMI, on the other hand, increased to 50.2 in October from 50.0 previously, falling short of the consensus of 50.4.
Let's see the upcoming price direction of this pair from the GBPNZD multi-timeframe analysis:

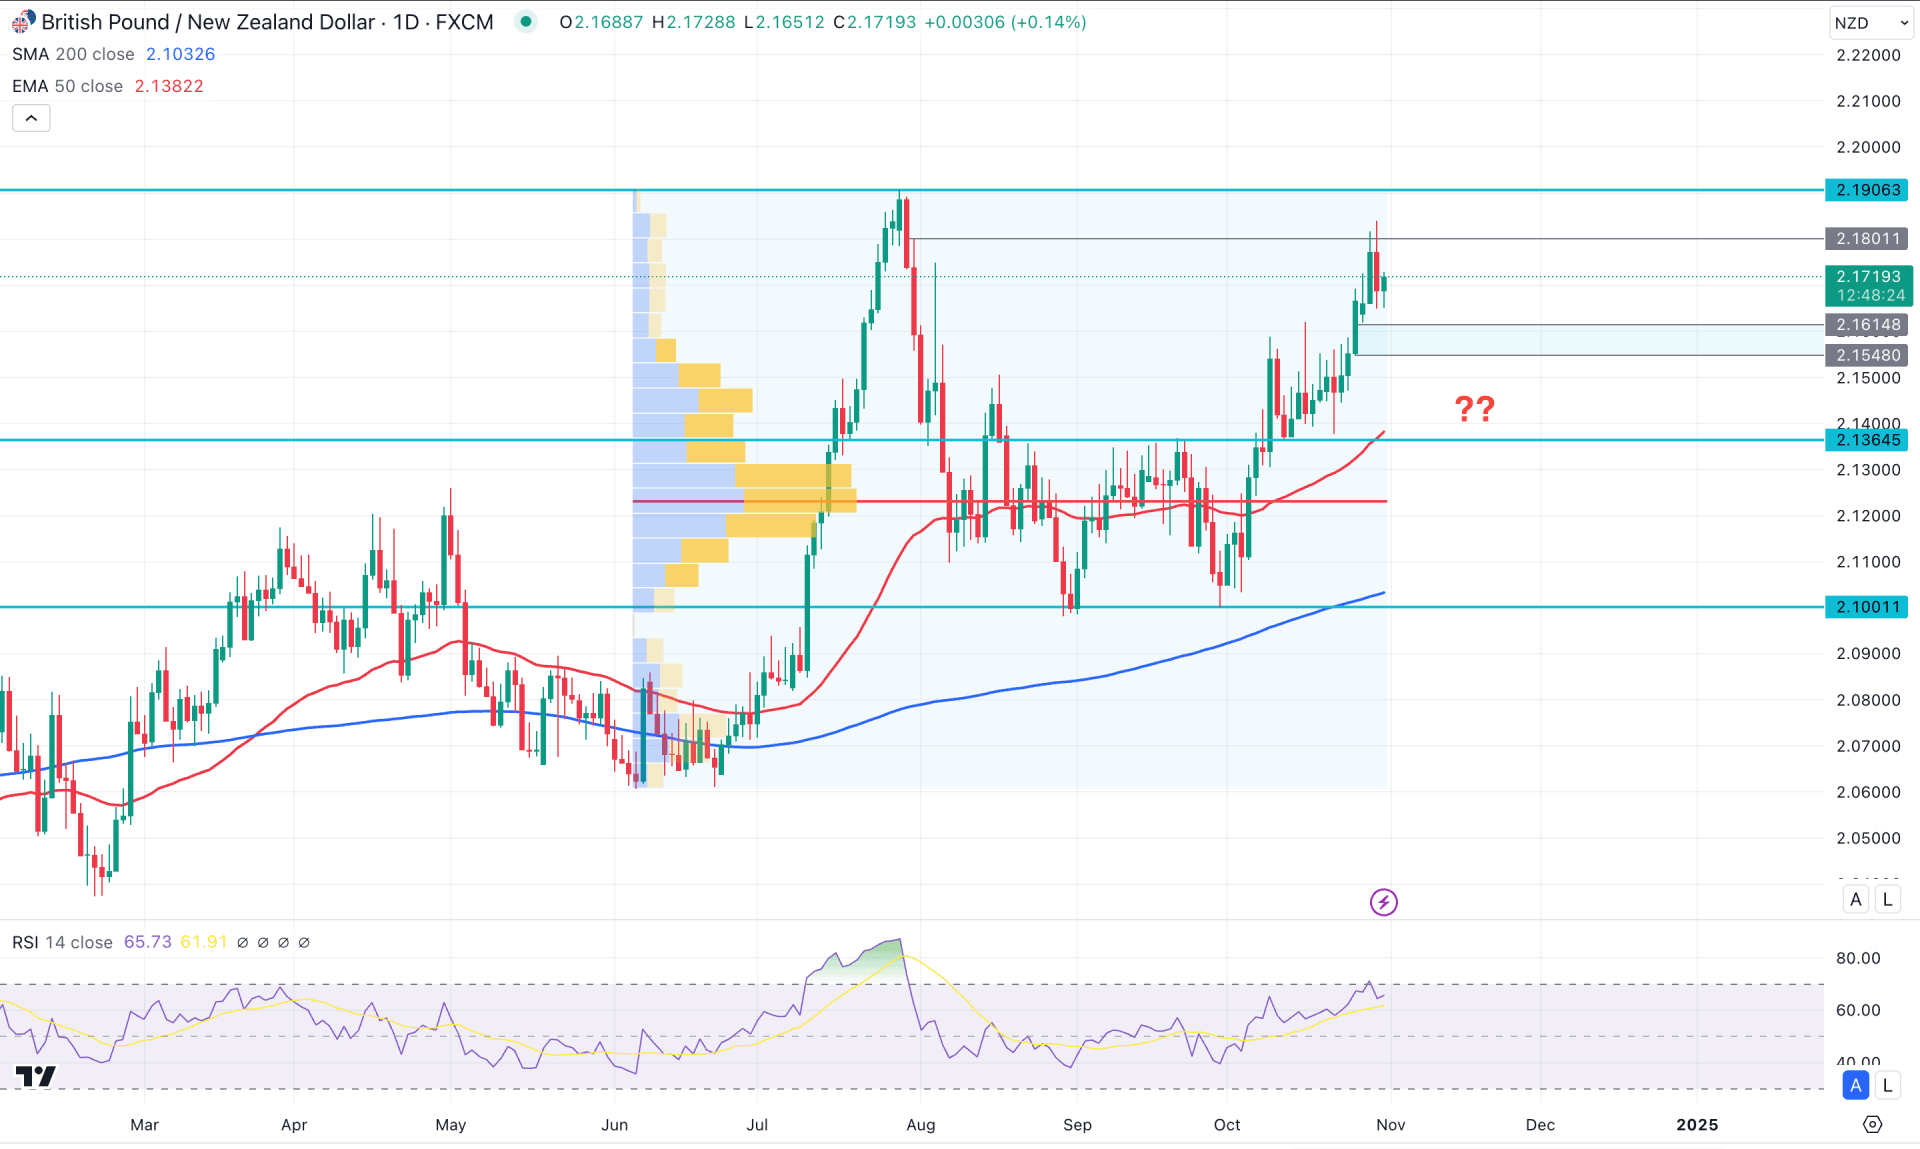
In the daily chart of GBPNZD, the ongoing buying pressure has come with a valid downside correction and a range breakout. After completing potential profit-taking from the July 2024 bull run, it signifies a bullish continuation.
In the higher timeframe, the current price is trading higher in the monthly time frame, where the latest candle was closed as an inverted hammer after a selling pressure. As the current price hovers above the September 2024 high, we may consider the buying pressure valid. Moreover, an upward continuation is visible in the weekly timeframe as five consecutive bullish candles are seen at the latest price.
Looking at the volume, we can see that the upward pressure is also valid where the high volume line is below the 2.1364 static support level. On the other hand, the gap has widened with the current price of over 2.20%, which signals a potential downside pressure as a mean reversion.
In the main price chart, buying pressure is visible above the 200-day SMA and 50-day EMA lines, which signals a strong bullish trend. We can anticipate the ongoing market pressure as bullish as long as these dynamic lines are below the current price.
Moreover, the Relative Strength Index (RSI) shows buying pressure as the current level hovers at 70.00 overbought, the highest level in the last two months.
Based on the ongoing market momentum, investors should monitor how the price trades above the 2.1614 to 2.1548 imbalance zone. The bullish trend continuation is potent, and a bullish reversal from the imbalance zone could offer a long signal, aiming for the 2.2200 level.
On the other hand, the price has reached the crucial bearish order block, below the 29 July high. Moreover, a bearish daily candle is visible from the crucial supply zone, which needs more clues before anticipating a trend reversal.
A bearish daily candle below the 2.1548 level could increase the bearish possibility, targeting the 2.1364 level. Moreover, a consolidation below the immediate imbalance zone could extend the loss towards the 2.1000 area.

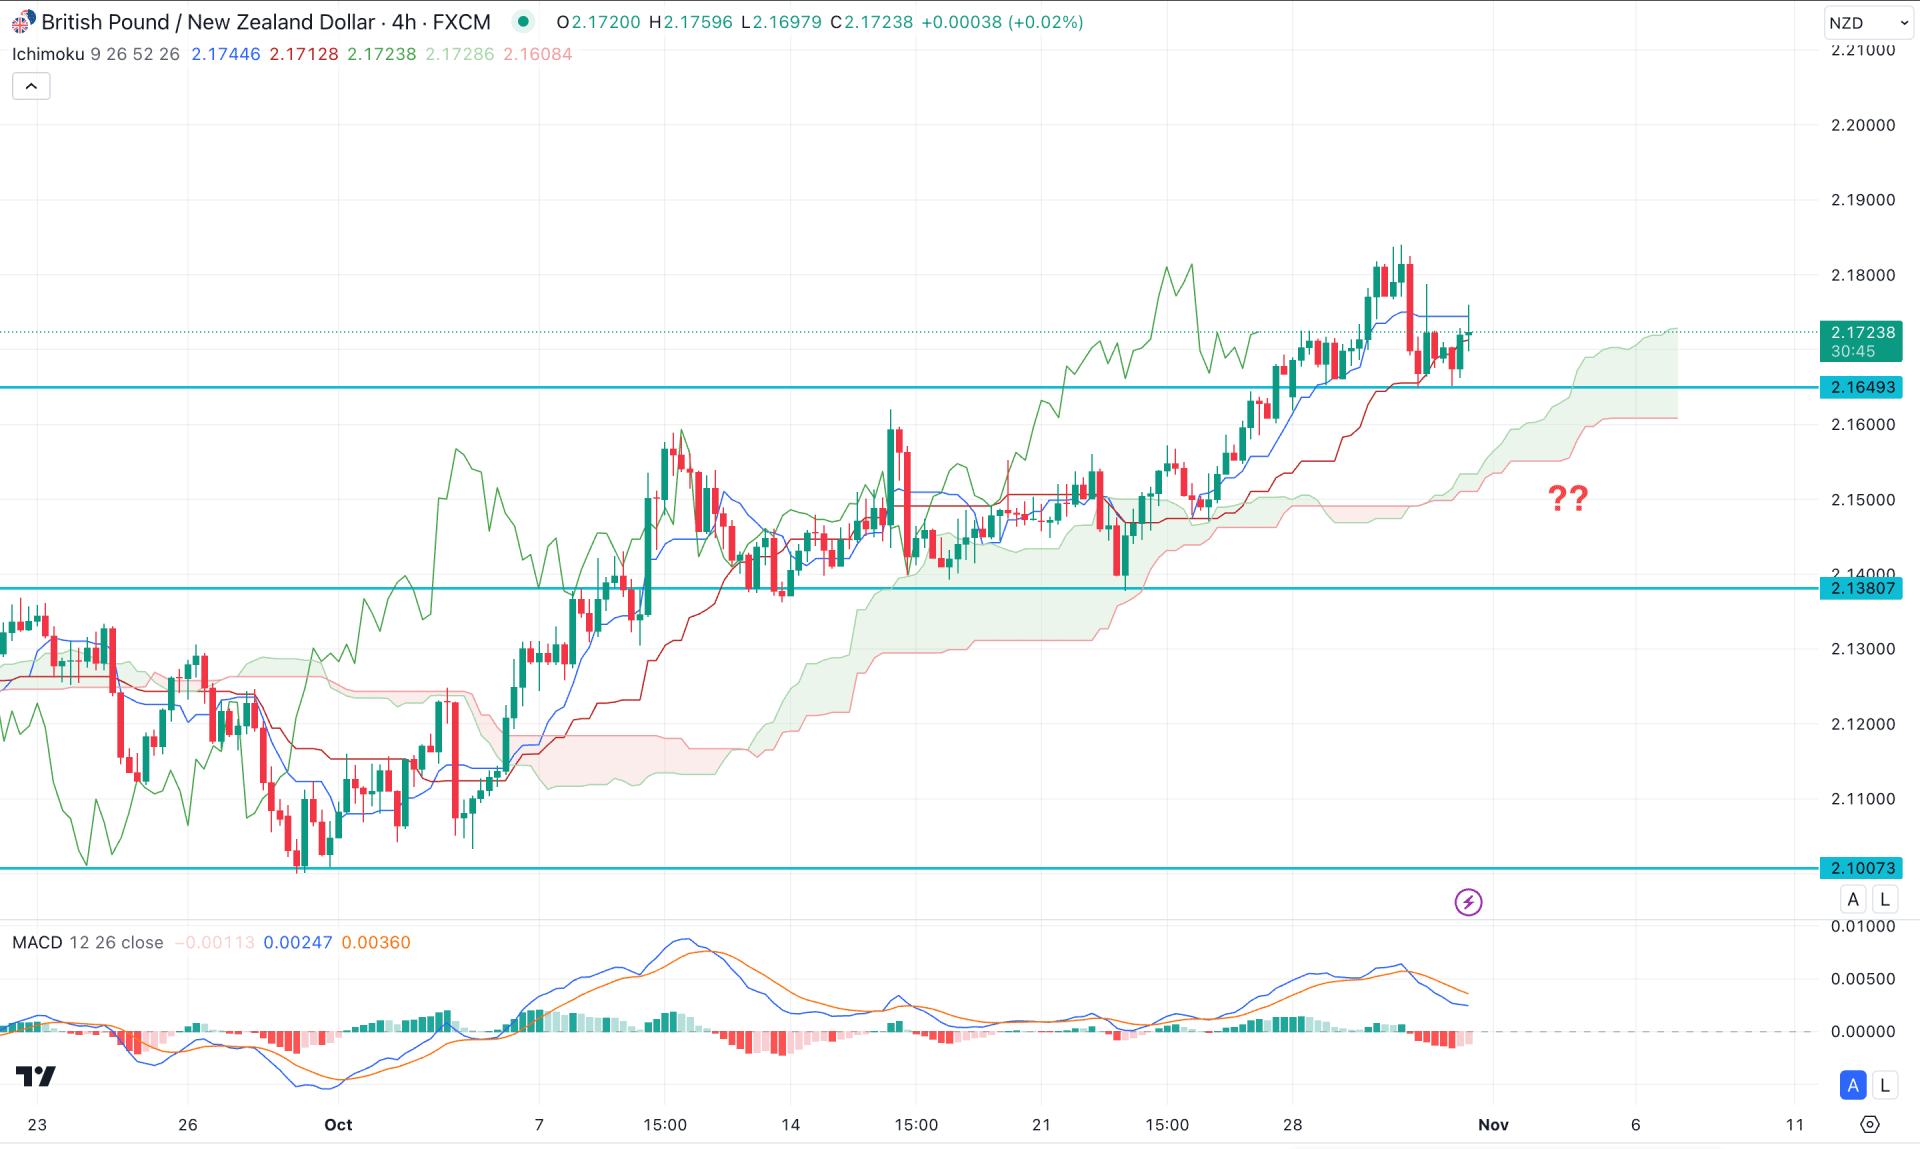
In the H4 timeframe, the ongoing buying pressure is solid as the current price hovers above the Ichimoku Cloud support. However, the most recent price caused a downside pressure below the Tenkan Sen line, which signals a limit for bulls.
On the other hand, the future cloud looks positive to bulls as the Senkou Span A aimed higher above the Senkou Span B.
In the indicator window, a potential MACD Divergence is visible, with a bearish crossover at the top. It is a sign that the main price has found a peak from where downside pressure is coming.
Based on the current market outlook, immediate buying pressure might come from a valid rebound above the Kijun Sen support. However, a failure to hold the price at the 2.1649 static level could find support from the Ichimoku cloud zone. Breaking below the 2.1380 level might lower the price towards the 2.1100 area.

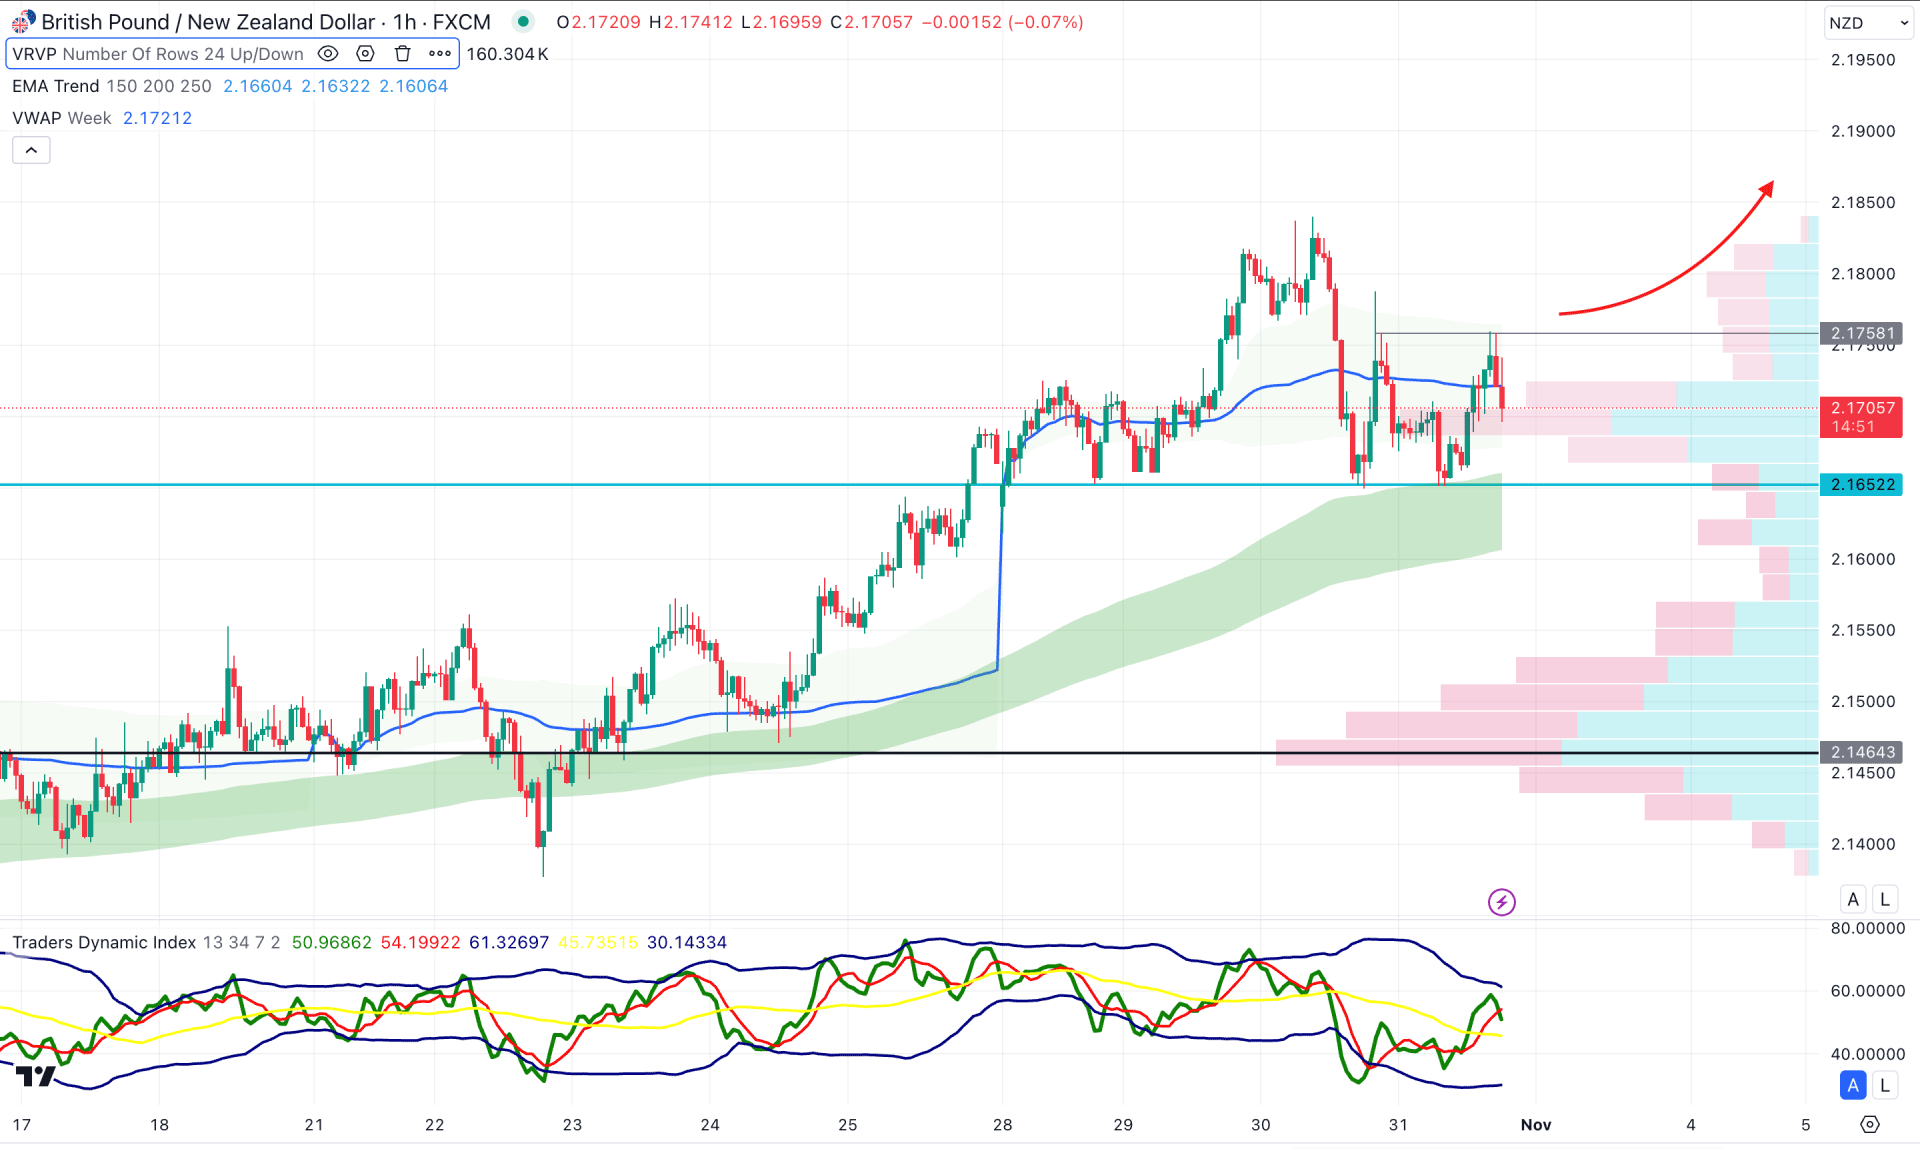
In the hourly time frame, the intraday market momentum is bullish as the current price hovers above the static visible range high volume line. Moreover, the Moving Average wave remains below the current price with a bullish slope. It is a sign that the broader market trend is still bullish from where a continuation is possible.
In the indicator window, the Traders Dynamic Index (TDI) remains in the midline, suggesting a consolidation.
Based on the hourly structure, a bullish break with an hourly candle above the 2.1758 level could open a high-probability long opportunity. On the bullish side, the immediate resistance is at the 2.1850 level before racing to the 2.2000 level.
On the other hand, a failure to hold the price above the 2.1652 static line could eliminate the bullish possibility and aim for the 2.1500 psychological level.
Based on the current market outlook of GBPNZD, Investors might find a possible bearish pressure after having a solid price action in the daily chart. As the long-term market momentum is bullish the price is likely to increase after having a solid rebound in that intraday chart.