
Published: May 15th, 2025
Following the announcement of the UK's GDP data, the GBP saw bids against other currencies. In contrast to the estimates of 0.6%, the Office for National Statistics (ONS) announced that the economy expanded at a strong rate of 0.7% during the January–March period. In the final quarter of 2024, the economy hardly grew.
The UK's first-quarter preliminary GDP growth was 1.3% year over year, which was slower than the previous announcement of 1.5% but marginally higher than forecasts of 1.2%. Following a 0.5% gain in February, analysts had predicted a flat performance, but the UK economy grew by 0.2% in March.
Strong financial stability is reflected in higher UK GDP growth, which raises the pound sterling and reduces expectations of interest rate reductions by the Bank of England (BoE).
Due in part to New Zealand's close trading relations with China, the New Zealand Dollar (NZD) is strengthening as tensions in the US-China trade conflict appear to be reducing. A temporary deal to reduce mutual tariffs between the US and China has allayed fears of a complete trade dispute between the two biggest economies in the world. China lowered duties on US imports from 125% to 10% as part of the agreement, and the US lowered taxes on Chinese products from 145% to 30%. For ninety days, these updated tariffs will be in effect.
Let's see the upcoming price projection from the GBPNZD technical analysis:
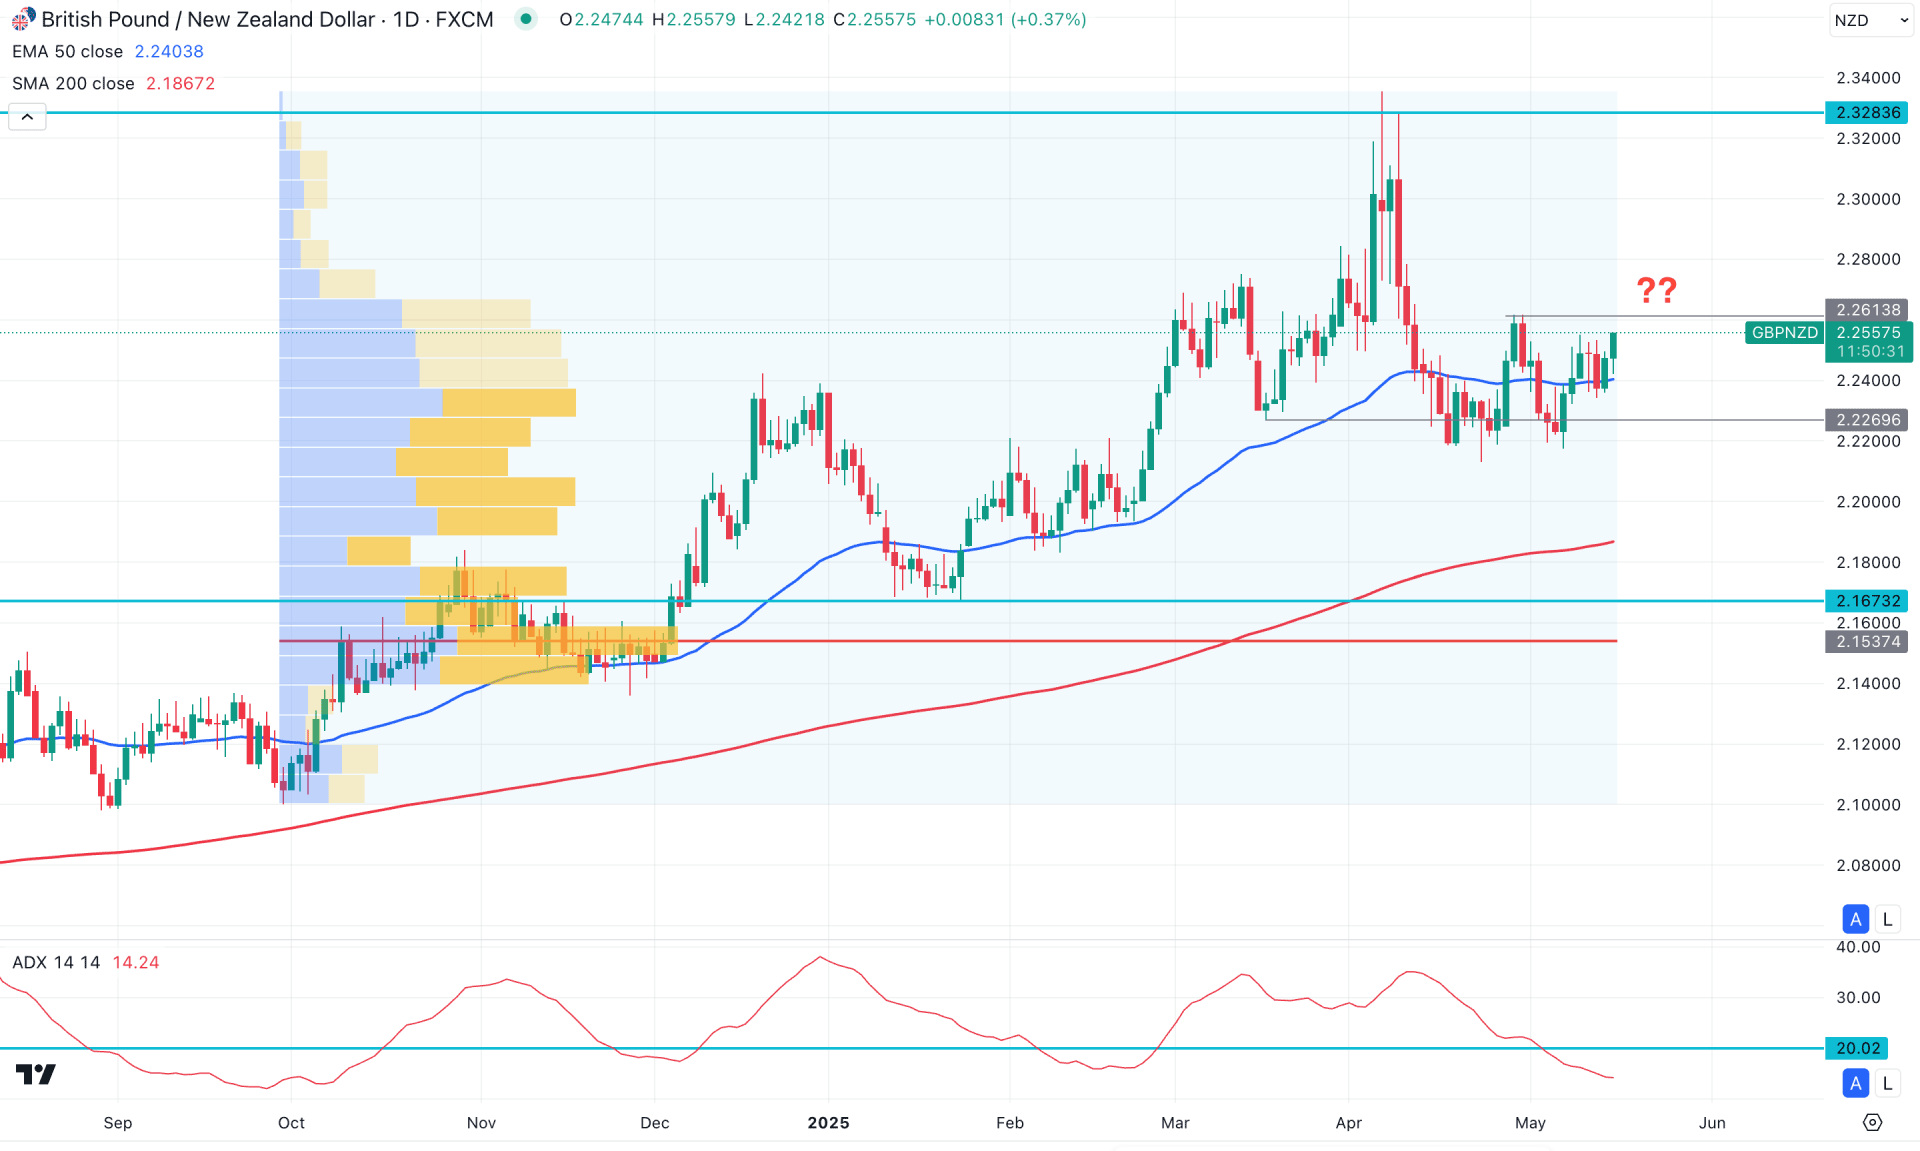
The broader market context remains bullish in the daily chart of GBPNZD, as the recent price action shows a minor downside correction from the yearly high. Given this, the primary approach for this pair is to look for long trades, provided there is a valid intraday confirmation.
On the higher timeframe, the price structure is still bullish. The most recent monthly candle closed as an outside bar, failing to make a new monthly close above the existing swing high. This primarily indicates indecision, suggesting that a valid breakout is needed. A bullish monthly candle above the 2.2727 level could be a significant signal for buyers, potentially pushing the price above the 2.3283 resistance level.
Regarding volume structure, the most active level since October 2024 is at 2.1537, which lies well below the current price. As long as the price maintains a bullish structure above this high-volume area, bullish pressure is likely to continue in the coming days.
On the main price chart, the 200-day Simple Moving Average is a key support. It is currently positioned below the near-term swing low and showing a bullish slope. Additionally, the 50-day Exponential Moving Average provides immediate support, indicating a higher probability of a bullish reversal.
From a price action perspective, the bullish liquidity hunt from the 2.3200 level led to an immediate recovery, with the daily candle closing below the 2.2269 low. However, instead of forming a new swing low, the price consolidated and moved higher toward the 2.2613 resistance level. Traders should closely watch the price reaction at this resistance—an impulsive breakout above it could confirm the continuation of the bullish trend.
In the secondary indicator window, the Average Directional Index (ADX) has fallen below the 20.00 line, indicating weak directional momentum. A bullish crossover of the ADX above 20.00, combined with a daily candle close above the 2.2613 resistance, could provide a valid long opportunity targeting the 2.3000 level.
On the other hand, a range-bound extension could occur if the price fails to break above the 2.2613 resistance. In that case, a bearish daily candle closing below the 50-day Exponential Moving Average could initiate a short opportunity, potentially pushing the price below the 2.2131 support level.
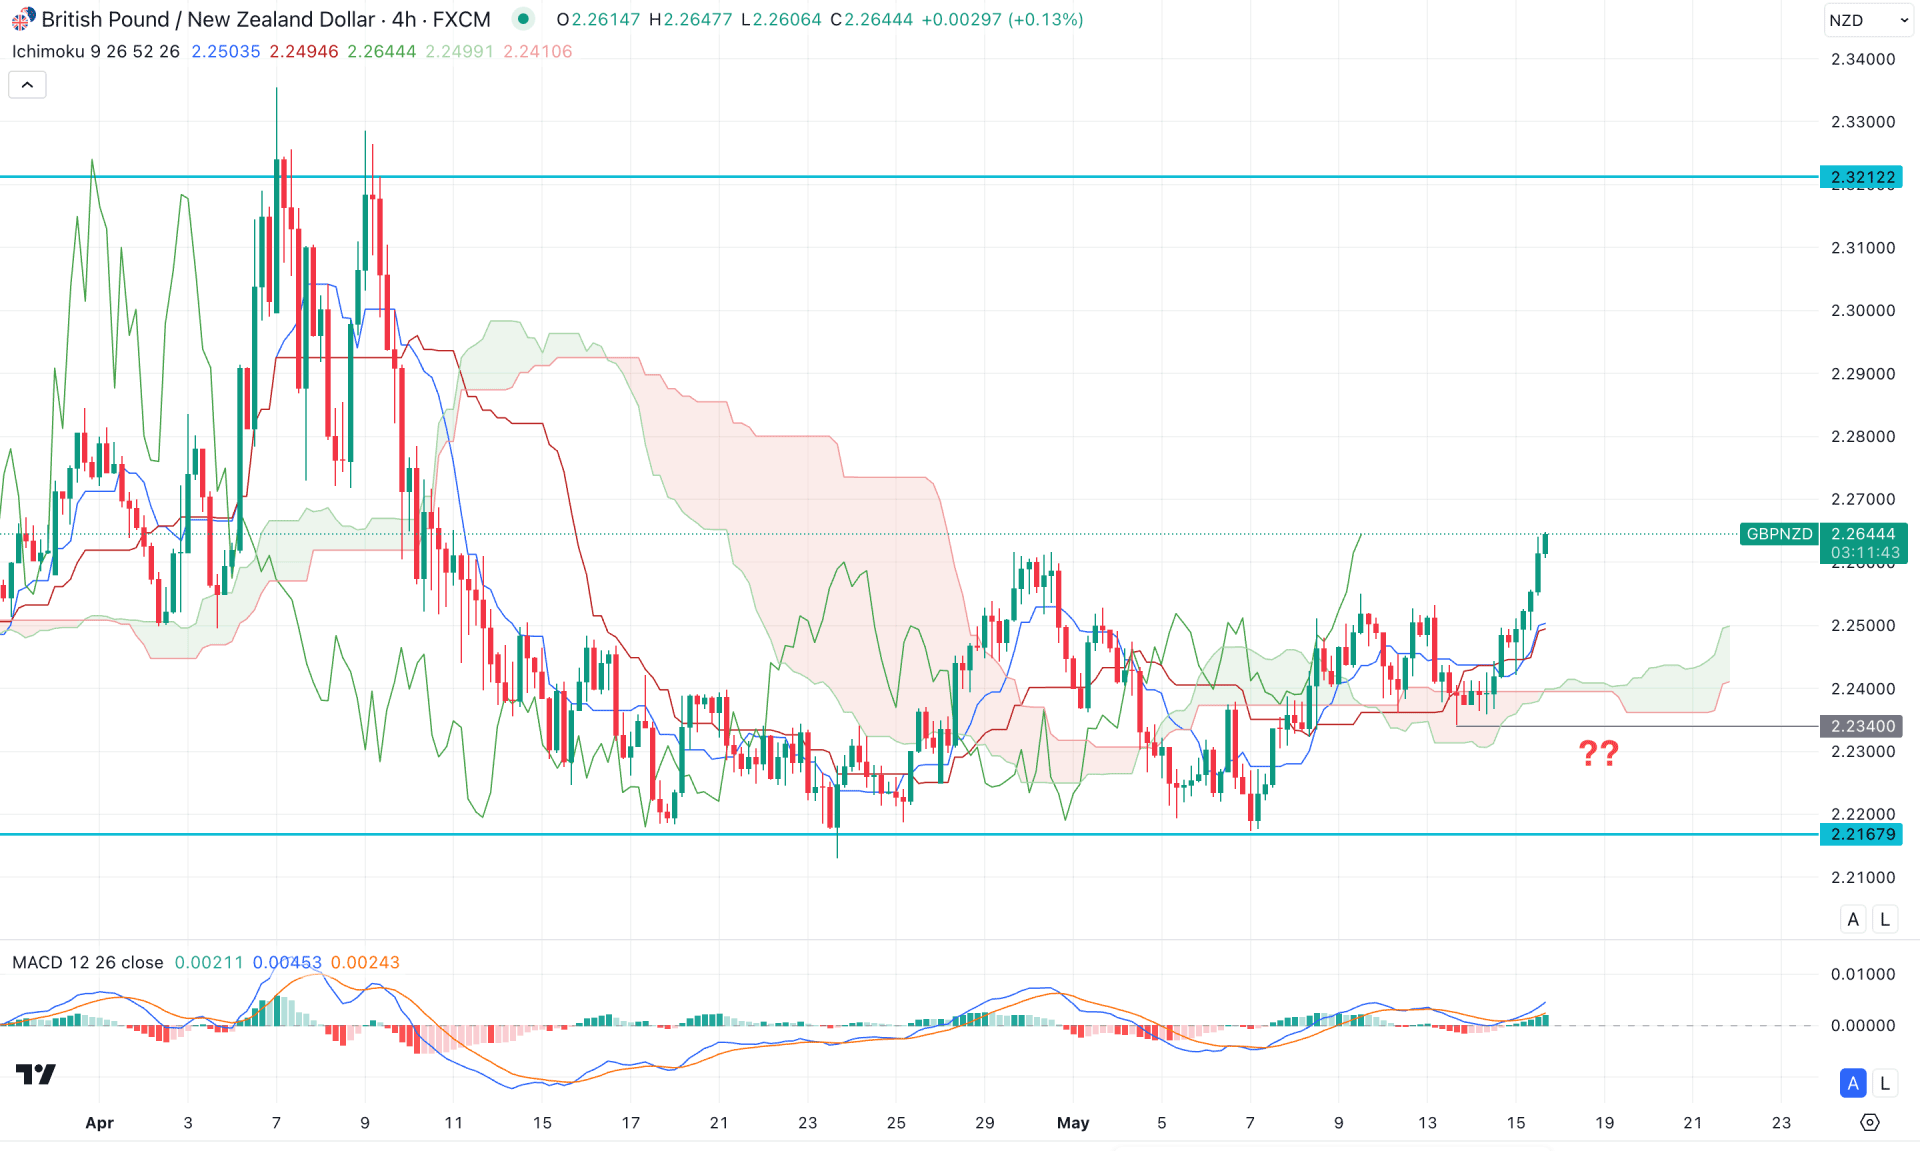
In the four-hour timeframe, the current price of GBPNZD is trading higher, supported by a rising trendline. Additionally, the Kumo Cloud is positioned below the current price, acting as a confluence support.
In the future cloud, the Senkou Span B is flat, signalling indecision among medium-term traders. Moreover, the MACD signal line has formed a bullish crossover at the top, followed by consecutive Green histograms, indicating potential upward momentum.
In this context, the recent pullback after testing the 2.2340 swing low suggests a possible short-term correction to the downside.
Given this scenario, the primary strategy is to look for bearish trades if a four-hour candle closes below the dynamic Tenkan Sen support. However, confirmation of medium-term bearish strength would require a break of the trendline followed by consolidation below it.
On the other hand, if the price fails to break below the cloud support, it could be interpreted as a bullish signal. In that case, a strong upward recovery with a four-hour candle closing above the cloud could lead to a new swing high above the 2.3000 level.
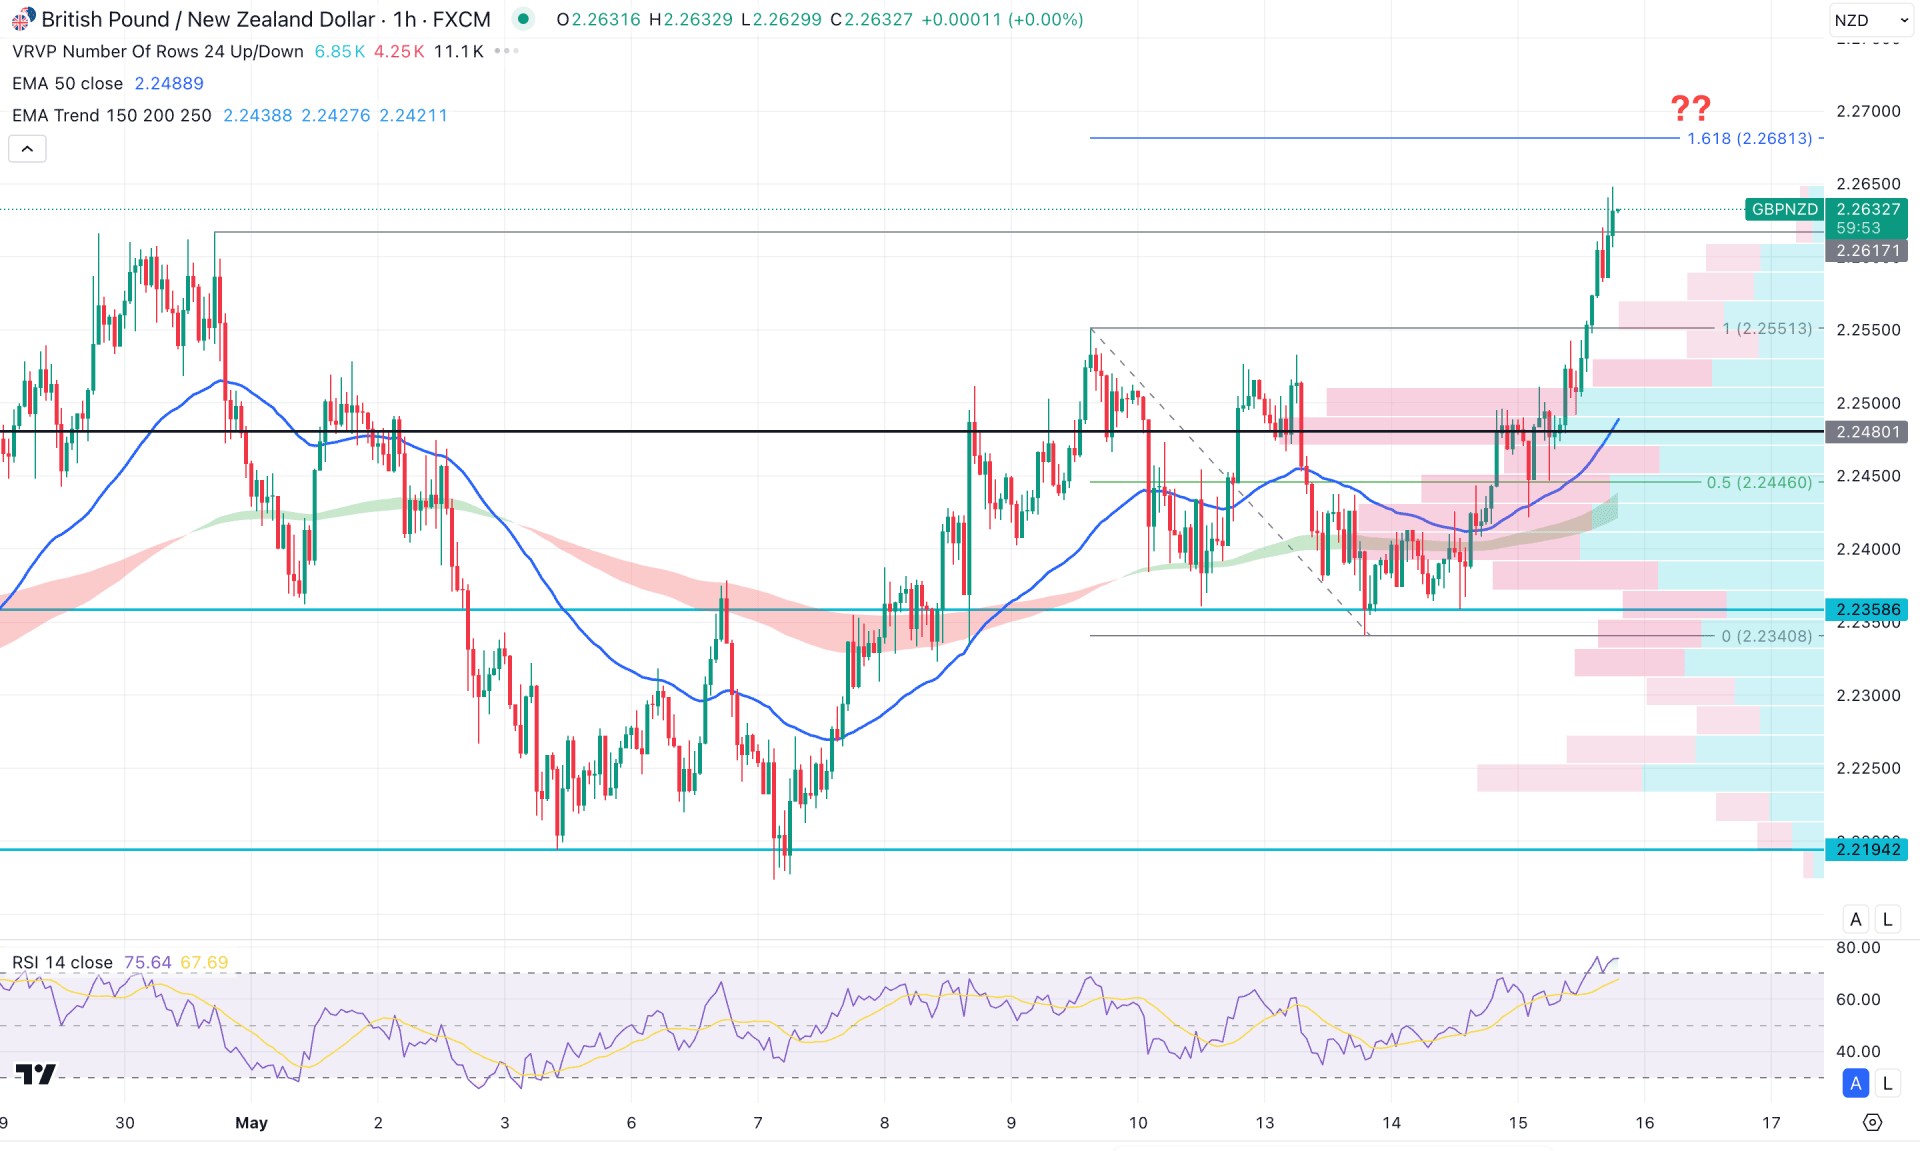
In the hourly time frame, the recent price is trading higher by creating new intraday highs, which signals an ongoing bullish trend. In that case, the possible top formation from the ABCD pattern could be a minor short opportunity after a proper validation.
On the downside, the Moving Average wave is below the current price, working as a crucial support. Moreover, the RSI has headed above the 70.00 overbought level, which is an early sign of a top formation.
Based on this outlook, an immediate bullish continuation might relieve some pressure at the 161.85 Fibonacci Extension level, which is at the 2.2681 level. However, the uptrend is valid as long as the price trades above the 2.2480 line. A break below this line could signal a valid bearish reversal, which could find a bottom at the 2.2194 level.
Based on the current market outlook, GBPNZD is trading with bullish momentum, and a valid range breakout from the daily demand zone is pending. However, a minor downside recovery is pending in the intraday time frame, and an early long opportunity could come.


