
Published: January 29th, 2026
Compared to the sterling, the Japanese yen (JPY) remains in the lead. The Bank of Japan could intervene to stop further declines in the native currency, which has been an important factor for the GBPJPY price.
But worries about Japan's financial situation, stemming from Prime Minister Sanae Takaichi's ambitious plans for tax cuts and spending, prevent JPY bulls from making further wagers. Additionally, generally bullish risk sentiment and political unpredictability ahead of an emergency election on February 8 help limit gains for the safe-haven Japanese yen.
Furthermore, Sanae Takaichi, the prime minister of Japan, reaffirmed hopes on Sunday that authorities would intervene to stop the weakening of the Japanese yen, warning that they are prepared to take necessary action against speculative and extremely abnormal market movements.
Last Monday, the Bank of Japan raised its inflation and economic growth projections for the 2026 budget year while keeping the temporary interest rate at 0.75%. Additionally, the central bank indicated that it was prepared to keep raising the already low cost of borrowing.
The UK's strong Shop Prices Index, announced on Tuesday, helped bolster the already high value of the pound, which was further supported by last week's positive retail spending and business activity statistics.
Let's see the further outlook of this pair from the GBPJPY multi-timeframe analysis:
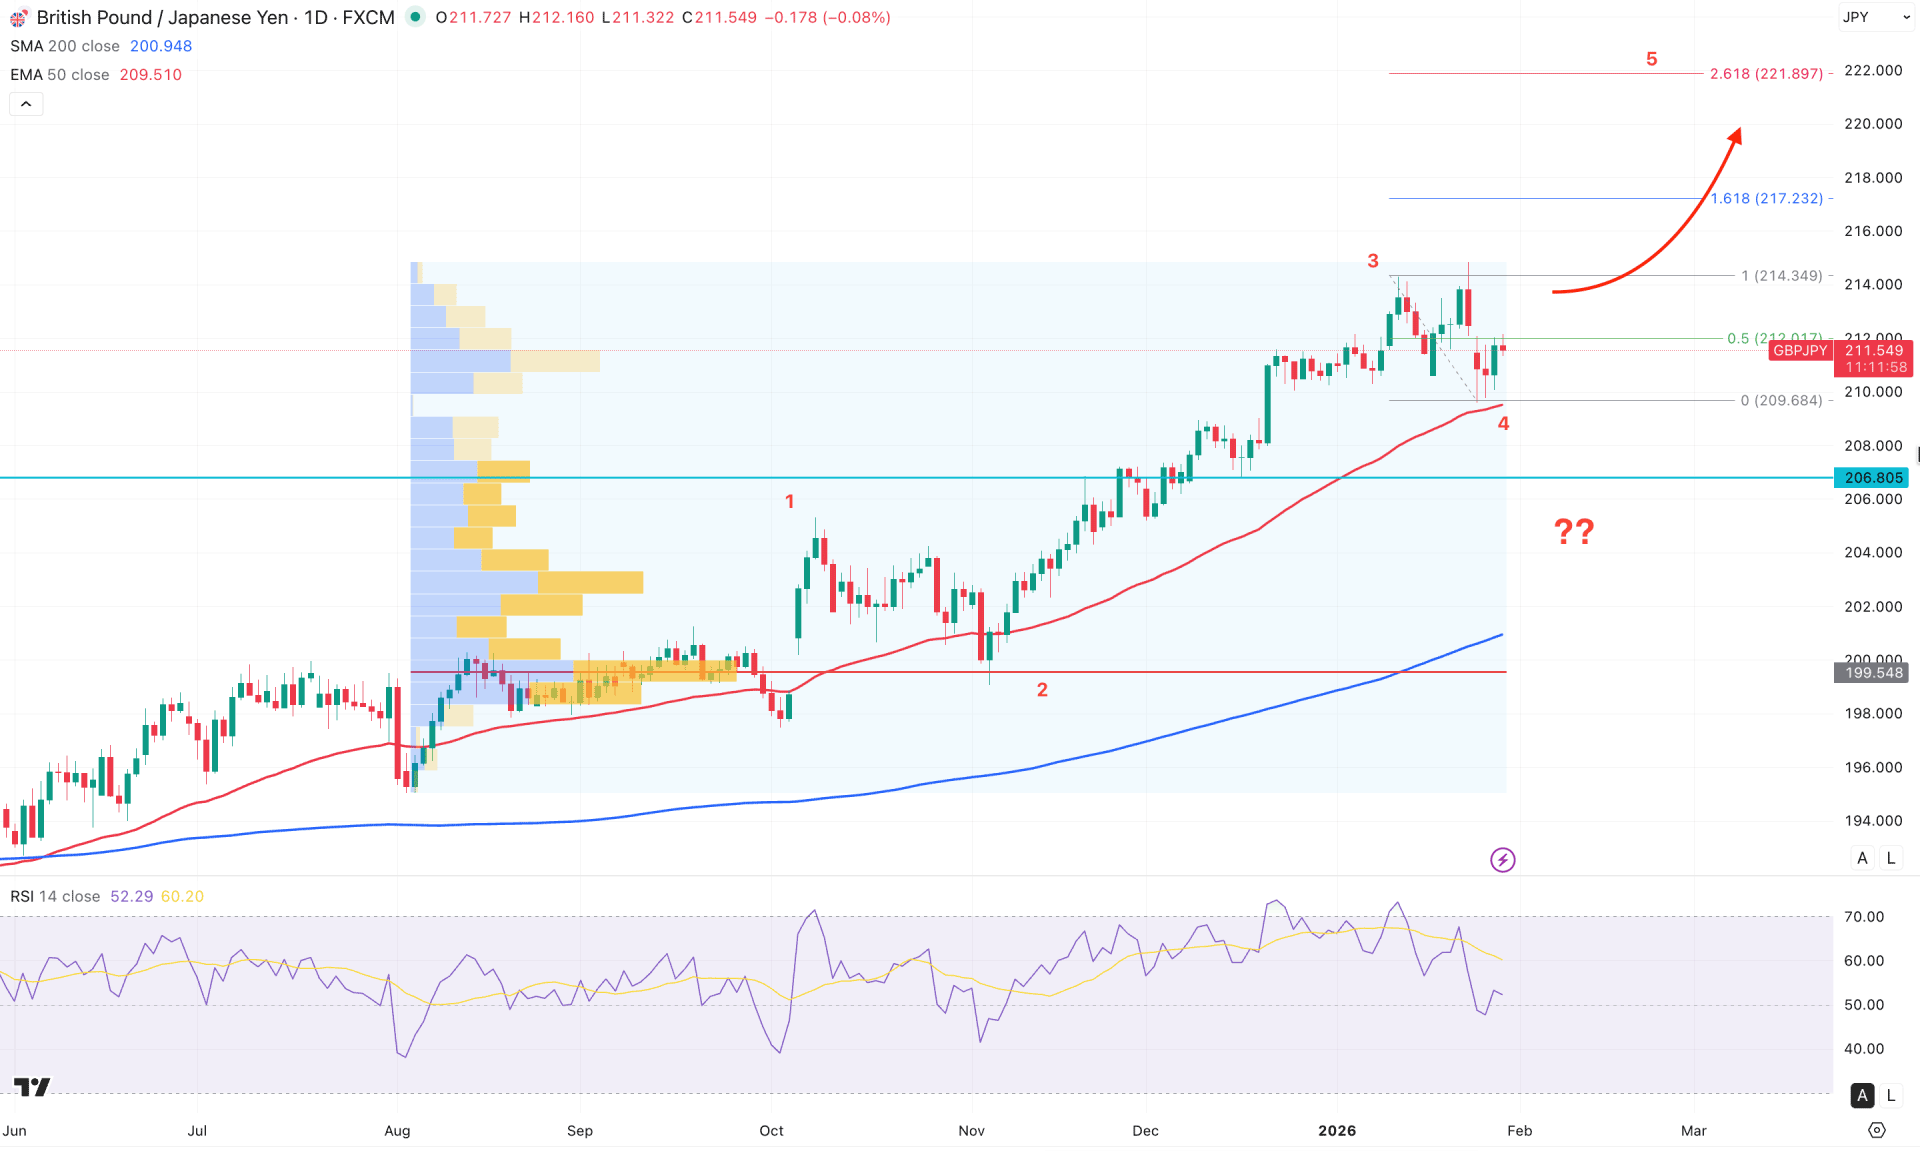
On the daily chart of GBPJPY, the major market momentum remains bullish. Although some extended volatility is visible in the most recent move, it is still too early to consider this a top formation. Moreover, price action is rising within a crucial wave structure, suggesting that further upside pressure remains possible.
After breaking above the 208.00 level, the price continued higher following a minor bearish recovery toward the 192.00 area. The current chart structure indicates that price is trading within a corrective Elliot Wave 4, positioned near the key support zone at 210.00. As long as this support holds, an extended bullish Wave 5 could develop, potentially pushing the price above the 215.00 area.
From a volume perspective, bullish continuation remains solid, as the largest activity level since August 2025 is located well below the current price, indicating an absence of significant high-volume distribution at the top.
In the main price chart, the 200-day SMA is acting as a major support, supported by a bullish crossover near the higher value area. Additionally, the 50-day EMA remains just below the current price, providing immediate support at 209.68.
In the indicator window, momentum appears neutral, with the Relative Strength Index (RSI) hovering around the 50.00 neutral line.
Based on the overall market structure, investors should closely monitor how the price behaves above the 50-day EMA. As long as buying pressure holds above the 201.68 support level, extended bullish momentum could drive prices toward the 217.23 Fibonacci Extension area. A sustained bullish move and a hold above the 214.00 level could further extend gains toward the 222.00 area.
On the bearish side, an immediate failure to overcome the 211.70 resistance level could trigger a downside correction toward the 208.68 level. Furthermore, any strong selling pressure accompanied by a daily close below the 50-day EMA would increase the likelihood of a deeper pullback toward the 206.80 support zone.
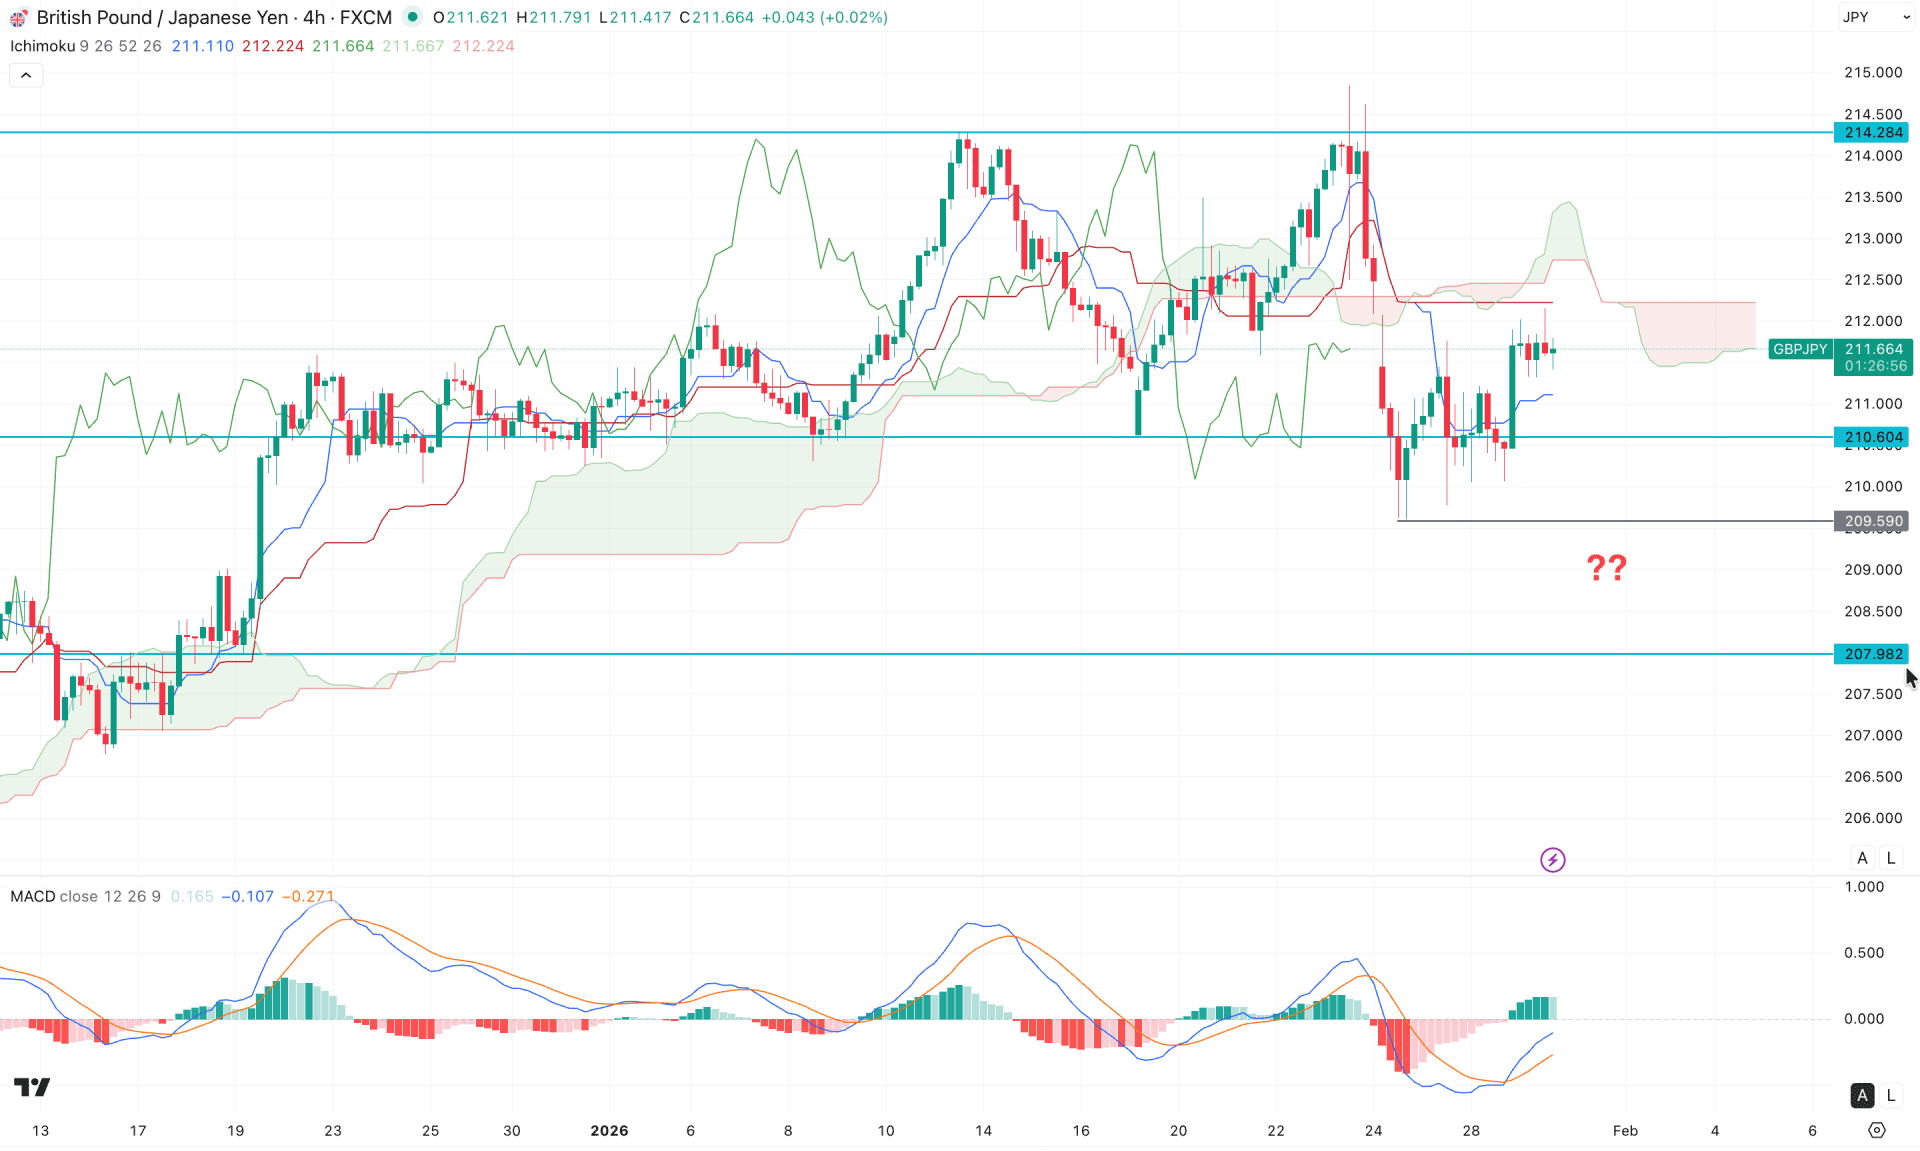
On the H4 timeframe, the recent price action is showing extended volatility, with multiple violations around the Ichimoku Cloud area. After failing to overcome the 214.28 resistance level, the price formed an immediate bearish recovery and was unable to establish a stable structure below the 210.60 level. As a result, a bullish rebound has emerged, even though the price remains below the cloud area.
A strong bullish four-hour candle is present above the Tenkan Sen level; however, the Kijun Sen zone is acting as a resistance barrier for buyers.
In the indicator window, the MACD histogram has started to lose bullish momentum, although the overall momentum remains on the positive side. Overall, the signal lines are approaching a bullish crossover from the lower region, which could indicate a bullish continuation opportunity on the intraday chart.
Based on the overall market structure, it is important to monitor how the price reacts around the key resistance level. A fresh bullish H4 close above the 212.50 level would increase the probability of an upside move toward the 215.00 area.
On the other hand, failure to hold above the 210.60 level could extend a downside correction, potentially creating another bullish opportunity near the 209.59 support level.
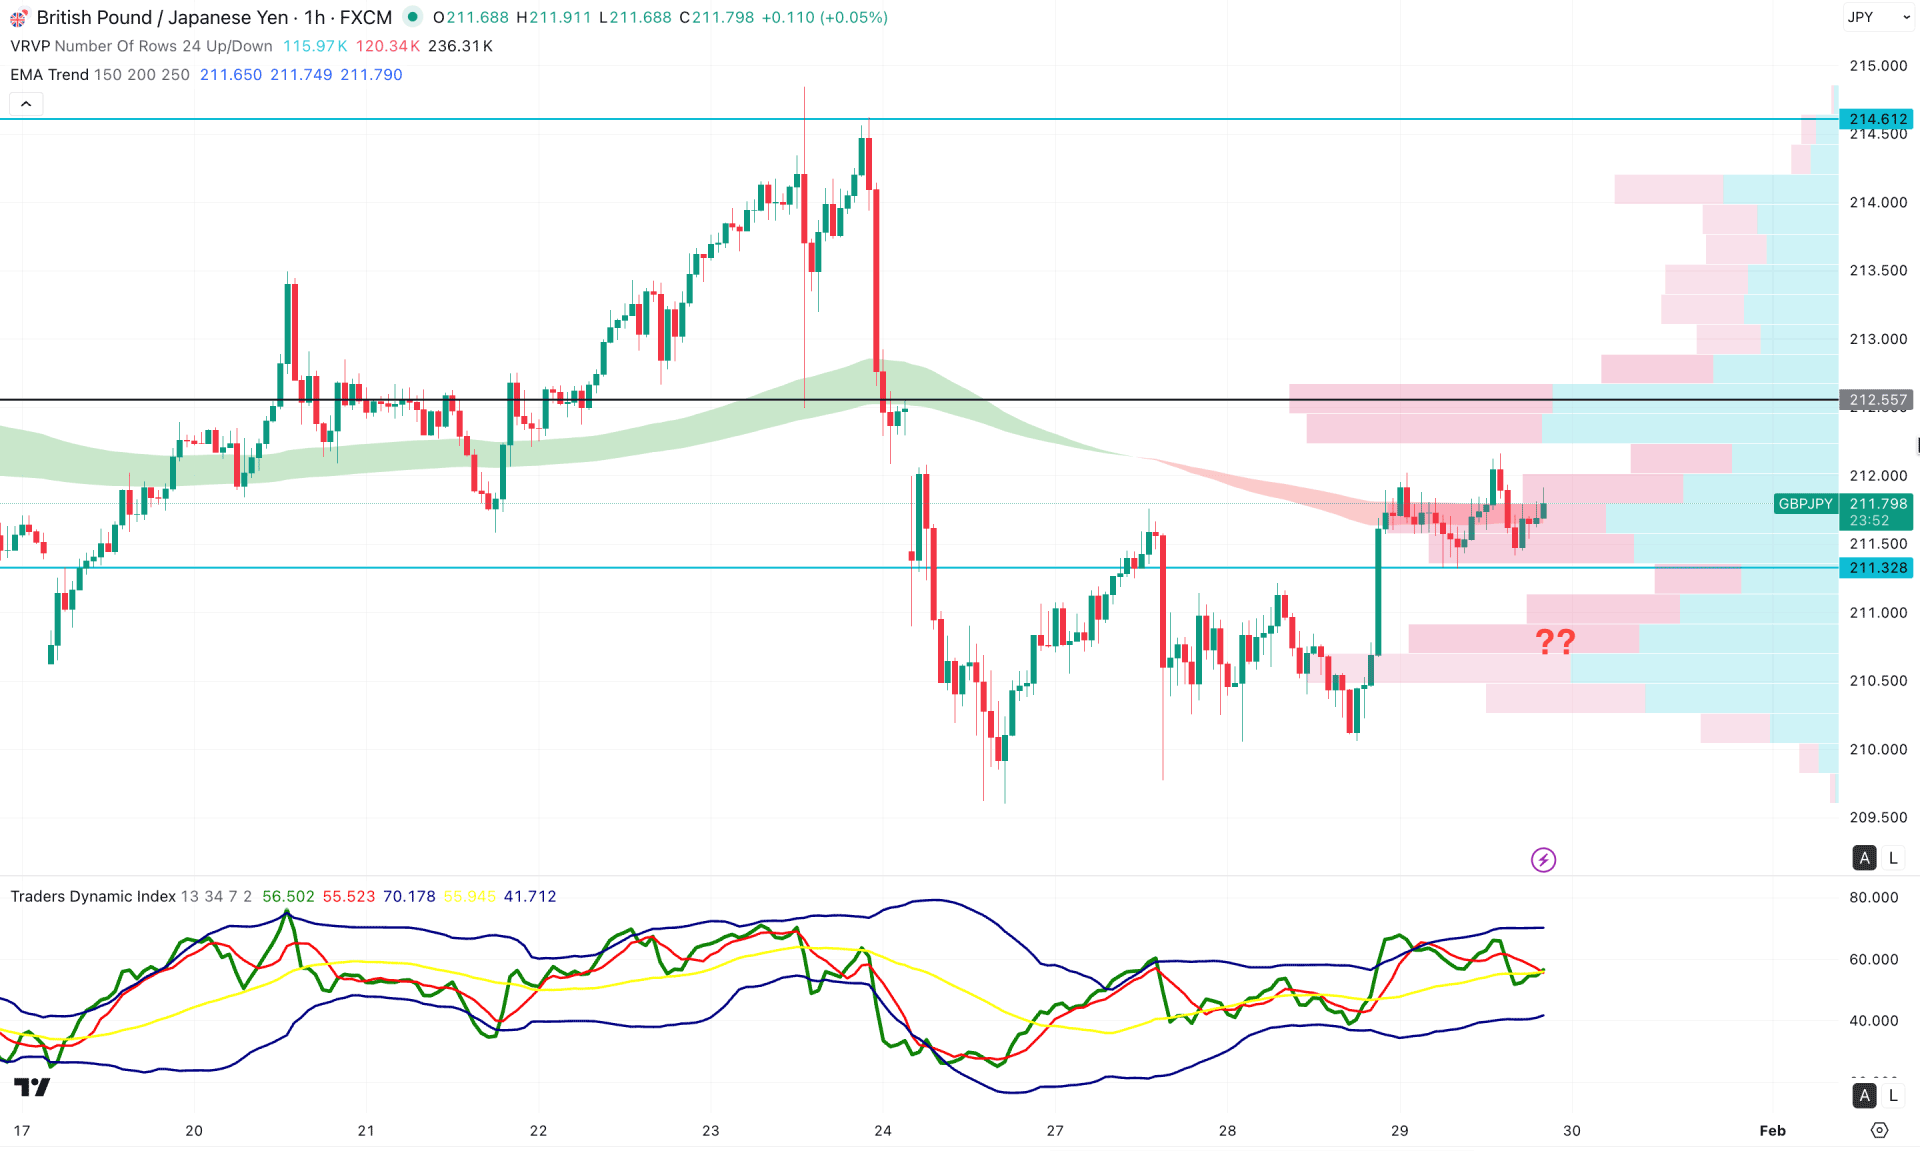
In the hourly chart of GBPJPY, extended intraday volatility is evident, with the current price hovering near the EMA wave area. Moreover, the intraday high volume line is above the current price, working as a resistance.
In the indicator window, the Traders Dynamic Index (TDI) is hovering at the 50.00 neutral line, suggesting a sideways momentum.
Based on this outlook, a bullish rebound could follow a move above a high-volume line with a bullish H1 candle.
On the other hand, a potential range extension is possible where the 211.32 level could be a potential bottom. A break below this line with a consolidation could signal more selling pressure towards the 209.50 area.
Based on the overall market structure, GBPJPY is trading within a stable bullish trend, where the recent downside recovery could influence bulls to join the rally from a discounted price. As no significant top formation is seen, the price is likely to create a new swing high after having a confirmation from the intraday price.


